EUR/AUD Double Bottom Confirmed , Long Setup To Get 150 Pips !Here Is My 4H EUR/AUD Chart And Here Is My Opinion , We have a very clear reversal pattern ( double bottom ) and we have a closure above our neckline so this pattern already confirmed and also we have a broken 4h down trend line the price broke it and closed above it also with a very huge bullish candle and the price still not back to retest this broken neckline and down trendline and as you know we sold this pair the week before last week and it was a very big movement to downside without any correction so i believe that we will have a huge movement to upside as we did before so now i`m waiting the price to go back and retest my buying area and give me any good bullish price action and then we can enter a buy trade and targeting 70:150 pips and using a decent stop loss , if we have a daily closure below my buying area then this idea will not be valid anymore .
Entry Reasons :
- Over Sold
- Clear Reversal Pattern
- Broken Trend Line
- Bullish Price Action .
- Pattern Confirmed
Euro / Australian Dollar
No trades
No trades
In-depth trading ideas
EURAUD BUY SIGNAL. Don't forget about stop-loss.
Write in the comments all your questions and instruments analysis of which you want to see.
Friends, push the like button, write a comment, and share with your mates - that would be the best THANK YOU.
P.S. I personally will open entry if the price will show it according to my strategy.
Always make your analysis before a trade
Bearish reversal at key resistance?EUR/AUD is rising toward the pivot, which has been identified as an overlap resistance and could reverse toward the 1st suport which is a pullback support.
Pivot: 1.65021
1st Support: 1.64085
1st Resistance: 1.66108
Disclaimer:
The opinions given above constitute general market commentary and do not constitute the opinion or advice of IC Markets or any form of personal or investment advice.
Any opinions, news, research, analyses, prices, other information, or links to third-party sites contained on this website are provided on an "as-is" basis, are intended to be informative only, and are not advice, a recommendation, research, a record of our trading prices, an offer of, or solicitation for, a transaction in any financial instrument and thus should not be treated as such. The information provided does not involve any specific investment objectives, financial situation, or needs of any specific person who may receive it. Please be aware that past performance is not a reliable indicator of future performance and/or results. Past performance or forward-looking scenarios based upon the reasonable beliefs of the third-party provider are not a guarantee of future performance. Actual results may differ materially from those anticipated in forward-looking or past performance statements. IC Markets makes no representation or warranty and assumes no liability as to the accuracy or completeness of the information provided, nor any loss arising from any investment based on a recommendation, forecast, or any information supplied by any third party.
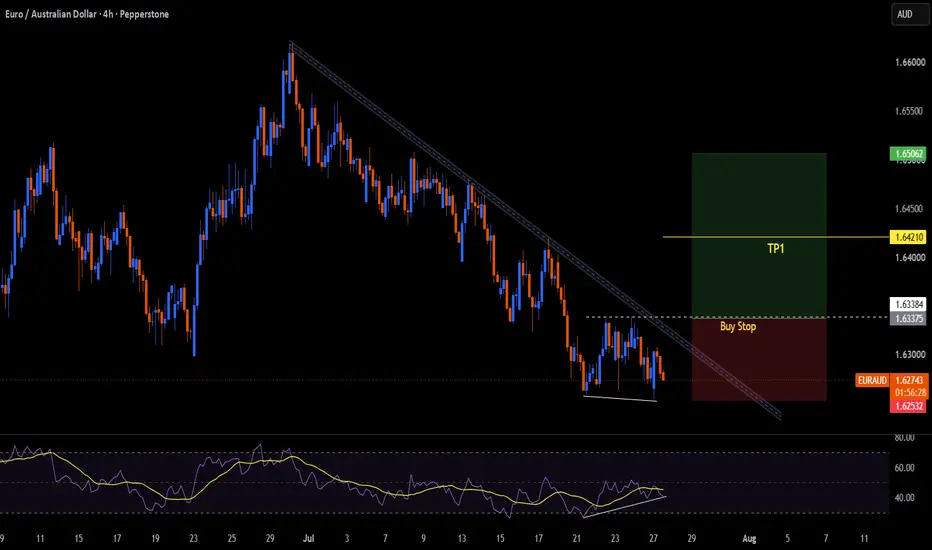
EURAUD📈 **EURAUD | 4H Timeframe Analysis**
EURAUD is approaching a potential trend reversal after spending several weeks in a well-defined bearish channel.
One of the key concepts I focus on is waiting for **confirmation**, not anticipation. Rather than buying into a falling market, I'm watching for a **break and close above the descending trendline**, which could signal a shift in momentum.
🔍 **Technical Overview**
✅ Price is testing the lower boundary after an extended downtrend
✅ Bullish RSI divergence suggests selling pressure is weakening
✅ Buy Stop positioned above resistance for confirmation
✅ Potential breakout could lead to a move toward the next key resistance level
🎯 **Trade Plan**
• **Entry:** Buy Stop above the recent swing high
• **Confirmation:** Break and close above the descending trendline
• **Stop Loss:** Below the recent swing low
• **Take Profit (TP1):** 1.6421
• **Risk-to-Reward:** Approximately 1:1.5
The combination of **bullish RSI divergence** and a **potential trendline breakout** creates an interesting setup. However, the trade remains valid only if buyers prove their strength by breaking the current bearish structure.
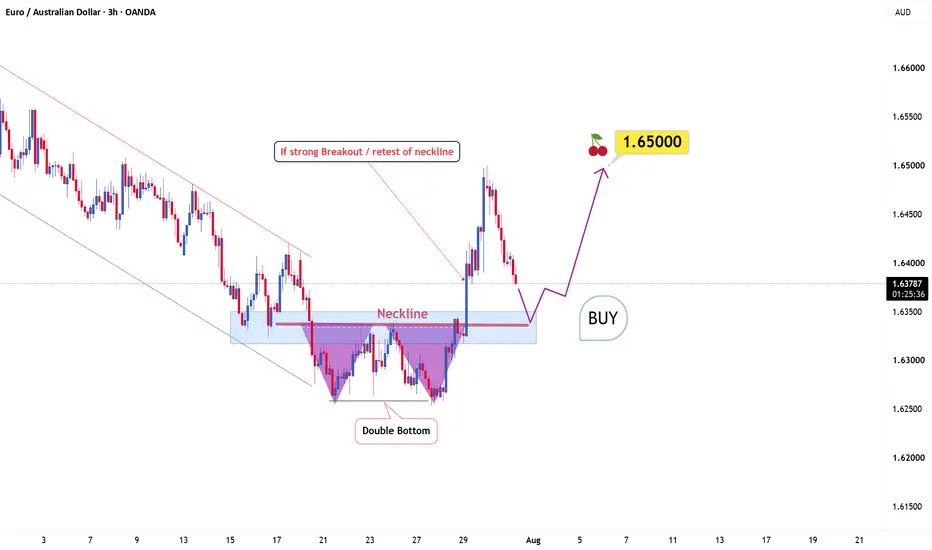
Double Bottom Reversal likely for EURAUDPrice has been moving in a clear downtrend within a descending channel. After the recent decline, notice how EURAUD appears to have formed a double-bottom pattern near the lows. This type of structure often develops after a strong sell-off, when selling pressure begins to weaken and buyers gradually return.
The neckline is the key level to watch now, and price has already started breaking above this area. A strong breakout candle could confirm the pattern, but the safer approach would be to wait for price to return and retest the neckline. If the former resistance holds as support, it could provide an ideal entry for the next bullish move.
The projected target is calculated by measuring the height of the double bottom and adding it above the neckline. In this case, the bullish target is around 1.6500. A stop loss could be placed below the neckline after the retest, or more conservatively below the second bottom.
A double-bottom pattern can provide a reliable signal, although its accuracy still depends on volatility, unexpected events, and broader market conditions. For now, if the neckline holds during the retest and shows a strong rejection of lower prices, the probability of EURAUD continuing higher would increase significantly.
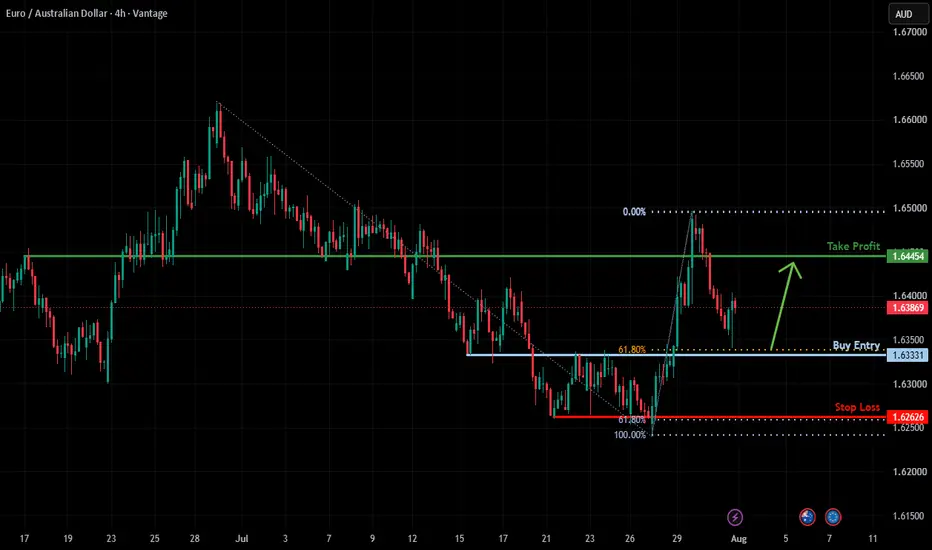
Bullish bounce off 61.8% Fib support?EUR/AUD is falling to the support level, which is an overlap support that aligns with the 61.8% Fibonacci retracement and could rise from this level to our take profit.
Entry: 1.63331
Why we like it:
There is an overlap support level that aligns with the 61.8% Fibonacci retracement.
Stop loss: 1.62626
Why we like it:
There is a pullback support level that aligns with the 61.8% Fibonacci projection.
Take profit: 1.64454
Why we like it:
There is an overlap resistance level.
Enjoying your TradingView experience? Review us!
Please be advised that the information presented on TradingView is provided to Vantage (‘Vantage Global Limited’, ‘we’) by a third-party provider (‘Everest Fortune Group’). Please be reminded that you are solely responsible for the trading decisions on your account. There is a very high degree of risk involved in trading. Any information and/or content is intended entirely for research, educational and informational purposes only and does not constitute investment or consultation advice or investment strategy. The information is not tailored to the investment needs of any specific person and therefore does not involve a consideration of any of the investment objectives, financial situation or needs of any viewer that may receive it. Kindly also note that past performance is not a reliable indicator of future results. Actual results may differ materially from those anticipated in forward-looking or past performance statements. We assume no liability as to the accuracy or completeness of any of the information and/or content provided herein and the Company cannot be held responsible for any omission, mistake nor for any loss or damage including without limitation to any loss of profit which may arise from reliance on any information supplied by Everest Fortune Group.
EURAUD FREE SIGNAL|SHORT|
✅EURAUD expecting a rejection from the ICT supply zone after the retracement, with sell-side order flow likely to resume and target the resting liquidity below.
—————————
Entry: 1.6399
Stop Loss: 1.6421
Take Profit: 1.6369
Time Frame: 3H
—————————
SHORT🔥
✅Like and subscribe to never miss a new idea!✅
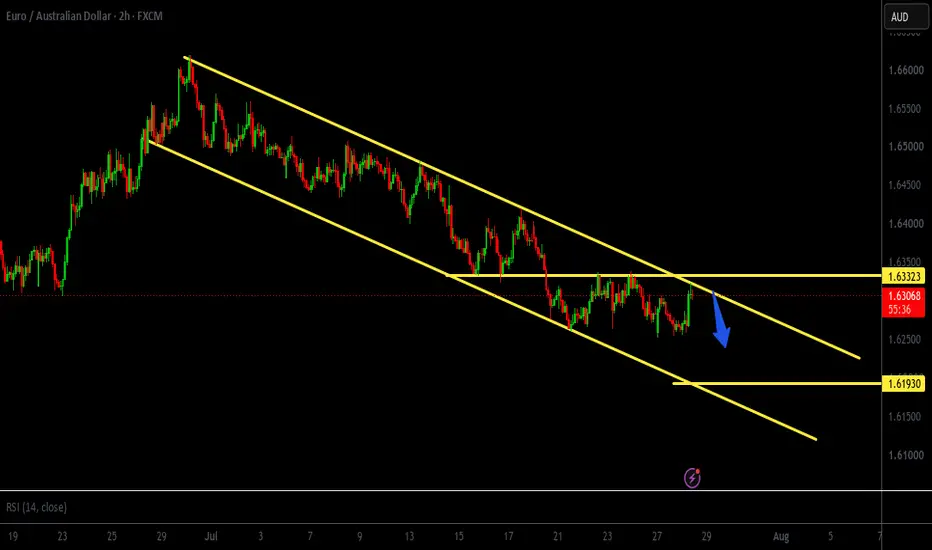
EURAUD Short IdeaEURAUD has been in a downtrend on the H2 timeframe throughout July. It has been following a channel, which it has respected well with multiple touches. The price has touched the upper trendline for the fourth time and reacted to it, with a high likelihood of respecting it again and continuing downwards.
EURAUD NEWYORK SETUPEURAUD 3H Chart Analysis – Shavyfxhub Strategy + Fundamentals
1. Chart Structure (Shavyfxhub Style)
Key Levels:
Supply Roof: Clear resistance zone around 1.6390 (red horizontal + descending trendline).
Demand Zones: Multiple green demand floors and rising trendlines lower (around 1.6320 – 1.6260 area).
Price is currently consolidating near 1.6354 – 1.6365.
Structure Notes:
Price is trading inside a descending channel after rejecting higher levels.
Several “SS” (Strength of Structure) points and circled reaction zones are marked.
The chart shows potential for a bounce from current demand, but the overall short-term structure remains under the supply roof.
Directional Bias:
Bullish scenario: Strong hold above the current demand and a break above 1.6390 opens the path higher.
Bearish scenario: Failure to hold demand and a break lower targets the next demand floors toward 1.6260 and below.
2. Central Bank Heads
ECB (Eurozone): President Christine Lagarde
RBA (Australia): Governor Michele Bullock
3. Next Monetary Policy Meetings
Central Bank,Next Meeting Date
ECB,9–10 September 2026
RBA,11 August 2026
4. Interest Rates & Differential
.Central Bank,Key Rate,Level
ECB,Deposit Rate,2.25%
RBA,Cash Rate,4.35%
Interest Rate Differential: Australia is higher by approximately 2.10%.
This continues to favour the Australian Dollar (positive carry for long AUD / short EUR).
5. 10-Year Bond Yields
Market,Approx. 10Y Yield
Eurozone (EU10Y),~3.57%
Australia (AU10Y),~4.94%
Bond Yield Differential: Australia is higher by roughly 1.35% – 1.40%.
Summary:
Technically, EURAUD is at a decision point under a clear Supply Roof at 1.6390. Fundamentally, the interest rate and bond yield differentials still strongly favour the Australian Dollar. The next major catalyst is the RBA meeting on 11 August 2026.
EURAUD Short Setup – Bearish Continuation Toward 1.56027EURAUD is presenting a planned H4 bearish setup, with price trading beneath the identified invalidation area.
The expectation is for sellers to maintain control below 1.65540 and push price through the recent lows. The position will be managed using two partial-profit targets before leaving a final portion open for the extended objective shown on the chart.
Trade Plan
Direction: Short
Entry: 1.64017
Stop Loss: 1.65540
TP1: 1.62494 — 1R
TP2: 1.60971 — 2R
Final Target: 1.56027 — approximately 5.25R
At TP1, partial profit can be secured and risk reduced. A second portion may be closed at TP2, while the remaining position is allowed to run toward the final target.
The bearish idea becomes invalid if price decisively breaks and closes above 1.65540.
This is a structured trade plan rather than a prediction. Confirmation and disciplined risk management remain essential.
EURAUD - Looking To Buy PullbacksH1 - Strong bullish move.
Currently it looks like a pullback is happening.
Until the two strong support zones hold I expect the price to move higher further after pullbacks.
If you enjoy this idea, don’t forget to LIKE 👍, FOLLOW ✅, SHARE 🙌, and COMMENT ✍! Drop your thoughts and charts below to keep the discussion going. Your support helps keep this content free and reach more people! 🚀
--------------------------------------------------------------------------------------------------------
EURAUD WEEKLY INSIGHT EURAUD LOGICAL TRADING INSIGHT TO HELP DIRECTIONAL BIAS.
1. Heads of the Central Banks
European Central Bank (ECB): President Christine Lagarde
Reserve Bank of Australia (RBA): Governor Michele Bullock
2. Current Interest Rates
Central Bank,Key Rate,Level
ECB,Deposit Facility Rate,2.25%
RBA,Cash Rate Target,4.35%
Interest Rate Differential:
Australia’s rate is approximately 2.10% higher than the Eurozone’s.
This gives a clear interest rate advantage to the Australian Dollar.
3. 10-Year Bond Yields
Market,10-Year Yield (approx.),Notes
Eurozone (EU10Y),3.52% – 3.59%,Recent range
Australia (AU10Y),4.93% – 4.99%,Recent range
Bond Yield Differential:
Australian 10-year yields are roughly 1.35% – 1.45% higher than Eurozone 10-year yields.
4. Carry Trade Implications
The interest rate and bond yield differentials both favour the Australian Dollar.
Traditional carry trade would involve buying AUD and selling EUR (i.e., short EURAUD).
Higher Australian yields provide a positive carry for holding AUD-funded positions against the Euro.
However, carry trades are sensitive to risk sentiment and currency volatility. If risk aversion rises or the Euro strengthens on other factors, the carry advantage can be offset by adverse exchange rate moves.
EURAUD Weekly Chart Analysis – Shavyfxhub Strategy
Market Structure Overview
This is a long-term weekly chart showing clear market structure using Shavyfxhub principles (Demand Floor, Supply Roof, Strength of Structure, and trendlines).
Key Observations:
Major Supply Roof is clearly marked around 1.8432 (Weekly Line Chart Close Supply Roof). Price has tested this zone multiple times and is currently rejecting from it.
There is a strong horizontal Supply Roof near 1.7097.
A Descending Trendline (DTL) is acting as dynamic resistance from the recent highs.
Multiple SS (Strength of Structure) points are marked, showing previous important reaction zones.
Demand Floor is visible at the lower green zones (around 1.53 – 1.54 and the rising green trendline).
Current Structure
Price is trading between the major Supply Roof (1.8432) and the rising Demand Floor.
After testing the upper Supply Roof, price has been making lower highs, forming a descending structure.
The chart shows potential for further downside if the current descending trendline and 1.7097 level continue to act as resistance.
Bias (Shavyfxhub Style)
Short-to-medium term: Bearish / Corrective while price remains below the 1.7097 – 1.8432 supply zones.
Long-term: The bigger structure still has a rising Demand Floor, so a deep correction toward the lower green demand zones remains possible before any major bullish reversal.
Type,Level,Notes
Major Supply Roof,1.8432,Strong weekly resistance
Secondary Supply,1.7097,Key horizontal resistance
Descending TL,Dynamic,Currently acting as resistance
Demand Floor,~1.53 – 1.54,Major long-term support
Summary:
EURAUD is rejecting from a major weekly Supply Roof. As long as price stays below 1.7097 and the descending trendline, the structure favors further downside toward the Demand Floor.
#EURAUD
EURAUD: Bearish Drop to 1.6227?FX:EURAUD is eyeing a bearish reversal on the 4-hour chart , with price testing the upper boundary of the ascending channel after recent highs, converging with a potential entry zone that could trigger downside momentum if sellers defend amid volatility. This setup suggests a pullback opportunity within the channel, targeting lower support levels with approximately 1:4 risk-reward .🔥
Entry between 1.6413–1.6433 (entry from current price with proper risk management is recommended). Target at 1.6227 . Set a stop loss at a daily close above 1.6485 , yielding a risk-reward ratio of approximately 1:4 . Monitor for confirmation via a bearish candle close below entry with rising volume, leveraging the pair's weakness near resistance.🌟
Fundamentally , EURAUD is trading around 1.638 in July 17, 2026. One of the most important releases for the Euro today is the Eurozone CPI Flash Estimate (July), where a softer-than-expected inflation reading would increase ECB rate cut expectations and weigh on the Euro, supporting bearish pressure on the pair. 💡
📝 Trade Setup
🎯 Entry (Short):
1.6413 – 1.6433
(Entry from current price is valid with proper risk & position sizing.)
🎯 Target:
• 1.6227
❌ Stop Loss:
• Daily close above 1.6485
⚖️ Risk-to-Reward:
• ~ 1:4
💡 Does EURAUD reject the 1.6413–1.6433 resistance zone and decline toward 1.6227, or will buyers break above the channel and extend the rally? 👇
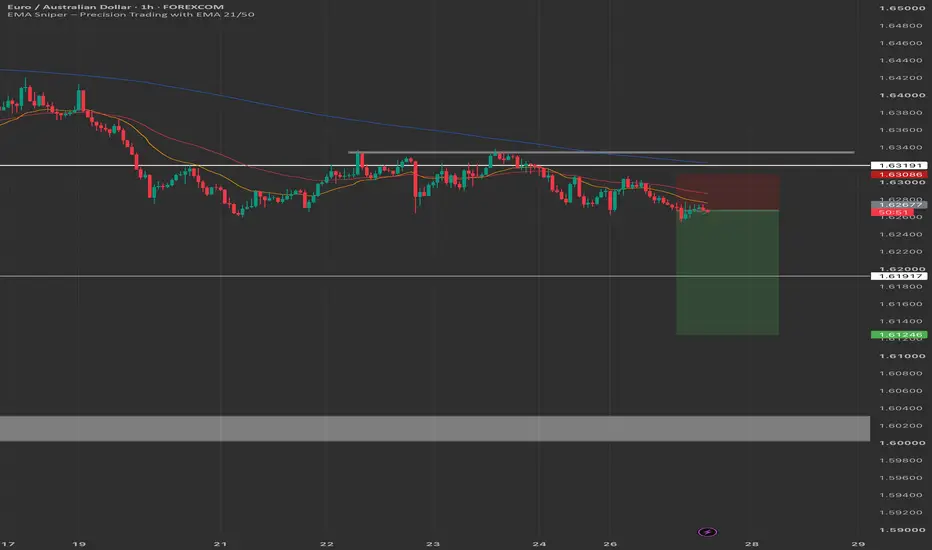
EUR-AUD Free Signal! Sell!
Hello, Traders!
EURAUD is rejecting the horizontal supply area after a liquidity sweep, confirming bearish order flow. Expect sellers to defend this zone and extend the decline. Time Frame: 6H.
-----------------
Stop Loss: 1.6338
Take Profit: 1.6230
Entry: 1.6281
Time Frame: 6H
-----------------
Sell!
Comment and subscribe to help us grow!
Check out other forecasts below too!
Bearish reversal off strong resistance?EUR/AUD is rising to the resistance level, which is an overlap resistance and could reverse from this level to our take-profit.
Entry: 1.6320
Why we like it:
There is an overlap resistance level.
Stop loss: 1.63985
Why we like it:
There is an overlap resistance level.
Take profit: 1.61929
Why we like it:
There is a swing low support.
Enjoying your TradingView experience? Review us!
Please be advised that the information presented on TradingView is provided to Vantage (‘Vantage Global Limited’, ‘we’) by a third-party provider (‘Everest Fortune Group’). Please be reminded that you are solely responsible for the trading decisions on your account. There is a very high degree of risk involved in trading. Any information and/or content is intended entirely for research, educational and informational purposes only and does not constitute investment or consultation advice or investment strategy. The information is not tailored to the investment needs of any specific person and therefore does not involve a consideration of any of the investment objectives, financial situation or needs of any viewer that may receive it. Kindly also note that past performance is not a reliable indicator of future results. Actual results may differ materially from those anticipated in forward-looking or past performance statements. We assume no liability as to the accuracy or completeness of any of the information and/or content provided herein and the Company cannot be held responsible for any omission, mistake nor for any loss or damage including without limitation to any loss of profit which may arise from reliance on any information supplied by Everest Fortune Group.
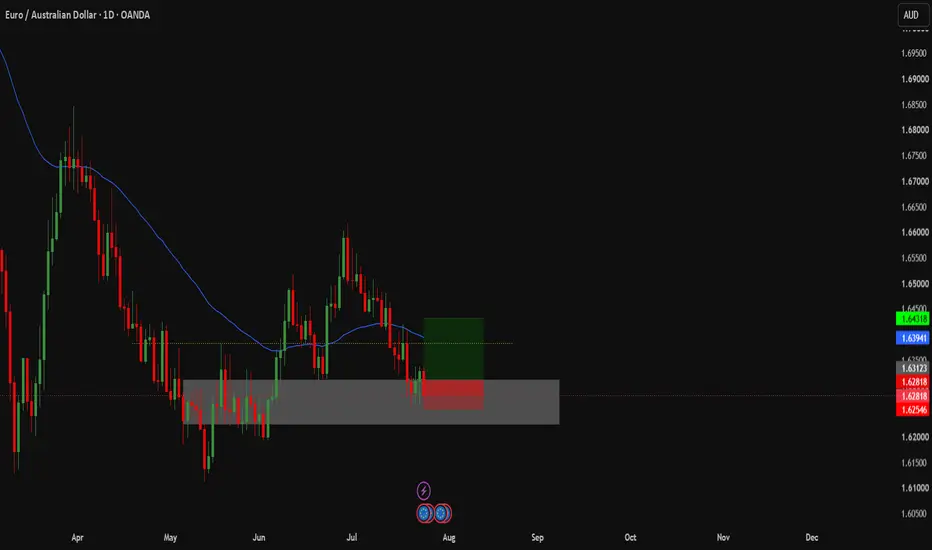
EURAUD - BULLISH BIASEURAUD - BULLISH BIAS
~ WEEKLY - Price has had a strong bearish momentum, however, we can see that it has recently slowed down but still on a downtrend.
~ DAILY - We wait for price to pull back to the AOI which is a strong fib level, psychological level and most importantly, multiple rejections making it a strong resistance level.
This is a high risk trade as we are looking to take a counter trend trade. Market is bullish across all 3 timeframes - Weekly, Daily and 4HR.
As price moves down to my level, I will wait for my confirmations across multiple timeframes and see how price reacts.
#forextrading #tradingeducation #swingtrader #tradingstrategy #mjswings
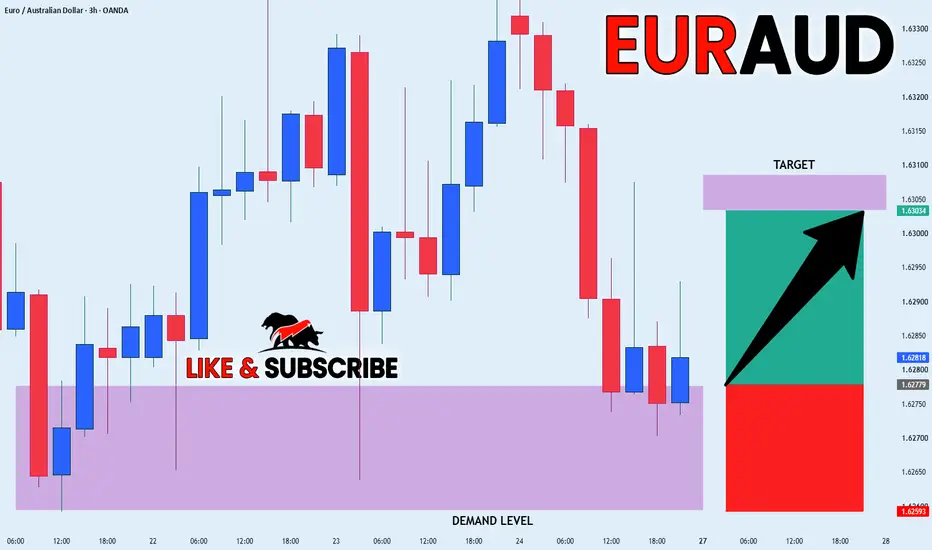
EURAUD RISKY FREE SIGNAL|LONG|
✅EURAUD expecting a liquidity sweep into the ICT demand zone before buyers reclaim control. Bullish displacement from discount pricing could extend the recovery toward the premium target.
—————————
Entry: 1.6277
Stop Loss: 1.6259
Take Profit: 1.6303
Time Frame: 3H
—————————
LONG🚀
✅Like and subscribe to never miss a new idea!✅