Bearish reversal in play?EUR/CAD has rejected the pivot, which has been identified as an overlap resistance that aligns with the 61.8% Fibonacci retracement and could potentially drop toward the 1st support.
Pivot: 1.61595
1st Support: 1.60900
1st Resistance: 1.62067
Disclaimer:
The opinions given above constitute general market commentary and do not constitute the opinion or advice of IC Markets or any form of personal or investment advice.
Any opinions, news, research, analyses, prices, other information, or links to third-party sites contained on this website are provided on an "as-is" basis, are intended to be informative only, and are not advice, a recommendation, research, a record of our trading prices, an offer of, or solicitation for, a transaction in any financial instrument and thus should not be treated as such. The information provided does not involve any specific investment objectives, financial situation, or needs of any specific person who may receive it. Please be aware that past performance is not a reliable indicator of future performance and/or results. Past performance or forward-looking scenarios based upon the reasonable beliefs of the third-party provider are not a guarantee of future performance. Actual results may differ materially from those anticipated in forward-looking or past performance statements. IC Markets makes no representation or warranty and assumes no liability as to the accuracy or completeness of the information provided, nor any loss arising from any investment based on a recommendation, forecast, or any information supplied by any third party.
Euro / Canadian Dollar
No trades
No trades
In-depth trading ideas
#EURCAD: 800+ PIPS Selling Setup, Wait For Further Confirmation🔺EURCAD has changed its character and is now extremely bearish. We are awaiting a price retest. Once the price has retested the area the entry will become clearer. There is a swing entry zone where entering can yield a potential gain of 800 pips.
🔺There are two target zones for take profit. The stop loss can be placed above the selling zone. Please use appropriate risk management when trading forex and other financial instruments.
EURCAD TRADE IDEA BASED ON FUNDAMENTAL DATA1- Euro right now is fundamentally bullish than Canadian Dollar.
2- European Central Bank in their last meeting had a hawkish tone as well and Canadian Central Bank had a dovish tone in their last meeting because Canada is more focused on their economy right now.
3- Right Now we are waiting for this Friday's Euro CPI data and if that data came out higher than expected EURCAD can move up to its daily 61 Fibonacci Level and the next major data which can damage this trade will be on 17 August 2026 which is Canadian CPI.
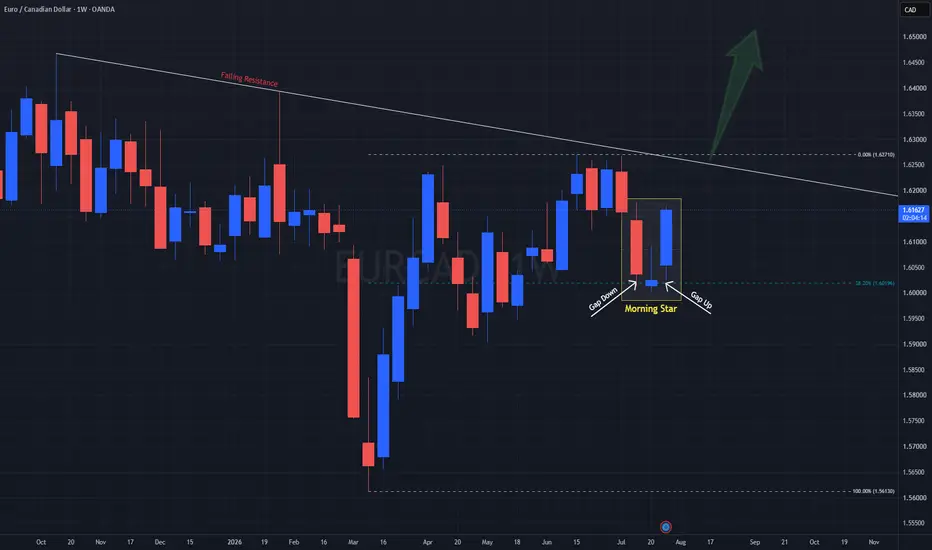
Morning Star Rises On EURCADHere on the Weekly for OANDA:EURCAD , price has formed a strong Bullish reversal pattern called a Morning Star at the 38.2% Retracement Level! This pattern consist of:
1) Large Bearish Candle
2) Small Bullish -or- Doji Candle
3) Large Bullish Candle
There are a couple rules this pattern must follow as well, which are:
- There MUST be a Gap Down from the Close of the First Candle to the Close of the Second Candle.
&
- There MUST be a Gap Up from the Close of the Second Candle to the Open of the Third Candle.
We can see both these rules have been met and the Third Candlestick being a Large Bullish Candle is the confirmation that price is reversing!
As the week comes to an end, we can see price is looking to Close close to the High of the First Candlestick in the pattern so we should expect price to remain Bullish into the coming weeks.
The next area of Resistance will come at the Falling Resistance shown as the Trendline above and if price is able to make a Breakout of that, we could be looking at OANDA:EURCAD possibly going higher!
Fundamentally, both the ECB and BOC HELD Interest Rates this past month, but current Inflation readings could change this story going forward with EUR Inflation having been holding steady while CAD Inflation saw some decline creating an imbalance:
EUR-
CPI (y/y) = Actual - 2.8%/ Forecast - 2.8%/ Previous - 2.8%
Core CPI (y/y) = Actual - 2.4%/ Forecast - 2.4%/ Previous -2.4%
CAD-
Median CPI (y/y) = Actual - 1.9%/ Forecast - 2.1%/ Previous - 2.1%
Trimmed CPI (y/y) = Actual - 1.8%/ Forecast - 2%/ Previous - 2%
Common CPI (y/y) = Actual - 2.6%/ Forecast - 2.5%/ Previous - 2.7%
Today, Friday July 31st, CPI Flash y/y and Core CPI Flash y/y for EUR released and showed a .1% increase in Inflation with CAD having a GDP m/m print of a decrease by .3% which helped influence the current rise in price on PURPLETRADING:EURCAD.
This could lead the ECB to look for more Holds or Hikes with BOC potentially looking for Cuts and this scenario would Strengthen the EUR and Weaken the CAD!!
Heading towards overlap resistance?EUR/CAD is rising toward the resistance level, which is an overlap resistance that aligns with the 78.65 Fibonacci retracement and could reverse from this level to our take profit.
Entry: 1.62055
Why we like it:
There is an overlap resistance level that aligns with the 78.6% Fibonacci retracement.
Stop loss: 1.62689
Why we like it:
There is a multi-swing high resistance level.
Take profit: 1.61317
Why we like it:
There is an overlap support level.
Enjoying your TradingView experience? Review us!
Please be advised that the information presented on TradingView is provided to Vantage (‘Vantage Global Limited’, ‘we’) by a third-party provider (‘Everest Fortune Group’). Please be reminded that you are solely responsible for the trading decisions on your account. There is a very high degree of risk involved in trading. Any information and/or content is intended entirely for research, educational and informational purposes only and does not constitute investment or consultation advice or investment strategy. The information is not tailored to the investment needs of any specific person and therefore does not involve a consideration of any of the investment objectives, financial situation or needs of any viewer that may receive it. Kindly also note that past performance is not a reliable indicator of future results. Actual results may differ materially from those anticipated in forward-looking or past performance statements. We assume no liability as to the accuracy or completeness of any of the information and/or content provided herein and the Company cannot be held responsible for any omission, mistake nor for any loss or damage including without limitation to any loss of profit which may arise from reliance on any information supplied by Everest Fortune Group.
EURCAD Range Trap: 77-Retest Ceiling in Play, Stacked Liquidity 🚨
▪️ EURCAD H2 SNAPSHOT — EXECUTIVE SUMMARY
▪️ the EuroCAD is grinding near 1.00000, testing the top of a heavy demand cluster after leaking lower. Buyers are being asked to defend.
▪️ Primary outlook is bullish — the response at — is the tell. Strong overhead liquidity
will get targets by the bulls. final target is 6140.
▪️ Key resistance zone: 1.59640, capped 22 times. Above that sits 1.60040, then 1.60290.
▪️ Major defense line: 1.60980 — a very strong level at 77 retests, the backbone of the demand stack.
▪️ Primary downside targets: the demand stack below, where liquidity is heavily layered.
▪️ Major liquidity magnet below: 1.60040–1.59640 — anchored by strong demand; expect a reaction on the first tag.
▪️ Bullish scenario: A daily close back above 1.59640 flips the tape and targets 1.60040, then 1.61970.
▪️ KEY LEVELS
RESISTANCEs
▪️ 1.61970 — ★ 4.9 Weak · 72 retests
▪️ 1.61650 — ★ 5.6 Weak · 70 retests
▪️ 1.61420 — ★★ 6.3 Moderate · 92 retests
▪️ 1.60980 — ★★★★ 8.4 Very Strong · 77 retests
SUPPORTs
▪️ 1.60290 — ★★★ 7.5 Strong · 16 retests
▪️ 1.60040 — ★★★★ 8.1 Very Strong · 11 retests
▪️ 1.59640 — ★ 5.0 Weak · 22 retests
▪️ ProjectSyndicate Levels Desk — Overview of key S/R zones for FX, indices, metals, NVDA, NQ, ES & GC traders every week. Subscribe to stay up to date with the latest levels.
EURCAD Will Buy From SupportHello Traders
In This Chart EURCAD HOURLY Forex Forecast By FOREX PLANET
today EURCAD analysis 👆
🟢This Chart includes_ (EURCAD market update)
🟢What is The Next Opportunity on EURCAD Market
🟢how to Enter to the Valid Entry With Assurance Profit
This CHART is For Trader's that Want to Improve Their Technical Analysis Skills and Their Trading By Understanding How To Analyze The Market Using Multiple Timeframes and Understanding The Bigger Picture on the Charts
EURCAD Is Very Bearish! Sell!
Here is our detailed technical review for EURCAD.
Time Frame: 4h
Current Trend: Bearish
Sentiment: Overbought (based on 7-period RSI)
Forecast: Bearish
The market is trading around a solid horizontal structure 1.619.
The above observations make me that the market will inevitably achieve 1.612 level.
P.S
Please, note that an oversold/overbought condition can last for a long time, and therefore being oversold/overbought doesn't mean a price rally will come soon, or at all.
Like and subscribe and comment my ideas if you enjoy them!
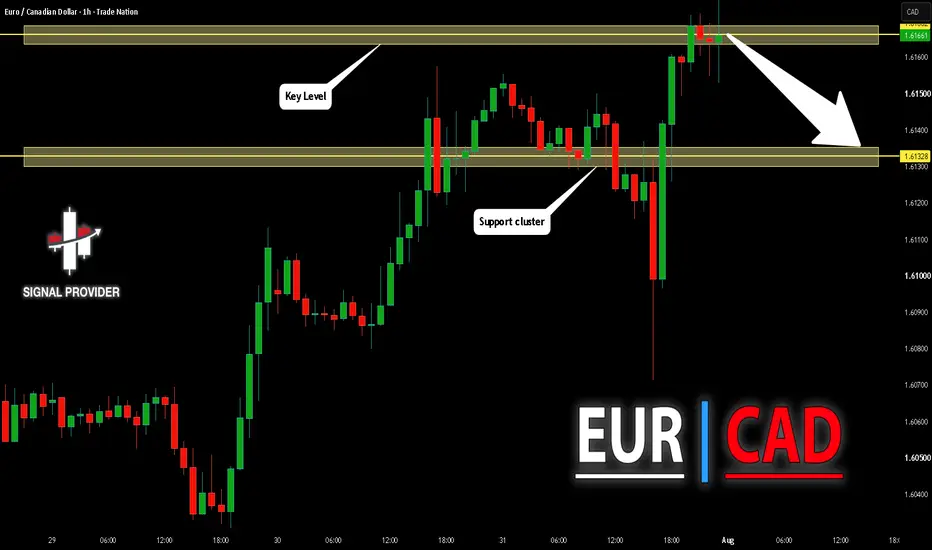
EURCAD Will Fall! Short!
Please, check our technical outlook for EURCAD.
Time Frame: 1h
Current Trend: Bearish
Sentiment: Overbought (based on 7-period RSI)
Forecast: Bearish
The price is testing a key resistance 1.616.
Taking into consideration the current market trend & overbought RSI, chances will be high to see a bearish movement to the downside at least to 1.613 level.
P.S
Overbought describes a period of time where there has been a significant and consistent upward move in price over a period of time without much pullback.
Like and subscribe and comment my ideas if you enjoy them!
EURCAD downtrend and short bias with strong weekly supplyEURCAD weekly supply has been in control for weeks and is now dropping an printing new weekly and daily lows. There are new opportunities being created in the smaller timeframes to go short in this Forex major pair. You can use intraday and short-term forex strategies to go short on this pair.
EURCAD H1 | Bearish Reaction Off Pullback ResistanceMomentum: Bearish
Price is currently below the ichimoku cloud.
Sell entry: 1.60559
- Pullback resistance
- 71% Fib retracement
- Fair value gap
Stop Loss: 1.60798
- Swing high resistance
Take Profit: 1.60238
- Swing low support
High Risk Investment Warning
Stratos Markets Limited (fxcm.com/uk), Stratos Europe Ltd (fxcm.com/eu):
CFDs are complex instruments and come with a high risk of losing money rapidly due to leverage. 65% of retail investor accounts lose money when trading CFDs with this provider. You should consider whether you understand how CFDs work and whether you can afford to take the high risk of losing your money.
Stratos Global LLC (fxcm.com/en): Losses can exceed deposits.
Please be advised that the information presented on TradingView is provided to FXCM (‘Company’, ‘we’) by a third-party provider (‘TFA Global Pte Ltd’). Please be reminded that you are solely responsible for the trading decisions on your account. Any information and/or content is intended entirely for research, educational and informational purposes only and does not constitute investment or consultation advice or investment strategy. The information is not tailored to the investment needs of any specific person and therefore does not involve a consideration of any of the investment objectives, financial situation or needs of any viewer that may receive it. Past performance is not a reliable indicator of future results. Actual results may differ materially from those anticipated in forward-looking or past performance statements. We assume no liability as to the accuracy or completeness of any of the information and/or content provided herein and the Company cannot be held responsible for any omission, mistake nor for any loss or damage including without limitation to any loss of profit which may arise from reliance on any information supplied by TFA Global Pte Ltd.
Stratos Trading Pty. Limited (fxcm.com/au):
Trading FX/CFDs carries significant risks. FXCM AU (AFSL 309763), please read the Financial Services Guide, Product Disclosure Statement, Target Market Determination and Terms of Business at fxcm.com/au
EUR/CAD – Buy-Side Liquidity at the 0.618 Fibonacci Level **EUR/CAD – Buy-Side Liquidity at the 0.618 Fibonacci Level 📉**
EUR/CAD remains in a **bearish market structure** and is currently consolidating.
An interesting area to watch is the **0.618 Fibonacci retracement**, where **buy-side liquidity** is resting. An optimal scenario would be for price to sweep that liquidity first before showing a bearish reaction.
If the market rejects the **0.618 Fibonacci level** with bearish price action, a continuation of the downtrend becomes a realistic scenario.
As always, I don't predict the market—I prepare for scenarios and wait for confirmation through price action before considering an entry.
#Trading #Forex #EURCAD #ICT #PriceAction #Liquidity #BuySide #Fibonacci #SmartMoney #MarketStructure #DayTrading
EUR/CAD Analysis Can Buyers Defend This Support?EUR/CAD sold off aggressively after the latest move favored the Canadian dollar, driving price straight into a key support zone around 1.6010-1.6012.
The good news for buyers is that this area has already attracted buying interest. If support continues to hold, I expect a relief rally back toward the 1.6075-1.6080 resistance zone, which is my current TP area.
Key resistance ahead?EUR/CAD is rising to the resistance level, which acts as an overlap resistance and could reverse from this level to our take profit.
Entry: 1.60565
Why we like it:
There is an overlap resistance level.
Stop loss: 1.6114
Why we like it:
There is an overlap resistance level.
Take profit: 1.6013
Why we like it:
There is an overlap support level.
Enjoying your TradingView experience? Review us!
Please be advised that the information presented on TradingView is provided to Vantage (‘Vantage Global Limited’, ‘we’) by a third-party provider (‘Everest Fortune Group’). Please be reminded that you are solely responsible for the trading decisions on your account. There is a very high degree of risk involved in trading. Any information and/or content is intended entirely for research, educational and informational purposes only and does not constitute investment or consultation advice or investment strategy. The information is not tailored to the investment needs of any specific person and therefore does not involve a consideration of any of the investment objectives, financial situation or needs of any viewer that may receive it. Kindly also note that past performance is not a reliable indicator of future results. Actual results may differ materially from those anticipated in forward-looking or past performance statements. We assume no liability as to the accuracy or completeness of any of the information and/or content provided herein and the Company cannot be held responsible for any omission, mistake nor for any loss or damage including without limitation to any loss of profit which may arise from reliance on any information supplied by Everest Fortune Group.
Heading towards 50% Fib resistance?EUR/CAD is rising to the resistance level, which is a pullback resistance that aligns with the 50% Fibonacci retracement and could reverse from this level to our take profit.
Entry: 1.61342
Why we like it:
There is a pullback resistance level that aligns with the 50% Fibonacci retracement.
Stop loss: 1.62045
Why we like it:
There is an overlap resistance level that aligns with the 78.6% Fibonacci retracement.
Take profit: 1.60543
Why we like it:
There is a pullback support level.
Enjoying your TradingView experience? Review us!
Please be advised that the information presented on TradingView is provided to Vantage (‘Vantage Global Limited’, ‘we’) by a third-party provider (‘Everest Fortune Group’). Please be reminded that you are solely responsible for the trading decisions on your account. There is a very high degree of risk involved in trading. Any information and/or content is intended entirely for research, educational and informational purposes only and does not constitute investment or consultation advice or investment strategy. The information is not tailored to the investment needs of any specific person and therefore does not involve a consideration of any of the investment objectives, financial situation or needs of any viewer that may receive it. Kindly also note that past performance is not a reliable indicator of future results. Actual results may differ materially from those anticipated in forward-looking or past performance statements. We assume no liability as to the accuracy or completeness of any of the information and/or content provided herein and the Company cannot be held responsible for any omission, mistake nor for any loss or damage including without limitation to any loss of profit which may arise from reliance on any information supplied by Everest Fortune Group.
EURCAD Price Update – Clean & Clear ExplanationEUR/CAD has recovered strongly from recent lows and is now trading inside a major resistance and decision zone. Buyers remain in control after forming a series of higher highs and higher lows, showing that bullish momentum is still present.
A confirmed 4-hour candle close above the current resistance zone would signal that buyers have absorbed the selling pressure, opening the door for a continuation toward the 1.6250–1.6300 region. As long as price remains above the ascending trendline and the nearby support zone, the overall market structure continues to favor the bulls.
On the other hand, if EUR/CAD fails to secure a strong close above resistance and forms bearish rejection candles, profit-taking and fresh selling could push the pair back toward the 1.6150 support area. A break below that level may extend the correction toward 1.6060, where buyers could attempt another recovery.
Your support means a lot! If you found this analysis useful, leave a Like and tell me your thoughts in the comments. Best of luck with your trading journey! 🚀
EUR-CAD Will Go UP! Buy!
Hello,Traders!
EURCAD rebounding from the horizontal demand area after sweeping liquidity, with buyers defending discount and momentum favoring continuation toward the next supply zone. Time Frame 6H.
Buy!
Comment and subscribe to help us grow!
Check out other forecasts below too!
EUR/CAD – Bullish Breakout & Trend Reversal SetupEUR/CAD – Bullish Breakout & Trend Reversal Setup
🔍 Market Overview
EUR/CAD is showing early signs of a bullish reversal after spending several weeks inside a clear downtrend. Price had been respecting the descending trendline, creating lower highs and maintaining strong selling pressure. However, buyers have recently stepped in, pushing price above the previous bearish structure and breaking the downtrend resistance.
The breakout from the descending trendline suggests that bearish momentum is fading and market structure is beginning to shift. The key area to watch now is the breakout zone, where previous resistance could potentially turn into new support.
📈 Bullish Scenario
A successful retest of the breakout zone would confirm that buyers are defending the new support area.
The trendline breakout indicates a possible transition from bearish structure to bullish momentum.
If buyers maintain control, EUR/CAD could continue its recovery toward the next resistance levels.
🎯 Target 1: 1.62070
🎯 Target 2: 1.62620
📉 Bearish Scenario
If price fails to hold above the breakout area and moves back below the neckline zone, the bullish setup could lose strength.
A rejection from the current resistance area may signal that the breakout was temporary and sellers could attempt to regain control.
📊 Market Structure Insight
The recent breakout marks an important change in EUR/CAD’s structure. After a prolonged downtrend, buyers have managed to break above a key resistance area and create the possibility of a new bullish phase. However, holding above the breakout zone and forming higher lows will be essential to confirm that this is a genuine trend reversal rather than just a short-term recovery.