E U R J P Y : (€187 000 Price Drop)Eurjpy has been one of the stronger yen crosses recently. Today the pair is trading around the (€187 000) area after breaking above a key (Resistance Zone) near (€186 500–€186 605) earlier this week, Major resistance / all-time high area (€187 950)
Eurjpy declined today as traders took profits near record-high levels and the Japanese yen strengthened. After an extended bullish run, buyers became cautious around resistance, leading to selling pressure. Increased focus on Bank of Japan policy expectations supported the yen, helping drive a corrective move lower.
Despite today's drop, the broader trend remains (Bullish) unless key support levels are broken.
If Eurjpy reclaims and holds above the (€184 000–€185 000) region, buyers could attempt a recovery back toward previous resistance zones.The broader trend before the intervention was still bullish, but we shall wait and see what happens and stay ready to (Capitalize) on any opportunities they may arise but remember to trade (Cautiously) and follow all trading plan rules accordingly.
⬇️ Previous Trade Below ⬇️
Euro / Japanese Yen
No trades
No trades
In-depth trading ideas
Bullish continuation setup?EUR/JPY is falling toward the pivot, which is a pullback support that aligns with the 61.8% Fibonacci retracement and could bounce towards the 1st resistance.
Pvivot: 186.64
1st Support: 186.15
1st Resistance: 187.41
Disclaimer:
The opinions given above constitute general market commentary and do not constitute the opinion or advice of IC Markets or any form of personal or investment advice.
Any opinions, news, research, analyses, prices, other information, or links to third-party sites contained on this website are provided on an "as-is" basis, are intended to be informative only, and are not advice, a recommendation, research, a record of our trading prices, an offer of, or solicitation for, a transaction in any financial instrument and thus should not be treated as such. The information provided does not involve any specific investment objectives, financial situation, or needs of any specific person who may receive it. Please be aware that past performance is not a reliable indicator of future performance and/or results. Past performance or forward-looking scenarios based upon the reasonable beliefs of the third-party provider are not a guarantee of future performance. Actual results may differ materially from those anticipated in forward-looking or past performance statements. IC Markets makes no representation or warranty and assumes no liability as to the accuracy or completeness of the information provided, nor any loss arising from any investment based on a recommendation, forecast, or any information supplied by any third party.
EURJPY | Liquidity Sweep Signals Potential Bearish ReversalEURJPY is currently approaching a significant technical inflection point after sweeping buy-side liquidity above the June high and retesting a historical resistance zone that has remained influential since January. Price is also developing a potential Head and Shoulders reversal pattern beneath this resistance, although the formation remains unconfirmed until further bearish price action develops. I will therefore be monitoring for a clear rejection from the highlighted resistance area before considering short exposure, rather than anticipating an immediate reversal. A sustained daily close above the April 17th high would invalidate the current bearish thesis, while downside objectives remain the July low, June low, and May low. Additional technical confluence may also develop should price retrace towards the 200-period EMA, which could align with the July low and provide an area of dynamic market reaction. Although the TDI is beginning to enter overbought territory, no bearish divergence has yet formed, reinforcing the need for confirmation before entering a position.
From a fundamental perspective, the broader macro backdrop could complement this technical outlook if expectations of continued Bank of Japan policy normalisation support the Japanese yen. Any increase in global risk aversion may also encourage the unwinding of yen-funded carry trades, historically providing additional demand for JPY and increasing downside pressure on EURJPY. Conversely, softer Eurozone economic data or a more accommodative stance from the European Central Bank could weaken the euro, further aligning with the bearish technical structure. Market participants should continue to monitor upcoming BoJ and ECB policy decisions, inflation data, and broader risk sentiment, as these developments may either reinforce or challenge the current macro narrative. While price action will ultimately determine whether this scenario develops, the technical and fundamental backdrop currently suggests that a confirmed rejection from resistance could present a compelling bearish continuation opportunity.
EURJPY - High-Confluence Resistance AheadEURJPY is approaching a high-confluence resistance area, where multiple technical factors are aligning to create a potential overbought zone. 📉
Price is now testing the intersection of:
The red supply zone.
The upper blue trendline, acting as dynamic resistance.
📌 As long as this confluence continues to hold, we will be looking for trend-following short setups, expecting sellers to defend the area and the broader correction to resume.
As always, rather than selling blindly into resistance, we will wait for bearish confirmation before considering any short positions.
Will sellers defend this high-confluence resistance once again, or will buyers finally force a breakout? 🤔
⚠️ Disclaimer: This is not financial advice. Always do your own research and manage risk properly.
📚 Stick to your trading plan regarding entries, risk, and management.
Good luck! 🍀
All Strategies Are Good; If Managed Properly!
~Richard Nasr
EURJPY Breaks Rising Channel Support EURJPY Breaks Rising Channel Support
EUR/JPY is trading in a very risky area after losing support from the rising channel that guided the bullish move over the past two weeks.
The pair attempted several times to hold above the lower trendline, but sellers have started to gain control.
If this breakdown holds strong, it could trigger a deeper correction after the strong rally seen earlier this month.
For now, the main question is whether the Bank of Japan will start Forex intervention. If they do not take further action, these setups could easily be reversed again.
Targets:
🎯 185.55
🎯 184.90
You can find more details on the chart.
Thank you and good luck! 🍀
⚠️PS: Do your own analysis and use your own strategy to join the trade.
❤️ If this analysis helps your trading day, please support it with a like or comment ❤️
EUR/JPY Bearish Breakdown Ahead
📉 EUR/JPY BEARISH BREAKDOWN
Resistance Rejection – Target 185.75
Description:
EUR/JPY is currently trading beneath a strong descending trendline while repeatedly facing rejection from a key resistance/supply zone around 186.25–186.35. This price action suggests that buyers are losing momentum and sellers are beginning to regain control.
The recent consolidation below resistance indicates a potential bearish continuation. A confirmed rejection from the highlighted zone could trigger a move toward the first support around 186.00, followed by the main target at 185.75.
📌 Key Levels:
🔴 Resistance Zone: 186.25 – 186.35
🎯 Target: 185.75
⚠️ Invalidation: A strong candle closing above the resistance zone may weaken the bearish outlook.
Trading Plan:
✅ Wait for bearish confirmation at the resistance zone before entering a short position.
✅ Use proper risk management and avoid chasing the move without confirmation.
✅ Partial profits can be secured at intermediate support levels while leaving the remainder to target 185.75.
📊 Trade with discipline, manage your risk, and always wait for confirmation before entering the market.
EURJPY Set To Fall! SELL!
My dear followers,
I analysed this chart on EURJPY and concluded the following:
The market is trading on 186.57 pivot level.
Bias - Bearish
Technical Indicators: Both Super Trend & Pivot HL indicate a highly probable Bearish continuation.
Target - 186.42
Safe Stop Loss - 186.65
About Used Indicators:
A super-trend indicator is plotted on either above or below the closing price to signal a buy or sell. The indicator changes color, based on whether or not you should be buying. If the super-trend indicator moves below the closing price, the indicator turns green, and it signals an entry point or points to buy.
Disclosure: I am part of Trade Nation's Influencer program and receive a monthly fee for using their TradingView charts in my analysis.
———————————
WISH YOU ALL LUCK
#EURJPY , GONNA BE RISKY ╔═══════════════════╗
🌅 LONDON OPEN RADAR
╚═══════════════════╝
🎯 Pair: #EURJPY
⚠️ Risk: SUPER HIGH
🧠 Read on Price:
Risky structure due to the news on JPY and the earthquake in Japan.
But if we have a better structure, we can treat it as a QuickScalp.
Won't go in on it if it turns too risky!
🎯What Needs To Happen
➊ Price reaches the POI
➋ Lower timeframe confirms
➌ Execution follows
#Ash_TheTrader #Forex #Futures #PriceAction
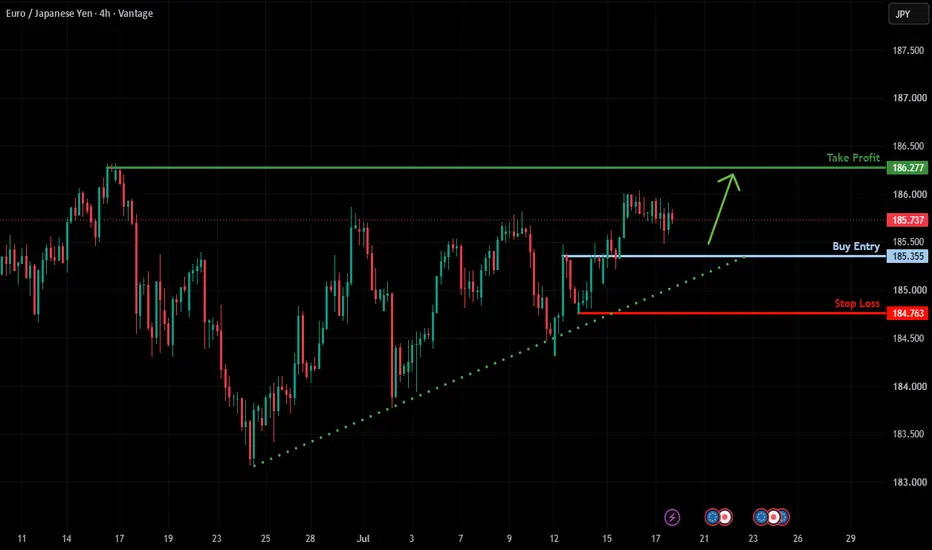
Bullish bounce off pullback support?EUR/JPY is falling to the support level, which is a pullback support and could bounce from this level to our take profit.
Entry: 185.35
Why we like it:
There is a pullback support level.
Stop loss: 184.76
Why we like it:
There is a pullback support level.
Take profit: 186.27
Why we like it:
There is a pullback resistance level.
Enjoying your TradingView experience? Review us!
Please be advised that the information presented on TradingView is provided to Vantage (‘Vantage Global Limited’, ‘we’) by a third-party provider (‘Everest Fortune Group’). Please be reminded that you are solely responsible for the trading decisions on your account. There is a very high degree of risk involved in trading. Any information and/or content is intended entirely for research, educational and informational purposes only and does not constitute investment or consultation advice or investment strategy. The information is not tailored to the investment needs of any specific person and therefore does not involve a consideration of any of the investment objectives, financial situation or needs of any viewer that may receive it. Kindly also note that past performance is not a reliable indicator of future results. Actual results may differ materially from those anticipated in forward-looking or past performance statements. We assume no liability as to the accuracy or completeness of any of the information and/or content provided herein and the Company cannot be held responsible for any omission, mistake nor for any loss or damage including without limitation to any loss of profit which may arise from reliance on any information supplied by Everest Fortune Group.
EUR/JPY 2 Day AnalysisEUR/JPY continues to respect its ascending channel, keeping the broader bullish structure intact. Price has recently broken above a key horizontal resistance level, suggesting buyers remain in control. If the breakout is sustained and former resistance holds as support, the pair could be positioned to extend its move towards the upper boundary of the rising channel.
EURJPY | Demand Holding Within Bullish StructureTimeframe: H1
Concept: Market Structure & Liquidity
EURJPY is retracing into a key H1 demand zone after a bullish expansion. Price continues to respect higher-timeframe structure, with the 186.05–186.20 area acting as a potential demand region for continuation toward premium liquidity.
Scenarios:
• Bullish continuation: Holding above 186.05 may support a move toward 186.66 buy-side liquidity.
• Bearish continuation: A decisive break below 186.05 could trigger a deeper retracement into lower liquidity.
Bias: Bullish while price remains above the H1 demand zone.
Disclaimer: This analysis is for educational and informational purposes only and does not constitute financial advice. Trading involves substantial risk, and independent analysis with proper risk management should always be applied.
EUR-JPY Will Keep Growing! Buy!
Hello, Traders!
EURJPY buyers are defending the horizontal demand area after a successful liquidity reaction. Continued bullish momentum could extend the advance toward the marked target level. Time Frame 7H.
Buy!
Comment and subscribe to help us grow!
Check out other forecasts below too!
EUR/JPY 4H: Institutional Demand & Bullish Target 187.95!EUR/JPY is showing a classic Smart Money bullish structure on the 4-Hour chart.
📊 Quick Technical Breakdown:
• Repeated Liquidity Sweeps ("X"): Price keeps sweeping internal sell-side liquidity before respecting key demand blocks.
• Key Demand Zone (Green Box): Strong institutional order block sitting around 184.68 – 184.98.
• Stop Loss Zone: Defined tight below the demand zone at 184.68.
• Take Profit Target: Looking for expansion up to structural resistance at 187.95.
🎯 Trade Plan:
• Entry Zone: 184.98 – 185.20 (Pullback Retest)
• Stop Loss: 184.68
• Take Profit: 187.95
💬 Are you bullish on EUR/JPY or waiting for a breakout higher first? Drop your thoughts below!
If this setup helps you, hit LIKE 👍 and FOLLOW for daily clean trading ideas!
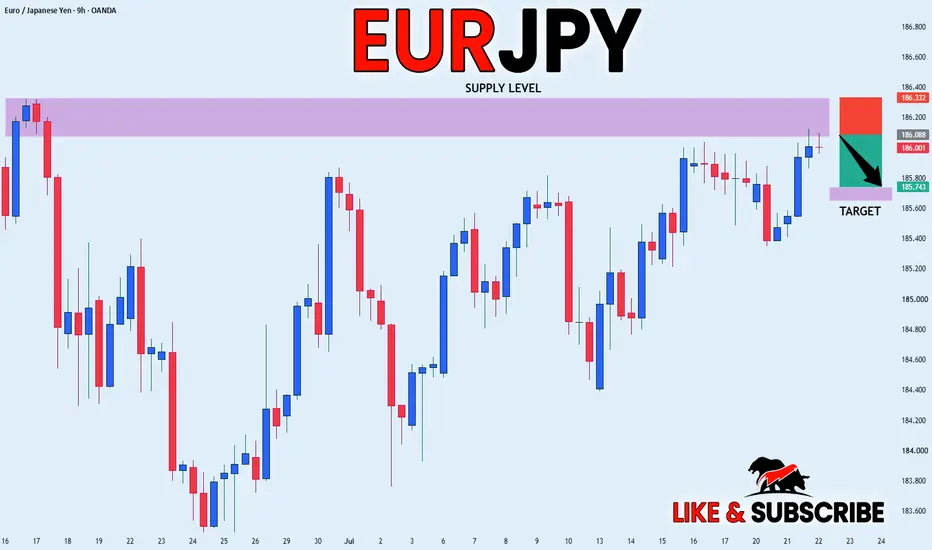
EURJPY FREE SIGNAL|SHORT|
✅EURJPY is trading into an ICT supply zone after a strong bullish leg. Expect sell-side displacement from premium pricing, targeting resting liquidity below.
—————————
Entry: 186.08
Stop Loss: 186.33
Take Profit: 185.74
Time Frame: 9H
—————————
SHORT🔥
✅Like and subscribe to never miss a new idea!✅
EURJPY: Long Trading Opportunity
EURJPY
- Classic bullish formation
- Our team expects growth
SUGGESTED TRADE:
Swing Trade
Buy EURJPY
Entry Level - 186.28
Sl - 186.22
Tp - 186.38
Our Risk - 1%
Start protection of your profits from lower levels
Disclosure: I am part of Trade Nation's Influencer program and receive a monthly fee for using their TradingView charts in my analysis.
❤️ Please, support our work with like & comment! ❤️
EUR-JPY Free Signal! Buy!
Hello, Traders!
EURJPY has broken above the horizontal supply area, confirming bullish market structure. Expect a breakout retest before continuation toward the next liquidity objective.
------------------
Stop Loss: 186.04
Take Profit: 186.75
Entry: 186.34
Time Frame: 6H
------------------
Buy!
Comment and subscribe to help us grow!
Check out other forecasts below too!