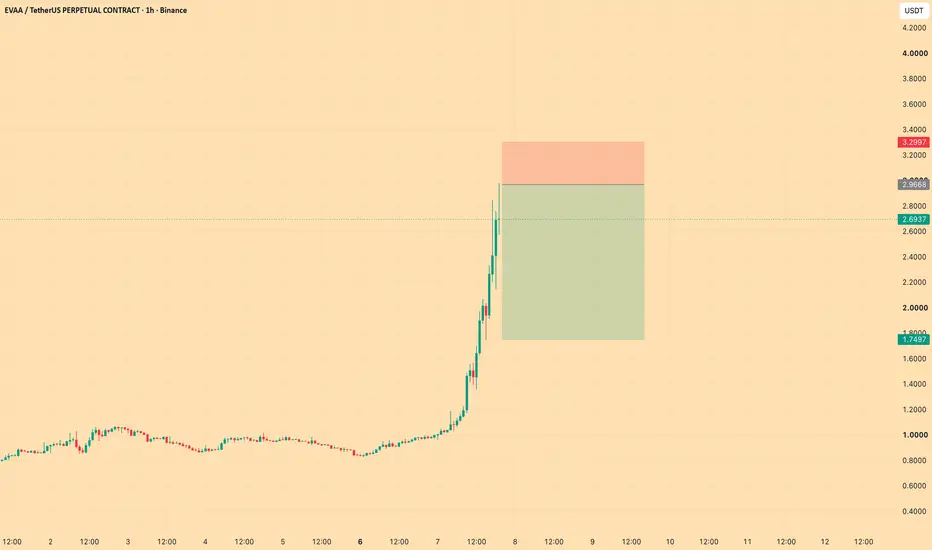
EVAAUSDT: Rejection at Resistance Keeps Bears in ControlEVAAUSDT is struggling to reclaim resistance after a weak recovery, with sellers continuing to defend the upper range. As long as 0.8390 remains unbroken, the short-term trend favors further downside.
A rejection from the current zone could push the price toward 0.7976, while a breakout above the stop-loss level would invalidate the bearish setup.
Trade Setup
Entry: 0.8240
Target: 0.7976
Stop Loss: 0.8390
I'll wait for bearish confirmation with increasing selling volume before expecting continuation.
This is my personal analysis, not financial advice.
In-depth trading ideas
๏ปฟEVAA CAN BE NEXT NARRATIVE$EVAA is now moving hard after the previous fresh wallet accumulation signal
is it another fake rally or next big narrative?
You still need MM mindset, timing, structure, and risk management to turn the thesis into a real position.
But the pattern is getting harder to ignore.
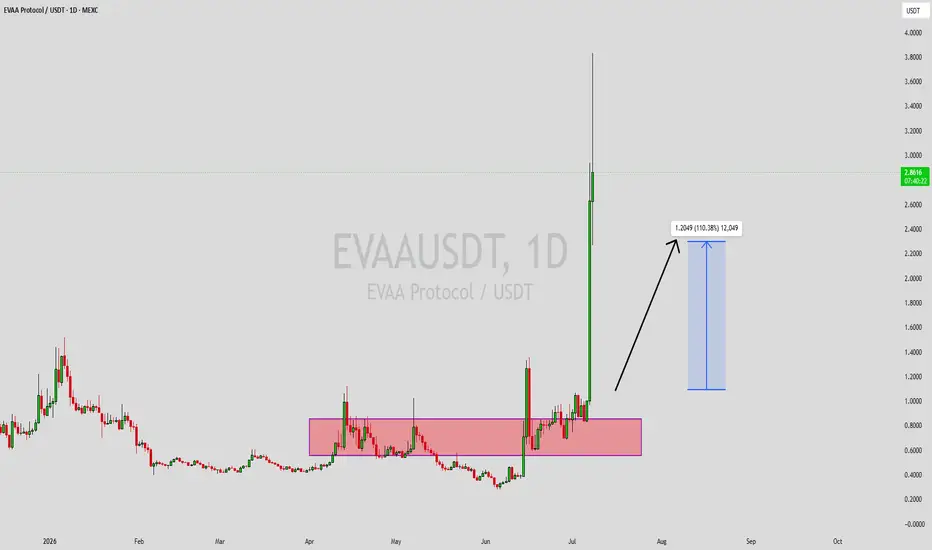
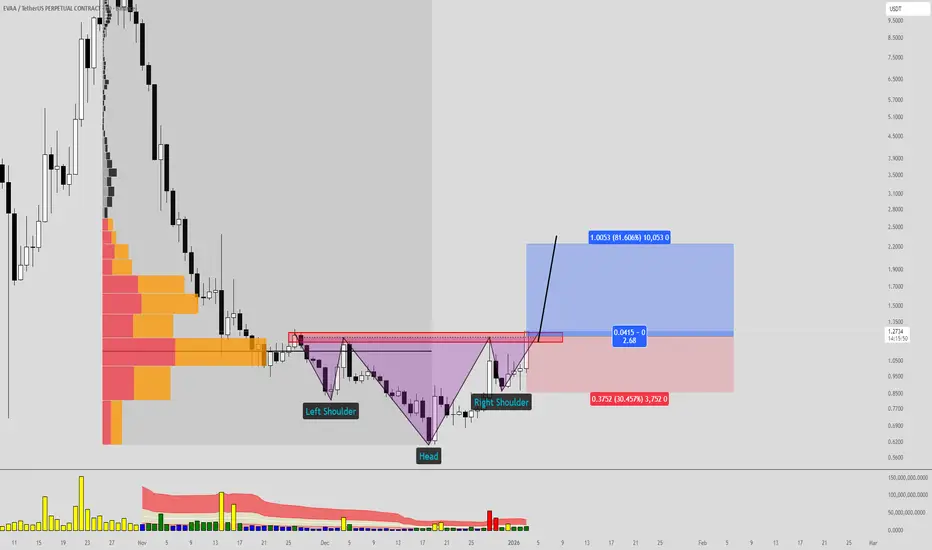
EVAA Ready for a 40% Pump?EVAA is showing strong momentum as buyers continue to defend key support levels and volume remains healthy.
๐ Bullish structure remains intact
๐ฅ Buying pressure is increasing
๐ฐ Market interest continues to grow
โก A breakout above resistance could trigger a rapid move higher
If momentum stays strong and bulls reclaim higher levels, a 30โ40% rally is well within reach.
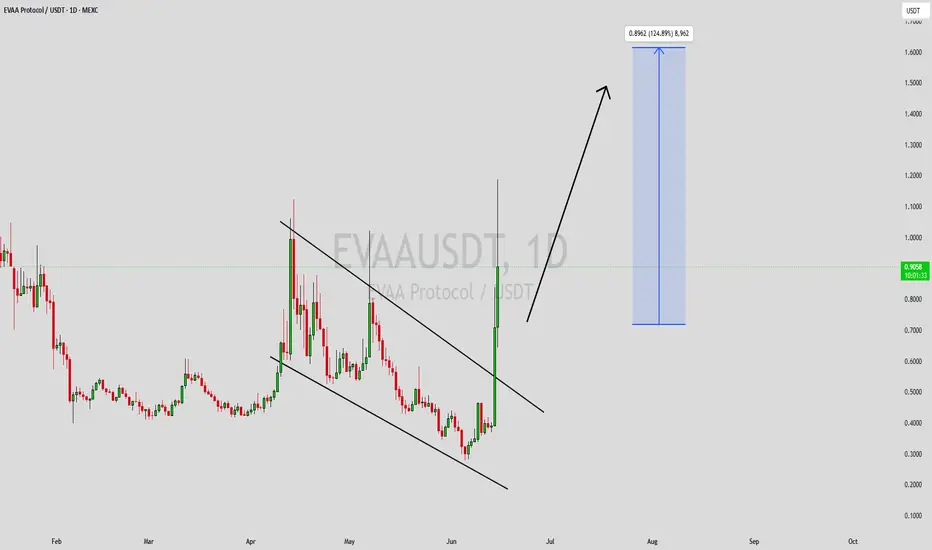
EVAAUSDT Forming Bullish MomentumEVAAUSDT is forming a clear bullish momentum pattern, a classic bullish wave signal that often indicates an upcoming breakout. The price has been consolidating within a narrowing range, suggesting that selling pressure is weakening while buyers are beginning to regain control. With consistent volume confirming accumulation at lower levels, the setup hints at a potential bullish breakout soon. The projected move could lead to an impressive gain of around 90% to 100% once the price breaks above the wedge resistance.
This bullish momentum pattern is typically seen at the end of downtrends or corrective phases, and it represents a potential shift in market sentiment from bearish to bullish. Traders closely watching EVAAUSDT are noting the strengthening momentum as it nears a breakout zone. Good trading volume adds confidence to this pattern, showing that market participants are positioning early in anticipation of a sustained upward move.
Investors' growing interest in EVAAUSDT reflects rising confidence in the project's long-term fundamentals and current technical strength. If the breakout confirms with sustained buying volume, this could mark the start of a fresh bullish leg. The ongoing consolidation suggests that buyers are steadily accumulating positions while bearish pressure continues to weaken, creating favorable conditions for a strong upside rally.
Traders might find this a valuable setup for medium-term gains, especially as the bullish momentum pattern nears completion and buying momentum continues to accelerate. A confirmed breakout above resistance could attract additional market participation and potentially drive the price toward its projected upside target over the coming weeks.
โ
Show your support by hitting the like button!
โ
Leave a comment below! (What is your opinion about this coin?)
Your feedback and engagement keep me inspired to share more insightful market analysis with you!
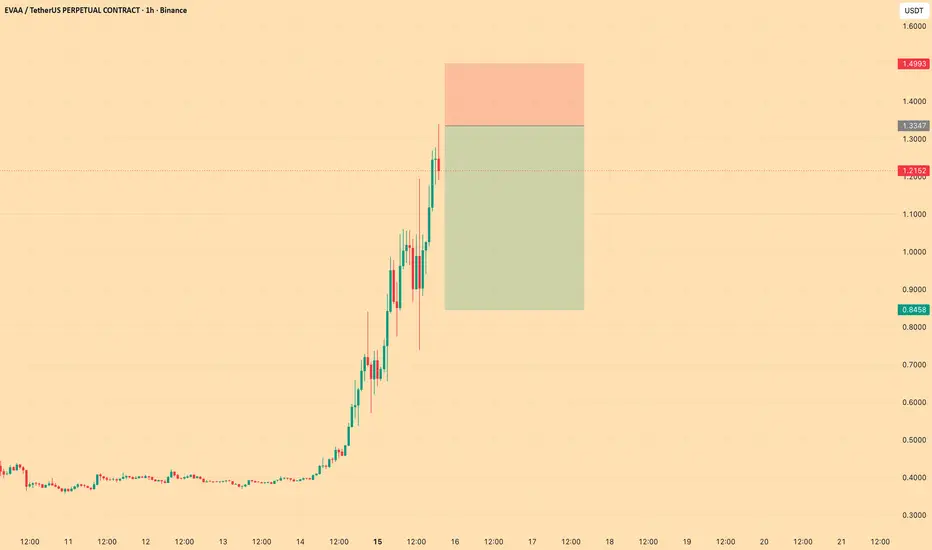
EVAA Ready for a 40% Correction?โ ๏ธ Momentum is becoming overheated
๐ฐ Profit-taking pressure is increasing
๐ Price is testing a key resistance zone
๐ A 30โ40% correction would not be unusual after a parabolic run
A correction doesnโt automatically mean the trend is overโit can be a healthy reset before the next major move.
EVAA Ready for a 30% Correction?After a strong rally, EVAA may be entering a zone where profit-taking starts to increase.
โ ๏ธ Momentum appears stretched
๐ฐ Early buyers could lock in gains
๐ Resistance pressure is building
๐ A 20โ30% pullback would be normal after a sharp move
As long as major support holds, a correction could simply be a healthy reset rather than a trend reversal.
EVAAUSDT Forming Bullish MomentumEVAAUSDT is forming a clear bullish momentum pattern, a classic bullish wave signal that often indicates an upcoming breakout. The price has been consolidating within a narrowing range, suggesting that selling pressure is gradually weakening while buyers are beginning to regain control. With consistent trading volume confirming accumulation at lower levels, the current setup points toward a potential bullish breakout in the near term. The projected move could lead to an impressive gain of around 90% to 100% once the price breaks above the key resistance level.
This bullish momentum pattern is commonly seen after extended downtrends or corrective phases, signaling a possible shift in market sentiment from bearish to bullish. Traders closely watching EVAAUSDT are noticing strengthening momentum as the price approaches a critical breakout zone. Healthy trading volume adds confidence to this setup, indicating that market participants may be positioning early in anticipation of a strong upward move.
Investors' growing interest in EVAAUSDT reflects increasing confidence in both the project's long-term potential and its current technical structure. If the breakout is confirmed with sustained buying volume, it could signal the beginning of a fresh bullish trend. Traders may find this an attractive opportunity for medium-term gains as the momentum pattern completes and buying pressure continues to build.
โ
Show your support by hitting the like button!
โ
Leaving a comment below! (What is You opinion about this Coin)
Your feedback and engagement keep me inspired to share more insightful market analysis with you!
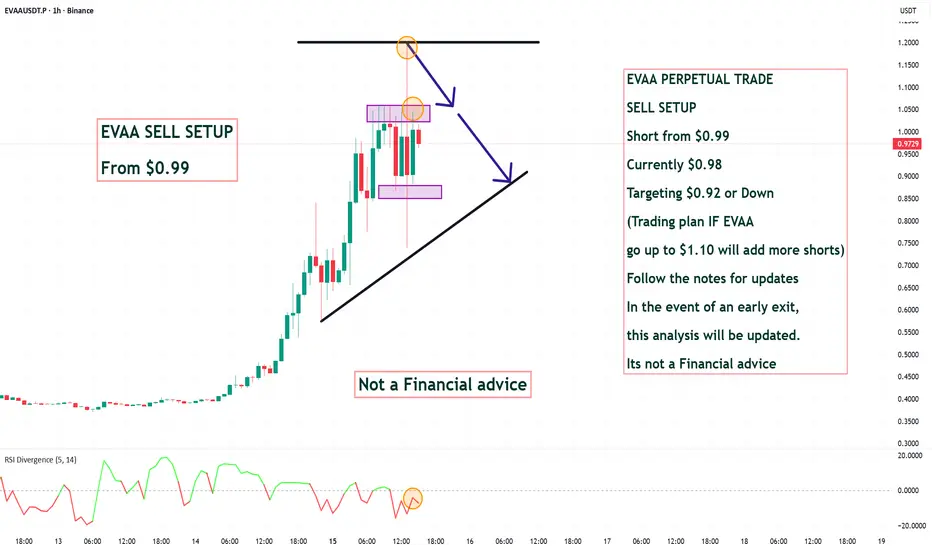
EVAA PERPETUAL TRADESELL SETUP Short from $0.99EVAA PERPETUAL TRADE
SELL SETUP
Short from $0.99
Currently $0.98
Targeting $0.92 or Down
(Trading plan IF EVAA
go up to $1.10 will add more shorts)
Follow the notes for updates
In the event of an early exit,
this analysis will be updated.
Its not a Financial advice
EVAAUSDT Forming Falling WedgeEVAAUSDT is forming a clear falling wedge pattern, a classic bullish wave signal that often indicates an upcoming breakout. The price has been consolidating within a narrowing range, suggesting that selling pressure is weakening while buyers are beginning to regain control. With consistent volume confirming accumulation at lower levels, the setup hints at a potential bullish breakout soon. The projected move could lead to an impressive gain of around 90% to 100% once the price breaks above the wedge resistance.
This falling wedge pattern is typically seen at the end of downtrends or corrective phases, and it represents a potential shift in market sentiment from bearish to bullish. Traders closely watching EVAAUSDT are noting the strengthening momentum as it nears a breakout zone. The good trading volume adds confidence to this pattern, showing that market participants are positioning early in anticipation of a reversal.
Investorsโ growing interest in EVAAUSDT reflects rising confidence in the projectโs long-term fundamentals and current technical strength. If the breakout confirms with sustained volume, this could mark the start of a fresh bullish leg. Traders might find this a valuable setup for medium-term gains, especially as the wedge pattern completes and buying momentum accelerates.
The combination of a tightening price structure, increasing accumulation, and improving momentum makes EVAAUSDT an attractive coin to watch. A successful breakout above resistance could trigger strong bullish momentum and potentially open the door for substantial upside in the coming weeks.
โ
Show your support by hitting the like button!
โ
Leave a comment below! (What is your opinion about this coin?)
Your feedback and engagement keep me inspired to share more insightful market analysis with you! ๐๐
#EVAA#EVAA is currently trading around 0.6942 ๐ช, showing signs of a potential breakout from a falling wedge pattern. The falling wedge suggests a possible bullish reversal ๐, with the price consolidating within the converging trendlines. The next target is indicated at 1.1000, presenting a significant upside opportunity ๐.
#EVAA #crypto #trading #altcoin
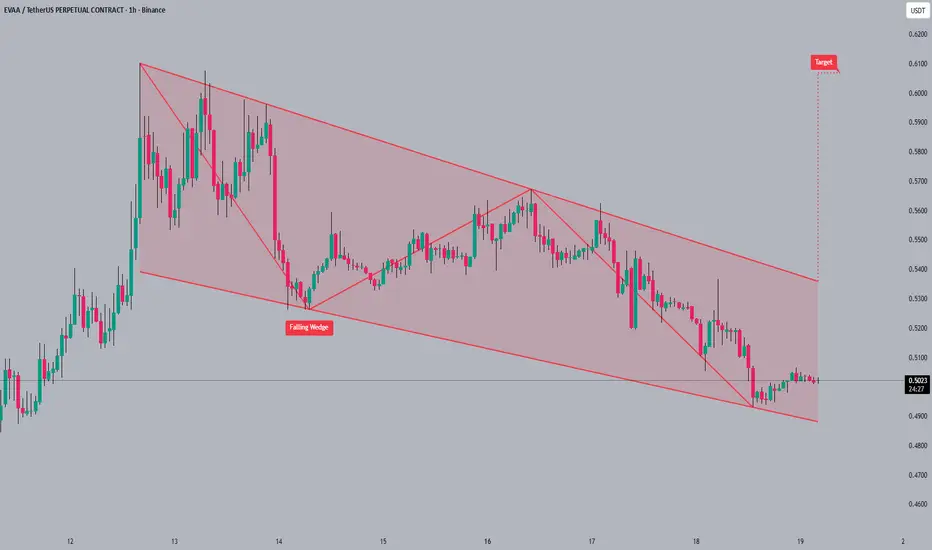
#EVAA #EVAA is currently trading around 0.5024 within a defined falling wedge pattern ๐. The price has been consolidating within this wedge ๐ suggesting a potential breakout soon. A bullish target is visualized near 0.6100 if #EVAA breaks out to the upside ๐.
Trading falling wedges requires patience and confirmation of the breakout before taking action ๐ง.
#EVAA #crypto #trading #altcoin
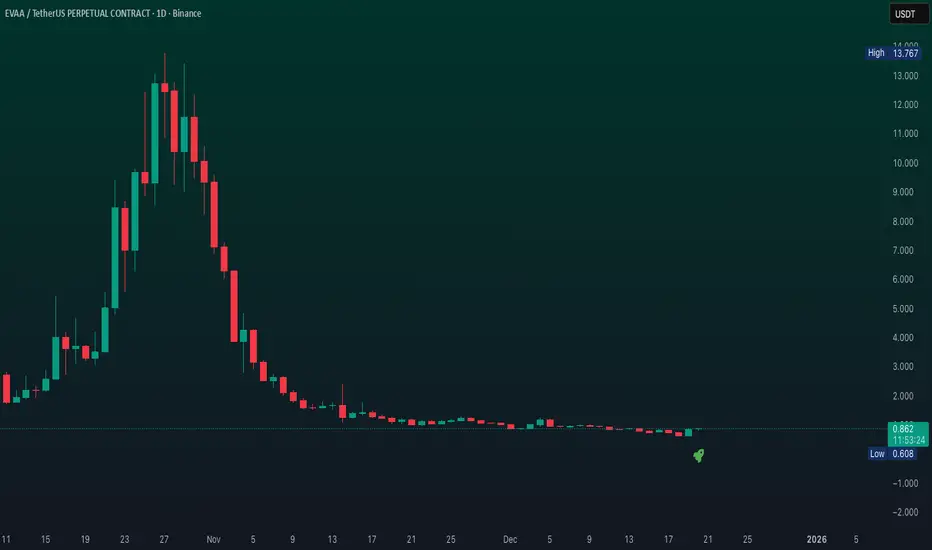
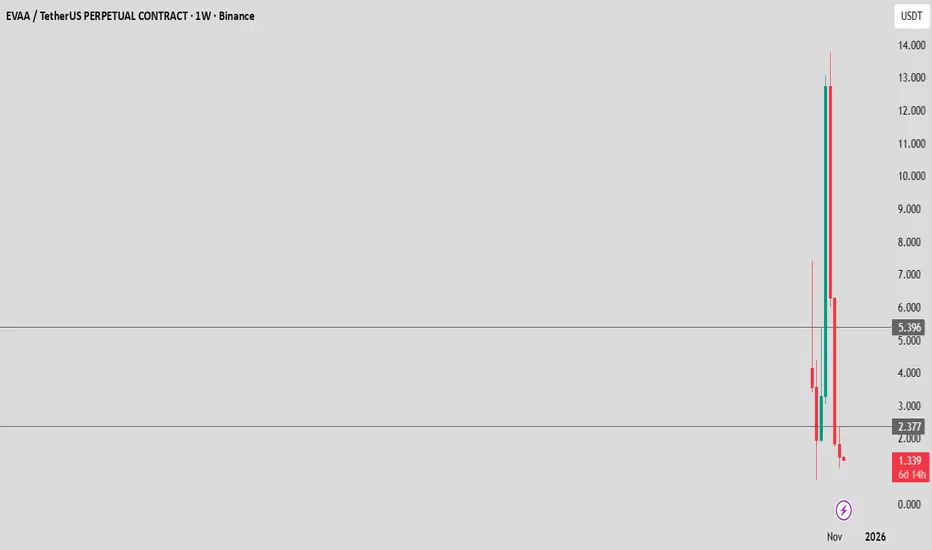
EVAABullish Scenario (very low probability)
For any reversal to occur, the following conditions must be met:
The price must hold the 1.30โ1.35 zone
โ if this fails โ we move to 1.00 or lower
A weekly close above 2.377 USDT
โ this would be the first bullish confirmation
For a true trend reversal โ a breakout above 5.396 USDT
Targets in a bullish continuation:
Target 1 โ 2.377 USDT
Target 2 โ 5.396 USDT
Target 3 โ 7.00 USDT (upper wick rebounds)
Target 4 โ 10 USDT+ (only in the case of a new hype cycle)
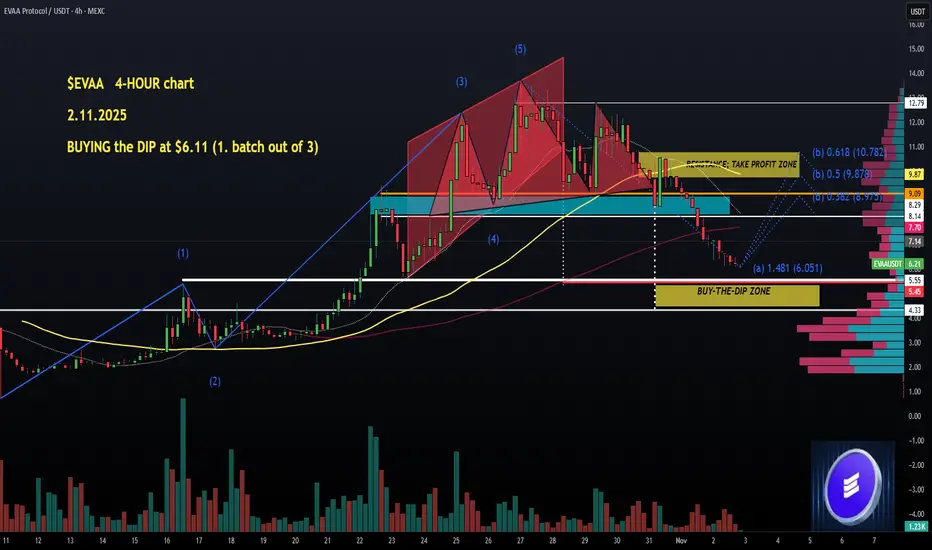
$EVAA (4-HOUR): EXTREMELY oversold, BUYING the DIP at $6,11$EVAA has become EXTREMELY OVERSOLD on the RSI (below 10), and I had a plan to BUY these dips.
Here we go โ SPOT purchase #1 at $6.11, with two more planned at $5.55 and $4.40.
The correction has been very deep (from nearly $14 ATH), so a technical bounce should be expected soon.
Take-Profit levels (for now):
$8.95
$9.85
$10.75
And by the way, that WYCKOFF Distribution schematic I posted yesterday on the #EVAA chart around $8+ โ the resemblance has become even clearer now.
Solid asset, no rug-pull vibes, and itโs legit working on CRYPTOCAP:TON , so it should perform well once sentiment flips.
๐๐ฝ
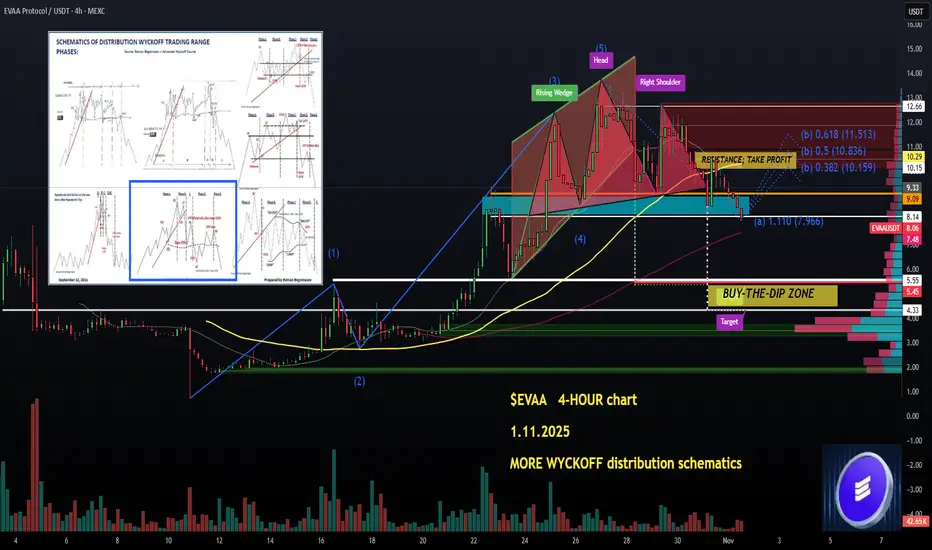
$EVAA (4-HOUR): more WYCKOFF DISTRIBUTION schematics As predicted in my last $EVAA analysis (quoted), it's time for some correction. I'm 70% out of this trade, closed very well above $10 and $12.
Now, what we have is both an ELLIOT Wave regular retracement and also a variant of the #WYCKOFF distribution pattern (highlighted on the chart).
All this is backed by already clear classical bearish chart patterns that have broken down: a RISING WEDGE (targeting $5.55, a horizontal SUPPORT level โ close to my entry) and a HEAD & SHOULDERS (targeting $4.33, also a key horizontal SUPPORT level).
The strategies for me:
1. BUY THOSE DIPS between $4.33 and $5.55. There will be a significant rebound off that zone, 90% guaranteed.
2. A more risky strategy โ enter now at $8.20, at SUPPORT, oversold RSI, and hope for a projected DEAD CAT bounce toward $10.2 - $10.9.
The 2 pattern BREAKDOWNS that are active, the WYCKOFF distribution... not looking good short-term. I will exit my remaining 30% of the SPOT slightly above $10 if this happens, and wait for a deeper pullback before a re-entry. Strategy number 1 it is, not advice, never ever.
CRYPTOCAP:TON has been solid, though, so #EVAA could get another little rally, potentially, we will see. DOWNTREND and stagnating TVL โ not BULLISH right now.
๐ฝ๐
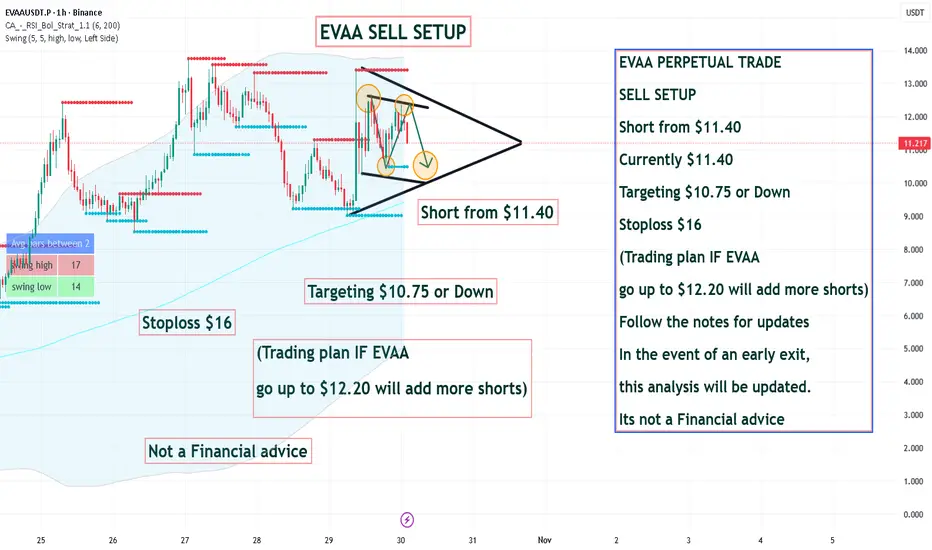
EVAA PERPETUAL TRADE SELL SETUP Short from $11.40EVAA PERPETUAL TRADE
SELL SETUP
Short from $11.40
Currently $11.40
Targeting $10.75 or Down
Stoploss $16
(Trading plan IF EVAA
go up to $12.20 will add more shorts)
Follow the notes for updates
In the event of an early exit,
this analysis will be updated.
Its not a Financial advice
Scalp Long โ EVVA๐ Scalp Long โ EVVA
RSI is oversold on both 15m and 1h timeframes, showing seller exhaustion.
Price is holding above strong support, while buying volume is surging again โ signaling a potential rebound.
๐ฏ Plan:
โ Enter after confirmation of bullish reversal.
โ TP: 12.317 | SL: 8.685 | RR: 1 : 2.24
Market structure supports a recovery move.
Keep entries precise, trail SL as momentum builds.
Stay disciplined โ act only on a confirmed setup.
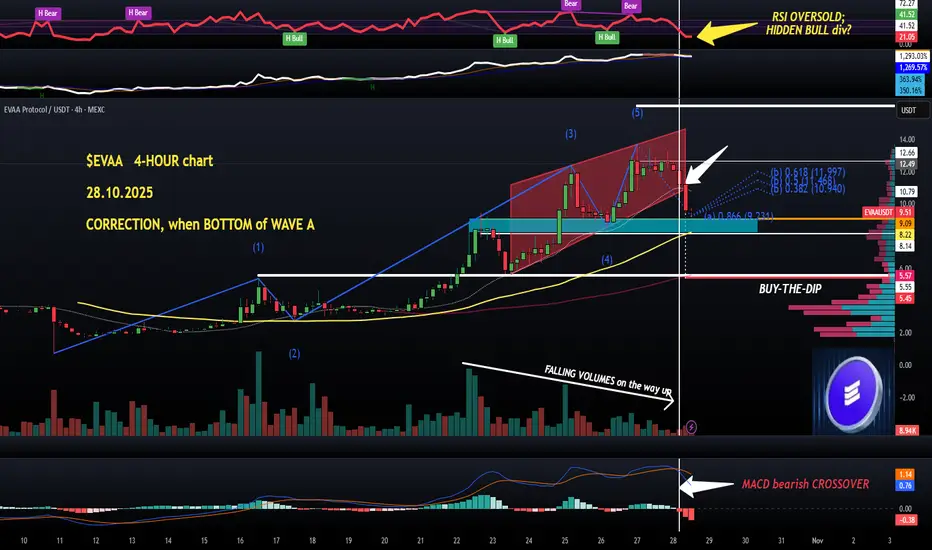
$EVAA (4-HOUR): hard CORRECTION, when DEAD CAT BOUNCE?I did warn $EVAA bulls yesterday evening, at $12.3, about multiple red flags and we have had a massive correction.
Text-book transition from an exhausted WAVE 5 into a deeper retracement, -25 % since my post and nearly - 35% from the ATH of $13.7.
Best strategy for those who want to increase exposure?
Use a conflunce of established SUPPORT levels ($5.55 being the deepest hard support and the $8.15 - $9.1 zone, highlighted in light blue box) with other technical events, like the upcurving yellow 50 MA ($8.22), oversold RSI (check!), a potential reclaim of the RISING WEDGE breakdown level etc.
#EVAA unlike most of all other coins, still has a BULLISH market structure on its main chart, the 4-HOUR one in this case. Important.
A HIDDEN BULLISH RSI divergence is being formed atm, depending on the next candle close, and if we do get that divergence, I will zoom in on the HOURLY like a HAWK.
Will post here if a LONG set-up is ripe
๐๐ฝ
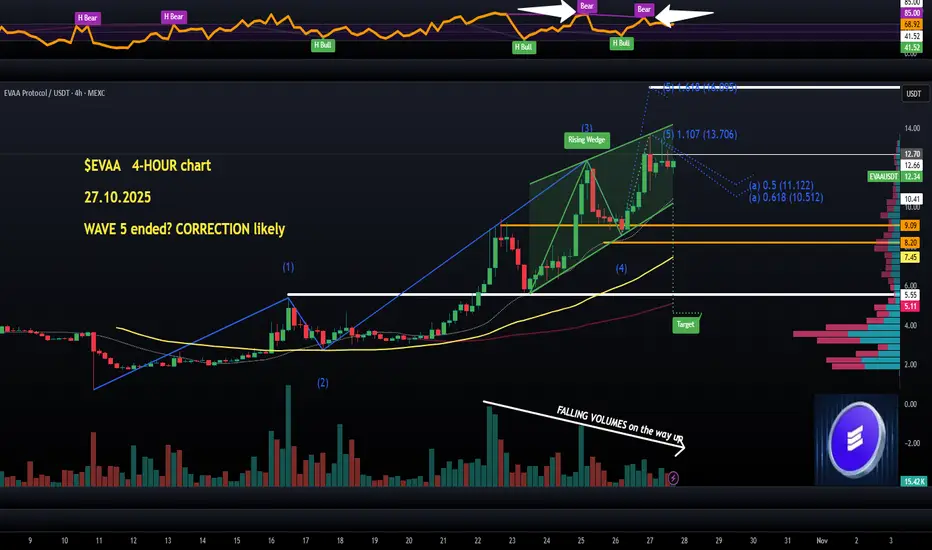
$EVAA (4-HOUR): CORRECTION soon, many RED FLAGS here$EVAA has been on FIRE since my Saturday update and HIT my second TP at $13.15 followed by the ATH at $13.7.
I have a remaining 30% fraction of the SPOT entry that I was planning to keep as a moonbag, but due to unforeseen circumstances on the 4-HOUR chart, I might as well try and EXIT fully at the very next target of WAVE 5, fib 1.618 ($16).
I can imagine this coin going much higher (still merely an $80M marketcap, very small for a 'first lending protocol on CRYPTOCAP:TON to be honest)... BUT!
A second BEAR RSI DIVERGENCE in a row, FALLING VOLUMES, a bearish RISING WEDGE (some traders would say it was an ASCENDING CHANNEL), and my favourite type of the ELLIOT'S WAVE count - very clean in a steady UPTREND.
And a series of solid rejection wicks on recent candles.
And also a DOUBLE TOP on the HOURLY. Quite a lot of RED FLAGS, to be fair.
A correction could start any minute, my first two targets would be based on WAVE A targets, on the chart.
This coin has been a superb earner, let's find more like this one.
๐๐ฝ
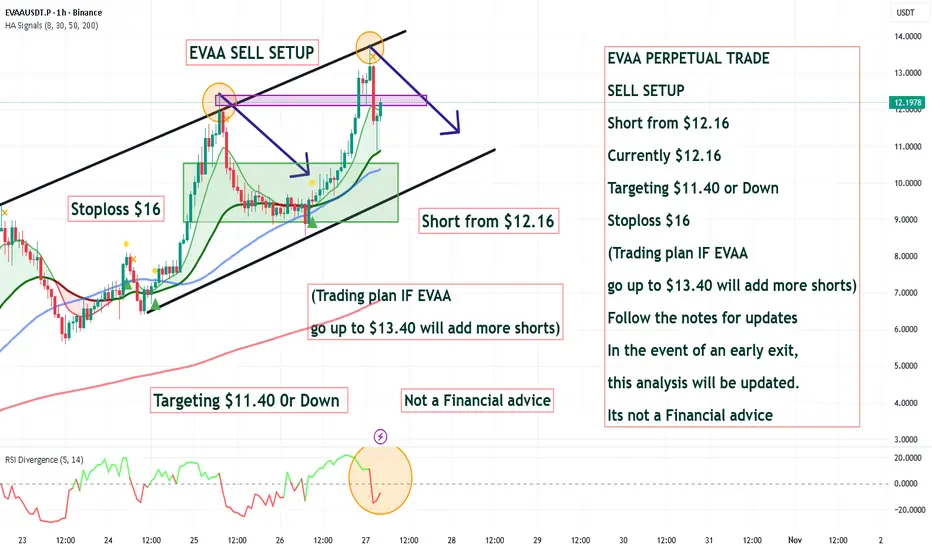
EVAA PERPETUAL TRADE SELL SETUP Short from $12.16EVAA PERPETUAL TRADE
SELL SETUP
Short from $12.16
Currently $12.16
Targeting $11.40 or Down
Stoploss $16
(Trading plan IF EVAA
go up to $13.40 will add more shorts)
Follow the notes for updates
In the event of an early exit,
this analysis will be updated.
Its not a Financial advice