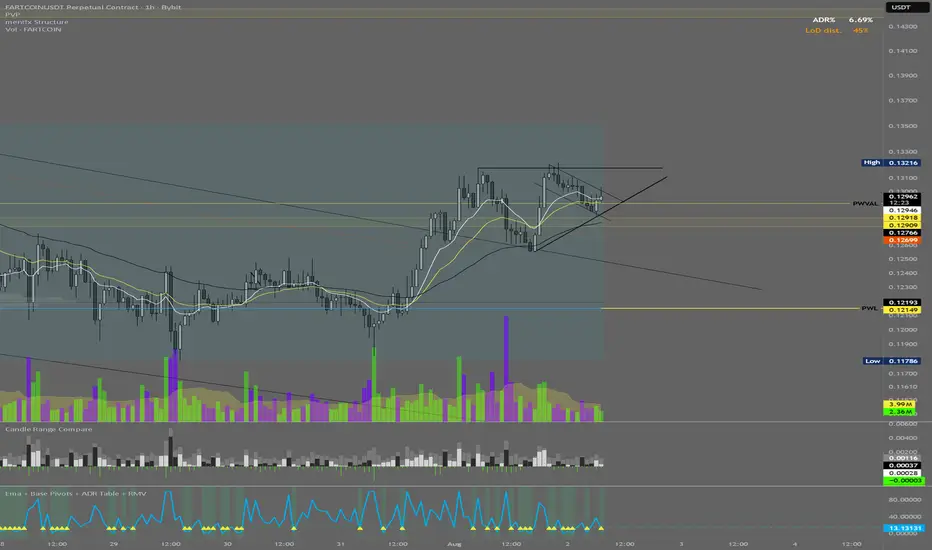
FARTCOIN 1H VCP Breakout Watch⚛️FARTCOIN is building a clean 1H VCP-style structure beneath the 0.1312 resistance shelf.
The first impulse established the move, and price has since started tightening with higher lows pressing into flat resistance. Volume has cooled during the consolidation, which is what I want to see as the range contracts.
My ideal sequence is one more tap into 0.1312, followed by a controlled pullback that holds above the prior higher low and coils tighter into the apex. That would create a cleaner launch point than chasing a breakout from the middle of the range.
Bullish confirmation: A break above 0.1312 with participation, followed by acceptance above that level. The best-case continuation is a breakout, retest, then hold.
Support to hold: 0.1295 to 0.1292 initially, with 0.1280 to 0.1277 as the key structural support zone.
Failure scenario: If price loses 0.1277 and accepts below it, the VCP thesis weakens and this is more likely another range rotation than a continuation setup.
Location → Compression → Confirmation.
This remains a watchlist until volume confirms the expansion. Not a signal. Just how I’m reading structure and participation.
In-depth trading ideas
FARTCOIN USDT LONG SIGNAL#18. FARTCOIN/USDT – Trade Setup (LONG)
📈 Position Type: LONG
🕒 Timeframe: 1H
📊 Market: Futures
💰 Entry Zone:
0.1364
0.1315
🛑 Stop-Loss:
0.1290
🎯 Take-Profit Targets:
• TP1: 0.1415
• TP2: 0.1518
• TP3: 0.1618
• TP4. 0.1730
Tp5.
⚙️ Leverage:
5*3
▫️ After TP1, move SL to Entry + 0.2%.
▪️ Exit Plan:
• 40% at TP1
• 20% at TP2
• 20% at TP3
20% at TP4
📌 Risk Management:
Risk only 1–2% of your capital per trade.
⚠️ Always check and confirm the setup on your chart before entering the trade.
#FARTCOINUSDT.PFARTCOINUSDT.P is showing signs of increasing bullish momentum, with buyers beginning to step in. If this trend continues, we could see strong buying pressure and a potential breakout in the coming sessions.
👀 Keep it on your watchlist, wait for a confirmed entry, and always practice proper risk management.
Trade smart and stay disciplined! 📈🔥
DEMAND ZONE: 0.12126
SPPLY ZONE: 0.15262-0.1803
FARTCOIN / FARTCOINUSDT Long Setup | Breaker Block ReclaimMARKET ANALYSIS
FARTCOIN is currently reacting from a key technical area highlighted on the chart.
As long as the protected support zone remains intact, the bullish market structure remains valid and higher liquidity targets may continue to attract price action.
A breakdown below the invalidation level would weaken the current bullish scenario and require a reassessment of market conditions.
📍 Entry, Stop Loss and Take Profit levels are marked directly on the chart.
━━━━━━━━━━━━━━
⚠️ DISCLAIMER
This publication is provided solely for educational and market observation purposes.
Nothing contained in this analysis should be considered financial advice, investment advice, or a recommendation to buy or sell any financial instrument.
All trading and investment decisions remain solely the responsibility of the individual trader.
Always conduct your own research and apply proper risk management before entering any position.
━━━━━━━━━━━━━━
🎯 PARALOG
▪️Crypto Market Analysis
▪️BTC Futures Signals
▪️Bitcoin & Altcoin Market Analysis
Precision • Momentum • Timing
━━━━━━━━━━━━━━
Exchange: #MEXC Futures
#bitcoin #btc #crypto #futures #technicalanalysis
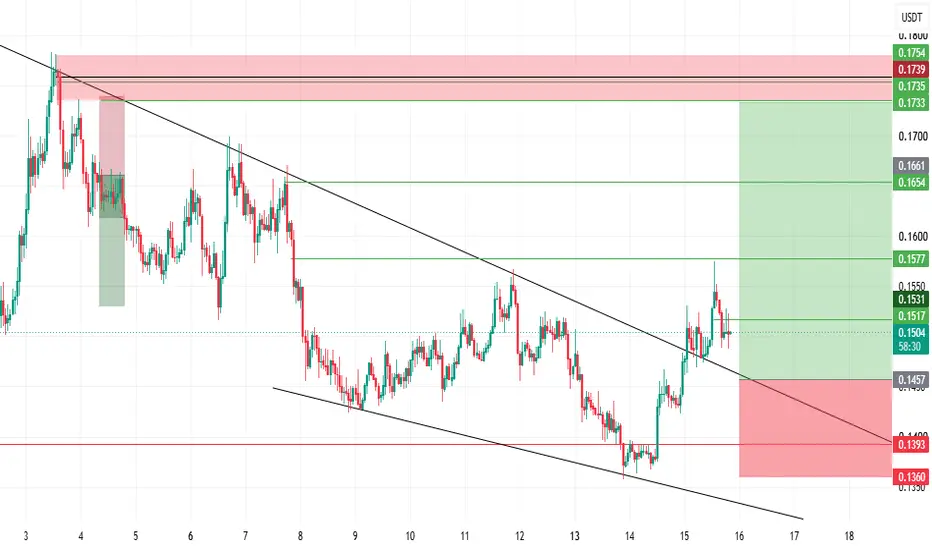
FARTCOIN USDT LONG SIGNAL#79. FARTCOIN/USDT – Trade Setup (LONG)
📈 Position Type: LONG
🕒 Timeframe: 1H
📊 Market: Futures
💰 Entry Zone:
0.1460
0.1395
🛑 Stop-Loss:
0.1360
🎯 Take-Profit Targets:
• TP1: 0.1517
• TP2: 0.1577
• TP3: 0.1654
• TP4: 0.1733
⚙️ Leverage:
5 *3
▫️ After TP1, move SL to Entry + 0.2%.
▪️ Exit Plan:
• 40% at TP1
• 20% at TP2
• 20% at TP3
20% at. TP4
📌 Risk Management:
Risk only 1–2% of your capital per trade.
⚠️ Always check and confirm the setup on your chart before entering the trade.
FARTCOIN USDT LONG SIGNAL#47. FARTCOIN/USDT – Trade Setup (LONG)
📈 Position Type: LONG
🕒 Timeframe: 1 H
📊 Market: Futures
💰 Entry Zone:
0.1531
🛑 Stop-Loss:
0.1474
🎯 Take-Profit Targets:
• TP1: 0.1557
• TP2: 0.1590
• TP3: 0.1628
• TP4: 0.1667
TP5: 0.1709
TP6: 0.1753
⚙️ Leverage:
5- 10
⚠️ After reaching TP1, move Stop-Loss to Entry Price.
📌 Risk Management:
Risk only 1–2% of your capital per trade.
Always confirm the setup on your chart before entry
FARTCOIN USDT LONG SIGNAL#14
FARTCOIN/USDT – Trade Setup (LONG)
📈 Position Type: LONG
🕒 Timeframe: 1 H
📊 Market: Futures
💰 Entry Zone:
0.1530
🛑 Stop-Loss:
0.1450
🎯 Take-Profit Targets:
• TP1: 0.1582
• TP2: 0.1655
• TP3: 0 .1745
• TP4: 0.1830
TP5: 0.1917
TP6: 20
⚙️ Leverage:
5- 3
⚠️ After reaching TP1, move Stop-Loss to Entry Price.
📌 Risk Management:
Risk only 1–2% of your capital per trade.
Always confirm the setup on your chart before entry
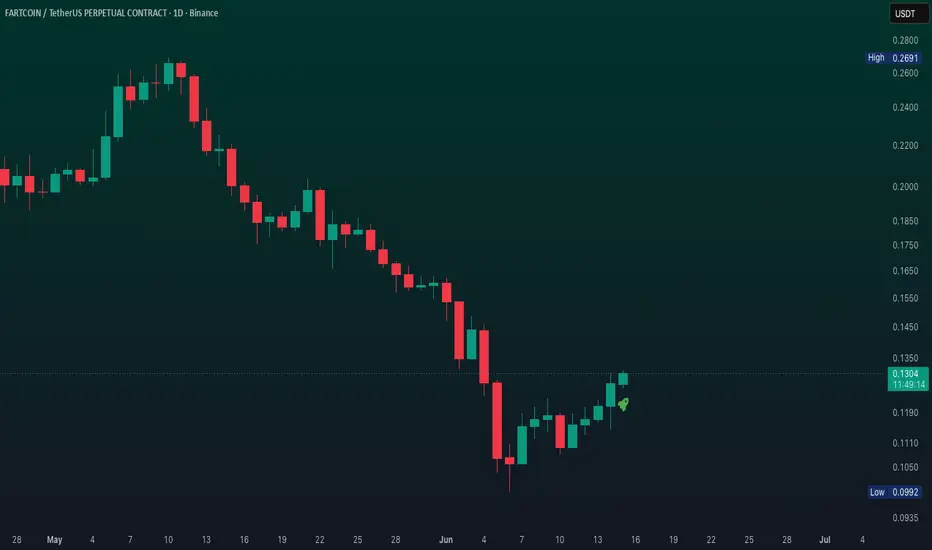
Fartcoin has formed a bullish triangle (1D)Before anything else, Fartcoin printed a long lower shadow on the chart, and a large portion of that wick has already been filled.
A bullish contracting triangle can be observed on the higher time frames.
Price is expected to find support within the highlighted green zone before rallying toward the marked targets.
The targets are shown on the chart. Once the first target is reached, move your stop-loss to breakeven.
Don't forget proper risk management, especially when trading meme coins.
A daily candle close below the invalidation level will invalidate this analysis.
If you have a coin or altcoin you want analyzed, first hit the like button and then comment its name so I can review it for you.
Do you also think FARTCOIN is bullish?
FARTCOIN USDT SHORT SIGNAL#7
FARTCOIN/USDT – Trade Setup (SHORT)
📈 Position Type: SHORT
🕒 Timeframe: 1 H
📊 Market: Futures
💰 Entry Zone:
0.1660
0.1704
🛑 Stop-Loss:
0.1739
🎯 Take-Profit Targets:
• TP1: 0.1619
• TP2: 0.1572
• TP3: 0.1530
• TP4:
TP5:
TP6:
⚙️ Leverage:
5- 3
⚠️ After reaching TP1, move Stop-Loss to Entry Price.
📌 Risk Management:
Risk only 1–2% of your capital per trade.
Always confirm the setup on your chart before entry
$FARTCOIN - Building a Base?After a sharp selloff from the local highs, price has started to stabilize and is no longer making aggressive lower lows. Momentum has cooled off, sellers appear to be losing steam, and we're beginning to see a period of consolidation around the recent demand zone. This is the kind of price action you'd want to see before any meaningful recovery attempt.
It's building a mini base here after deviating below the recent lows. If we can stay above 0.10, I believe it can still retest the 0.20-0.24 supply zone. I wouldn't expect a straight move higher though—a bit of chop and consolidation below resistance would be healthy before any breakout attempt.
BTC, ETH + LAB, HYPE, FARTCOIN my view on marketIn this video, I broke down the current crypto market picture: went through Bitcoin and Ethereum, marked out key levels and what to expect next. Separately covered Bitcoin and Tether dominance — what they're saying about market sentiment right now. Also took a look at the alts: HYPE, FARTCOIN, and LAP — where they stand and what to keep an eye on.
FARTCOIN / FARTCOINUSDT Long Setup | Breaker Block ReclaimMARKET ANALYSIS
FARTCOIN is currently reacting from a key technical area highlighted on the chart.
As long as the protected support zone remains intact, the bullish market structure remains valid and higher liquidity targets may continue to attract price action.
A breakdown below the invalidation level would weaken the current bullish scenario and require a reassessment of market conditions.
📍 Entry, Stop Loss and Take Profit levels are marked directly on the chart.
━━━━━━━━━━━━━━
⚠️ DISCLAIMER
This publication is provided solely for educational and market observation purposes.
Nothing contained in this analysis should be considered financial advice, investment advice, or a recommendation to buy or sell any financial instrument.
All trading and investment decisions remain solely the responsibility of the individual trader.
Always conduct your own research and apply proper risk management before entering any position.
━━━━━━━━━━━━━━
🎯 PARALOG
▪️Crypto Market Analysis
▪️BTC Futures Signals
▪️Bitcoin & Altcoin Market Analysis
Precision • Momentum • Timing
━━━━━━━━━━━━━━
Exchange: #MEXC Futures
#bitcoin #btc #crypto #futures #technicalanalysis
FARTCOIN SMART MONEY ACTIVITYCRYPTOCAP:FARTCOIN recently stopped bleeding as whales and market makers started accumulating again
Before this, FARTCOIN faced a brutal sell off where whales remained net sellers along with retail
Now it looks like smart money is aligning on the bullish side
Keep an eye on whale and MM flows to see if anything changes in the near term
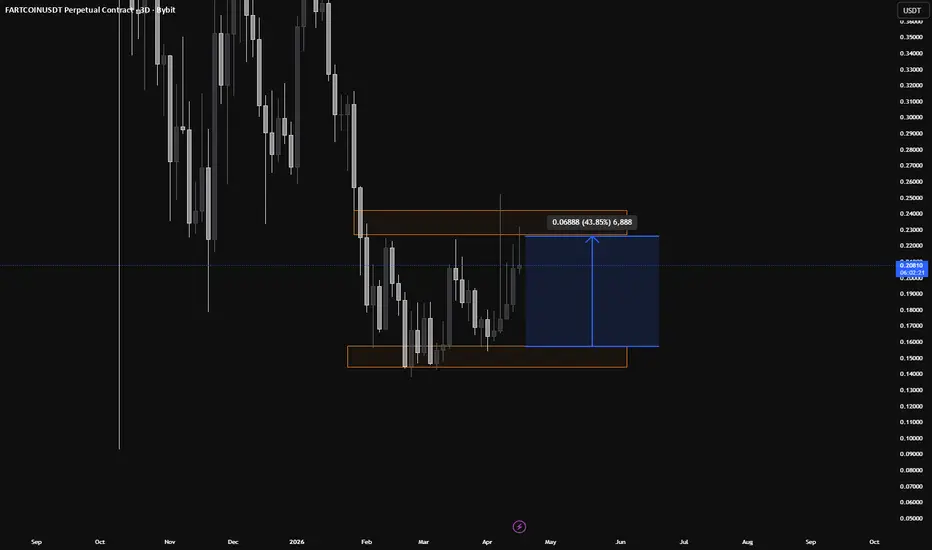
Fartcoin Eyes Range HighsFartcoin is currently trading below a key high-timeframe support level, placing price action at a critical inflection point. While the recent move below support has the potential to become a deviation of the lows, confirmation is still lacking. For the bullish thesis to gain credibility, price must reclaim the lost support level and establish acceptance above it. Until that occurs, the market remains in a state of uncertainty.
A successful reclaim would confirm that the breakdown was a deviation rather than the beginning of a larger bearish trend. This type of price action often signals seller exhaustion, as traders who entered short positions below support become trapped when the market quickly moves back above the level. If this reclaim occurs, it would strengthen the case for a rotational move higher within the broader trading range.
The primary upside target would be the $26 high-timeframe resistance level, which represents the upper boundary of the current range structure. A move toward this area would be consistent with normal range rotation dynamics and would suggest that buyers have regained control of the market.
For now, confirmation remains the key factor. Traders should watch closely for a reclaim of support before positioning for higher prices. Until that signal appears, the deviation remains unconfirmed. However, if support is recovered, Fartcoin could be well-positioned for a strong rally toward range highs and continued consolidation within the broader market structure.
fartcoinusdt longInstructions:
Entry point: yellow
Stop loss: red
Take profit: green
👉Leverage x 5-10-20 for crypto
👉Leverage x 20-50-100 for commodities, stocks, indices, and forex
👉Margin 1-5% max.
Always practice risk and money management.
Invest a maximum of 5% on any trade or across all your trades.
Invest only what you can afford to lose, as no one is in control of the market.
👉Our analyses are primarily based on:
breakouts: two trend lines (ascending and descending) and a line indicating a horizontal breakout.
chart patterns: shoulders and head, triangle parttern, elliott impulse, etc etc.
We don't always have the time to track them at all times or to represent them visibly, given the numerous signals, the number of channels to manage, and especially because of the often rapid pace of market movements.
indicators: We associate at least two indicators with this technique.
👉Depending on the circumstances, we use specific indicators, often setting 3 or more take profit levels.
👉Indeed, there are good days in trading and also bad days. No one can promise to win every trade, and like all traders worldwide, we also experience stop-loss orders. However, we win more than we lose and remain positive.
👉You can close the position before or after the take profit orders indicated by the green lines if you are personally satisfied; the same applies to stop loss orders.
👉We must stay positive, clear-headed, and humble.
we cannot provide all instructions or all trades here on this channel.
Good luck to us all, and may God guide us. Amen.
Fartcoin Rejected at $0.26 – Range-Bound Structure ?Fartcoin price action has recently rejected from a key resistance level around $0.26, signaling that sellers remain active at the top of the current range. This rejection has led to a pullback, with price now rotating lower toward support.
The current support level is positioned at the Point of Control (POC), which represents the area of highest traded volume within the range. This level is acting as a key pivot, where price is beginning to show signs of a potential bullish reaction.
If buyers step in and defend the POC, it opens the probability of a move back toward the resistance zone. However, given the recent rejection at $0.26, any rally into this level may be met with renewed selling pressure, increasing the likelihood of another bearish rejection.
This type of price behavior suggests a rotational market structure, where price continues to move between established support and resistance without a clear breakout. As long as both levels hold, Fartcoin is likely to remain range-bound, offering opportunities at the extremes rather than in the middle.
A confirmed breakout above $0.26 or below the POC would be needed to shift the current neutral bias.
$FARTCOIN - Key Level to HoldCRYPTOCAP:FARTCOIN tagged its second level resistance after breaking out from the .20s range. Price is now retesting the breakout area, which is the key level that needs to hold for continuation higher.
The current reaction around .20 will likely decide the next move. Holding this zone keeps the structure constructive and opens the path for another push toward the .25–.28 resistance range. A successful reclaim there could shift momentum back in favor of buyers.
However, the bigger thing to watch here is Bitcoin. CRYPTOCAP:BTC is starting to struggle holding above 80k, and if weakness continues across the market, FARTCOIN could lose the .20 support region. In that case, the .18 level becomes the important mid-range support to monitor for a potential higher low.
Fartcoin: Bears are Taking overHello Traders!
The pattern is very clear in Fartcoin, Its now at the top of the channel same as BTC and both are ready to fall hard. BTC will definitely touch the border of supportive line of the channel but its hard for fartcoin to go towards bottom. We have carefully put our stoploss and target in Fartcoin. It will achieve the target soon.
There are few more bearish conformations in Fartcoin.
Stoploss 0.2812 (-9.4%)
Target 0.21 (+18.1%)
My aim is to achieve highest win rate in tradingview trading community :) and we will definitely do that.
> Fibonacci Tool (A1000x Way) – Custom Fibonacci approach for precise market analysis
> Candlestick Patterns – Strong price action confirmation through key candle formations
> A1000x Breakout Strategy – Identifying and trading high-probability breakout setups
> HH, HL & LH, LL Strategy – Market structure analysis for clear trend direction
> Swing Points – Tracking key highs and lows for accurate price movement insight
> A1000x Stoploss Strategy – Strategic stoploss placement for effective risk control
> A1000x Target Strategy – Structured target setting based on price action
We trade using carefully developed strategies and disciplined market analysis, always seeking the best possible accuracy while remembering that ultimate success comes only by the will of Allah.
In some trades, you may notice a relatively larger stop loss or a risk-to-reward ratio that may appear unusual at first glance. However, every trade is taken with proper planning and calculated analysis, not random entries.
Before entering any position, we perform detailed calculations and market evaluation. Based on this analysis, we carefully determine our stop loss and target levels.
I personally apply one of my specialized stop-loss and target strategies, designed to place the stop loss at a logical market level where price is less likely to reach before moving toward the intended target — InshaAllah.
Trading always involves risk, but with discipline, patience, and proper strategy, we aim for consistent and responsible decision-making.
Feel free to share your thoughts, leave a comment, or contact me.
fartcoinusdt longInstructions:
Entry point: yellow
Stop loss: red
Take profit: green
👉Leverage x 5-10-20 for crypto
👉Leverage x 20-50-100 for commodities, stocks, indices, and forex
👉Margin 1-5% max.
Always practice risk and money management.
Invest a maximum of 5% on any trade or across all your trades.
Invest only what you can afford to lose, as no one is in control of the market.
👉Our analyses are primarily based on:
breakouts: two trend lines (ascending and descending) and a line indicating a horizontal breakout.
chart patterns: shoulders and head, triangle parttern, elliott impulse, etc etc.
We don't always have the time to track them at all times or to represent them visibly, given the numerous signals, the number of channels to manage, and especially because of the often rapid pace of market movements.
indicators: We associate at least two indicators with this technique.
👉Depending on the circumstances, we use specific indicators, often setting 3 or more take profit levels.
👉Indeed, there are good days in trading and also bad days. No one can promise to win every trade, and like all traders worldwide, we also experience stop-loss orders. However, we win more than we lose and remain positive.
👉You can close the position before or after the take profit orders indicated by the green lines if you are personally satisfied; the same applies to stop loss orders.
👉We must stay positive, clear-headed, and humble.
we cannot provide all instructions or all trades here on this channel.
Good luck to us all, and may God guide us. Amen.
FARTCOIN Is the Memecoins With the Cleanest Breakout PatternFARTCOIN MEXC:FARTCOINUSDT is trading at 0.19854 USD, up 3.11% on the day. This is a Solana memecoin with a market cap of about 195 million USD.
The FARTCOIN ATH hit 2.76 USD in late 2024, then a Cycle 2 top formed near 1.70 USD in mid-2025. From the second top, price fell hard into the current bottom zone at 0.15 to 0.25 USD, and has moved sideways here for almost 6 months. The lower support zone is holding price very well, with daily candles getting smaller, a classic sign of the final stage of accumulation.
The roadmap on the chart shows a 3-step path. The first target is the 0.80 USD zone, about 4 times higher than now. After that, price often pulls back to retest this area as new support, before pushing up to the final target at 1.70 to 1.80 USD, close to the Cycle 2 top.
Bullish case: price holds the 0.15 USD support and closes firmly above 0.25 USD with volume double the average. Bearish case: lose the support bottom, and there is no clear support below, so price can drop freely.
This pattern looks clean on the chart, but the risk is high. FARTCOIN is a Solana memecoin with much lower liquidity than DOGE or PEPE. Entries need a tight stop loss and small position size.
FARTCOIN/USDT — Descending Channel! Reversal or Breakdown?On the 2D timeframe, FARTCOIN/USDT is clearly moving within a downtrend structure, characterized by consistent lower highs and lower lows. Price is currently trading inside a well-defined descending channel.
The yellow zone (0.189 – 0.154) acts as a strong demand area / key support, which has held multiple times against further downside.
Meanwhile, the upper red trendline serves as a dynamic resistance, continuously pushing the price downward.
---
📐 Chart Pattern
1. Descending Channel (Bearish Structure)
Formed by consistent lower highs and lower lows
Upper red line = resistance
Lower yellow line = support
Price is currently near channel support → compression phase
➡️ This phase often precedes a major directional move
---
2. Falling Wedge (Potential Reversal)
Inside the larger channel, a smaller falling wedge structure is visible:
Price range is tightening
Selling pressure is weakening
Typically considered a bullish reversal pattern
---
📍 Key Levels
Major Support: 0.189 – 0.154 (yellow zone)
Resistance Levels:
0.304
0.397
0.472
0.698 (major resistance / key target)
---
🚀 Bullish Scenario
If price:
Holds above the 0.154 – 0.189 support zone
And breaks out of the channel resistance (red trendline)
Then potential outcomes:
Mid-term trend reversal
Gradual upside toward:
0.304 → 0.397 → 0.472
Extended target at 0.698
📌 Strong confirmation:
Breakout followed by a successful retest
Increasing volume during the breakout
---
📉 Bearish Scenario
If price:
Fails to hold the 0.154 level
Breaks down below channel support
Then potential outcomes:
Continuation of the downtrend
Formation of new lower lows
Downside targets:
0.12
0.10 (previous low area)
📌 This indicates:
Bearish structure remains dominant
No strong reversal signal yet
---
⚖️ Conclusion
FARTCOIN is currently at a critical decision zone:
On one side: strong support + falling wedge potential
On the other: still under pressure from a descending channel
➡️ A breakout or breakdown from this zone will determine the next major move.
#FARTCOIN #CryptoAnalysis #Altcoins #TechnicalAnalysis #CryptoTrading #BullishScenario #BearishScenario #ChartPatterns #DescendingChannel #FallingWedge #SupportAndResistance #CryptoSignals