Huge Profit Potential Is Hidden in the FET Chart! (3D)This is an update to the previous analysis, which you can find in the related publications section.
A large Diametric pattern appears to be forming on the chart, and the price is currently trading in Wave E. Wave E is expected to extend further and become longer.
The primary buying zone is the gre
FETF0 / USTF0
No trades
No trades
FET at macro floor: base recovery toward $0.1660The Macro Picture 🗺️
FET ground down from the $0.2888 macro ceiling all the way to the $0.1323 macro floor and has flattened onto it at $0.1324. The long, steady bleed has given way to a base right on support — exhaustion rather than continuation.
The Setup ⚙️
The Accumulation Zone 🟢
$0.1152–0.132
FET is preparing for a strong buying opportunity (1D)FET appears to be forming either a Diametric or a Symmetrical pattern. If so, Wave G could complete within the green zone, which is where we'll be looking for buy/long opportunities.
If the pattern turns out to be Symmetrical, we expect a rejection from the red zone.
However, if it develops as a D
FET/USDT 4H Technical Analysis – Breakout SetupExample TradingView Idea Description
Title:
FET/USDT 4H – Breakout Watch with Fibonacci & CoinGlass Liquidity
Description:
FET/USDT is approaching a key decision zone.
Technical Confluence:
Descending trendline resistance
Fibonacci 0.236 at 0.1581
Major CoinGlass liquidity cluster at 0.160–0.161
Ope
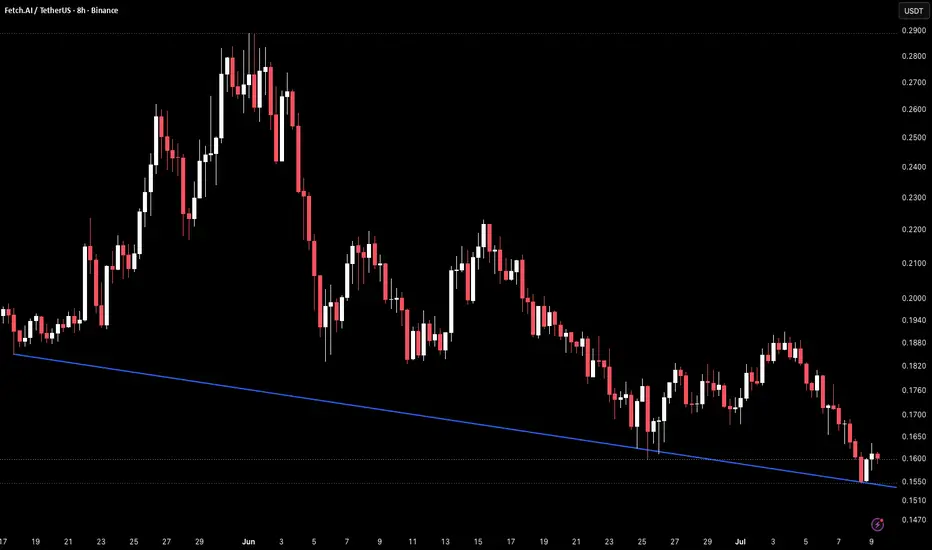
FET 8H – Breakdown Below Trendline Into New LowsFET on the 8H timeframe is currently trading around 0.1954 after breaking below the descending trendline support near 0.1610–0.1630 in early July and pushing into fresh lows near 0.1525, with price now attempting a minor recovery back toward the broken trendline from below.
The chart shows a descen
FET at macro floor: liquidity sweep before the next leg downThe Macro Picture 🗺️
FET has been carving a descending structure since the $0.29 structural peak in early June, printing a clean sequence of lower highs and lower lows. Every rally has been sold into — this is a market defined by supply, where each bounce becomes fuel for the next flush. Price now
FET 8H – Descending Trendline Pressing Into Horizontal SupportFET on the 8H timeframe is currently trading around 0.1969 after a sustained decline from the late May high near 0.2900, with price now compressing between a descending trendline from above and a horizontal support level near 0.1550–0.1600 that has held as a floor through the entire post-spike struc
#FETUSDT bullish momentum#FET
The price is moving within a descending channel on the 1-hour timeframe and has reached the lower boundary. It is now poised for a bounce and is expected to retest this boundary.
The Relative Strength Index (RSI) indicates a downward trend, which is likely to continue given the overbought con
FET: Classic Price Compression PatternFET: Classic Price Compression Pattern – Historical Replay Opportunity with Long-Term Growth Target
FET is flashing highly remarkable technical signals on the higher timeframe as it enters a decisive phase. After officially breaking out of a multi-month long downtrend, the chart is currently movin
See all ideas
Summarizing what the indicators are suggesting.
Oscillators
Neutral
SellBuy
Strong sellStrong buy
Strong sellSellNeutralBuyStrong buy
Oscillators
Neutral
SellBuy
Strong sellStrong buy
Strong sellSellNeutralBuyStrong buy
Summary
Neutral
SellBuy
Strong sellStrong buy
Strong sellSellNeutralBuyStrong buy
Summary
Neutral
SellBuy
Strong sellStrong buy
Strong sellSellNeutralBuyStrong buy
Summary
Neutral
SellBuy
Strong sellStrong buy
Strong sellSellNeutralBuyStrong buy
Moving Averages
Neutral
SellBuy
Strong sellStrong buy
Strong sellSellNeutralBuyStrong buy
Moving Averages
Neutral
SellBuy
Strong sellStrong buy
Strong sellSellNeutralBuyStrong buy