FF/USDT (4h) Consolidating Inside a Falling WedgeFF/USDT is trading inside a falling wedge on the 4H chart, with both trendlines sloping lower while gradually converging. Price continues to form lower highs and lower lows, but the structure is becoming increasingly compressed.
Price is currently around $0.110, still below the upper trendline. A move toward $0.112–$0.114 would bring FF back to the wedge resistance.
A confirmed 4H breakout and hold above the upper boundary could validate the bullish reversal setup and open the way toward the $0.
In-depth trading ideas
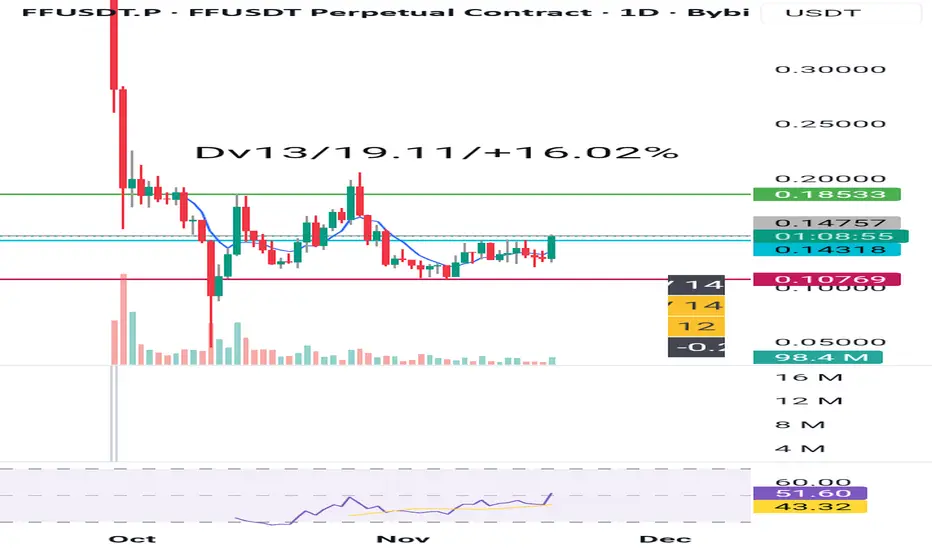
FFUSDT Daily — Potential Bullish Reaction at SupportFFUSDT has pulled back sharply from its September high and is now testing the highlighted support area around 0.10–0.108 USDT. This zone overlaps previous price structure and the lower boundary of the rising blue channel, making it an interesting area to watch for a bullish reaction.
If the Fibonacci drawn from the major swing low to the September high confirms a 61.8% retracement here, that adds another point of confluence to the setup.
The bullish case strengthens if price holds support, forms
FFUSDT Forming Bullish MomentumFFUSDT is forming a clear bullish momentum pattern, a classic bullish reversal signal that often indicates an upcoming breakout. The price has been consolidating within a narrowing range, suggesting that selling pressure is weakening while buyers are beginning to regain control. With consistent volume confirming accumulation at lower levels, the setup hints at a potential bullish breakout soon. The projected move could lead to an impressive gain of around 40% to 50% once the price breaks above t
FF Looks Ready for a Major Drop !FF is one of the coins that has lagged behind the recent market decline and now appears ready for a significant drop.
It has lost an important trendline, and a bearish CH has also formed on the chart, both of which suggest increasing selling pressure.
The price has been forming a series of doji-like candles in this area, indicating indecision. We expect this consolidation to eventually break to the downside.
You may consider entering short positions within the marked supply zone.
The targets
FF/USDT: Pumped 21% Before Entry. Still Valid?#FFUSDT 4H Chart Update 📊
NYSE:FF (Falcon Finance) showed incredible bullish strength and pumped +21% right before tapping our initial entry point. Even though the price front-ran us, the macro analysis remains completely valid.
Here is our updated game plan:
🟢 The Strategy: We are not going to chase the green candles (No FOMO). Instead, we will patiently wait for a healthy pullback into Green Zone No. 1 or No. 2.
🎯 The Trigger: Once the price retraces into these demand areas, we will look
FFUSDT Forming Ascending ChannelFFUSDT is forming a clear ascending channel pattern, a classic bullish wave signal that often indicates an upcoming breakout. The price has been moving steadily within an upward-sloping channel, suggesting that buyers remain in control while the market continues to establish higher highs and higher lows. With consistent volume supporting the trend, the setup hints at a potential bullish breakout soon. The projected move could lead to an impressive gain of around 20% to 30% once the price breaks
FF/USDT 4H: Will the Green Zone Spark the Next Bullish Leg Up?#FFUSDT 4H Chart Analysis 📊
Is NYSE:FF (Falcon Finance) still on its bullish track? Here is the tactical game plan for the next move:
🟢 The Long Entry Strategy: If the price retraces into the Green Zone and we get a valid, high-probability lower-timeframe (LTF) confirmation, we will execute a long position.
⚙️ Risk Management: We are setting up this trade with a maximum of 10x leverage. The specific Take Profit (TP) targets and the Stop Loss (SL) level are already clearly plotted on the cha
FFUSDT | Deep Accumulation → Base FormationFFUSDT | Deep Accumulation → Base Formation → High-Momentum Expansion Setup 🚀
FFUSDT has undergone a full market cycle, starting with a sharp distribution phase followed by a prolonged downtrend. Price has now stabilized at the lower range, forming a clear accumulation base after extended downside.
━━━━━━━━━━━━━━━
📊 Market Structure Breakdown
• Initial phase: Strong sell-off and distribution
• Followed by: Long-term compression near lows
• Current behavior: Tight range with reduced
#FF
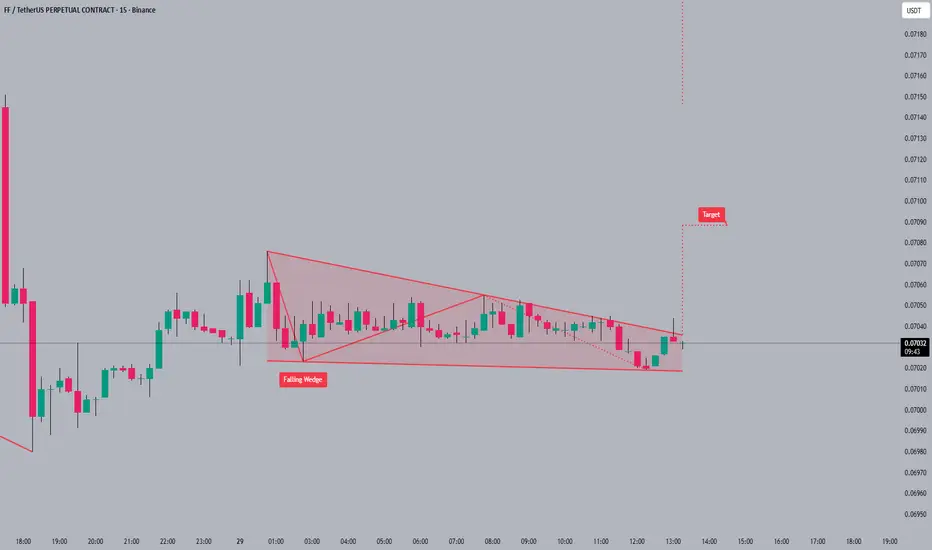
#FF is currently trading at 0.07031, hovering near the breakout point 🧐 of a falling wedge pattern. This pattern suggests a potential bullish reversal, and traders are watching for confirmation with increased volume 📈. The next target is around 0.07090, aligning with the pattern's projected breakout target 🎯.
Always manage risk, especially when trading volatile assets like #FF; patience is key 🔑 for confirmation.
#FF #crypto #trading #altcoin
FF/UsdtBINANCE:FFUSDT
🟢 **Support Level**
Price may **bounce up ⬆️** from here
Like a floor 🏠
If it holds → buyers step in 💪
If it breaks → drop can accelerate 📉
🔴 **Resistance Level**
Price may **reject down ⬇️** from here
Like a ceiling 🏢
If it breaks → breakout move 🚀
⚠️ **Disclaimer:**
This is for educational purposes only 📚
Markets are unpredictable ⚡
Levels can break at any time.
Always manage risk properly and do your own analysis before trading 💼
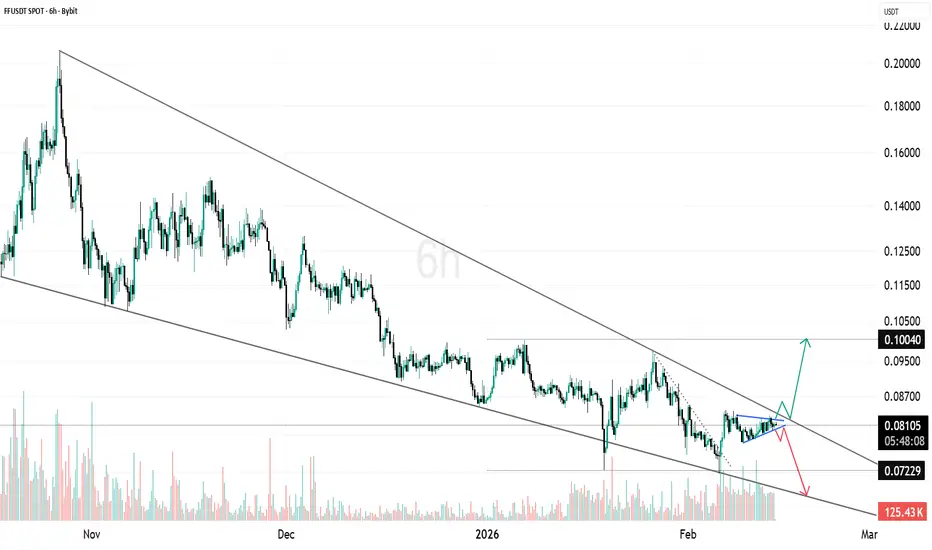
FFUSDT – 6H Falling Wedge Compression Near BreakoutOn the 6H timeframe, the larger structure is a clear falling wedge, formed by two converging downward trendlines. Price has been respecting this structure for months, printing lower highs and lower lows while volatility gradually compresses.
Now price is sitting near the upper boundary of the wedge, around the 0.080 – 0.082 area. This is a critical decision zone.
A falling wedge is typically a bullish reversal structure when broken to the upside. If price manages a clean breakout and holds abo
$FFUSDT (1H) Price AnalysisAt the moment, price has not yet retraced into the marked demand zone. A pullback into this area — or even a shallow retracement above it — will be crucial to confirm buyer strength. If instead FF price continues upward and taps the higher-timeframe (HTF) supply zone around $0.08465–$0.08527, this region is expected to act as strong resistance.
In that scenario, traders can look for short-selling opportunities from the HTF supply zone, targeting a move back toward the $0.07708–$0.07648 demand z
FFUSDT Forming Falling WedgeFFUSDT is forming a clear falling wedge pattern, a classic bullish reversal signal that often indicates an upcoming breakout. The price has been consolidating within a narrowing range, suggesting that selling pressure is weakening while buyers are beginning to regain control. With consistent volume confirming accumulation at lower levels, the setup hints at a potential bullish breakout soon. The projected move could lead to an impressive gain of around 90% to 100% once the price breaks above the
FF looks Bearish (4H)It appears that we have an ABC pattern in which wave B formed a triangle, and the final leg of this triangle | wave e of B | has now completed. The price is entering a larger wave C, which is a bearish wave.
A 4-hour candle closing above the invalidation level will invalidate this analysis.
The targets are marked on the chart. These targets are for taking profit. Price can even move beyond the green zone, but since this is a volatile and newly listed coin, it’s better to take profit at each le
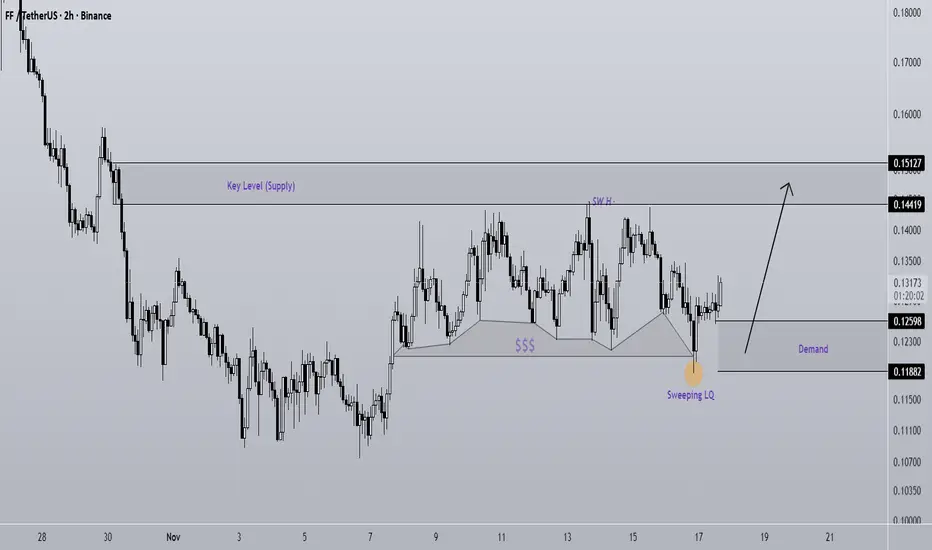
FF Looks Bullish (2H)FFUSDT has been ranging within a zone for a while, taking out both buyers’ and sellers’ stop-losses. After creating a large liquidity pool at the bottom and sweeping that lower pool, it now appears ready to move toward the key level.
On this timeframe, we have a bullish outlook on the FFUSDT pair.
Do not enter the position without capital management and stop setting
Comment if you have any questions
thank you
FFUSDT Forming Bullish WaveFFUSDT is currently displaying a bullish wave pattern, indicating a potential continuation of its upward momentum. This technical formation often appears when a cryptocurrency consolidates after an accumulation phase, setting the stage for a significant move higher. The good trading volume confirms growing market participation, which strengthens the bullish setup and signals that investors are actively positioning for the next major breakout. The overall price structure suggests that FFUSDT coul
FFUSDT UPDATE#FF
UPDATE
FF Technical Setup
Pattern: Symmetrical triangle breakout
Current Price: $0.157
Target Price: $0.215
Target % Gain: 155.46%
NYSE:FF has broken out of a symmetrical triangle pattern on the 4H timeframe, signaling a potential bullish continuation. With the current price at $0.157, the projected target stands at $0.215 — representing a 155% upside move. Momentum looks strong following the breakout, suggesting a possible trend expansion.
Time Frame: 4H
Risk Management Tip: Always use
FF/USDT – Stabilizing After 70% Drop, Base Formation Signals RecAfter a sharp 70% decline from its listing highs, FF is finally showing signs of stabilization and base formation. Price action has started to consolidate within a well-defined support zone, suggesting that sellers are exhausted and buyers are gradually stepping in to accumulate.