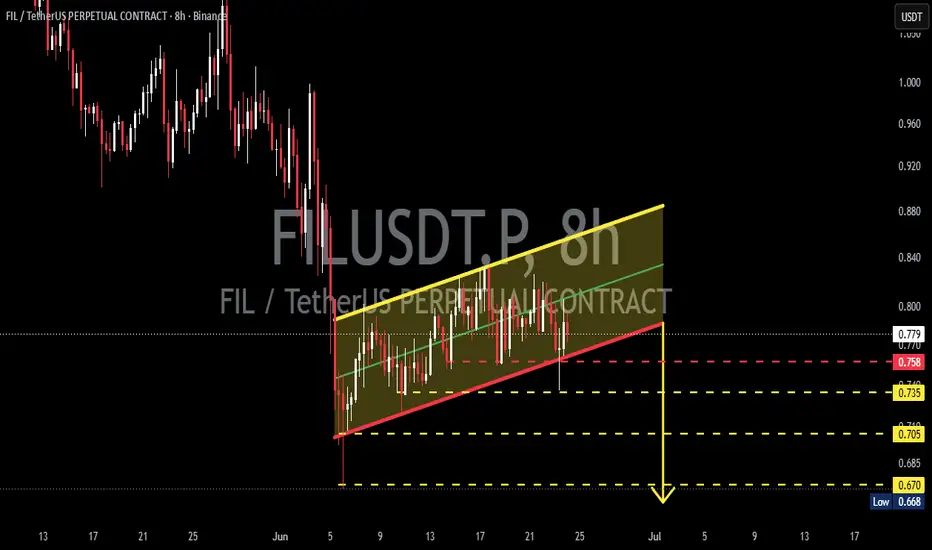
FILUSDT LONGInstructions:
Entry point: yellow
Stop loss: red
Take profit: green
👉Leverage x 5-10-20 for crypto
👉Leverage x 20-50-100 for commodities, stocks, indices, and forex
👉Margin 1-5% max.
Always practice risk and money management.
Invest a maximum of 5% on any trade or across all your trades.
Invest on
FILUSDT Bear Flag Alert – Is Another Sell-Off Coming?📊🔎 Technical Analysis
💵 Coin: LSE:FIL #FILUSDT
⏳ Time Frame: 1D
📉 Pattern: Bear Flag 🚩
🎯 Bias: Bearish Continuation 🐻
---
📖🧠 Pattern Explanation
🚩 The chart is currently forming a Bear Flag, which is one of the most well-known bearish continuation patterns in technical analysis.
📉 The shar
#FILUSDT Ready for a Breakout? Analysis of a Long Accumulatio#FIL
The price is moving within a descending channel on the 1-hour timeframe and has reached the lower boundary. It is now poised for a bounce and is expected to retest this boundary.
The Relative Strength Index (RSI) indicates a downward trend, which is likely to continue given the overbought con
FIL: local squeeze with $0.95 destinationThe Macro Picture 🗺️
FIL unwound its May $1.33 spike through a sharp descent, and the selling bottomed at $0.68 in early June. Since then, price has settled into a broad $0.68–0.85 base — a volatility playground where the lows keep getting bought and the rallies faded back toward the middle. Price
FIL/USDT_30-Day Accumlation Box-Brekout Watch👋 Hey everyone! Hope you're all having a great day. Let's dive into today's analysis.
Quick intro: Filecoin (FIL) is a decentralized storage network — think of it as a peer-to-peer alternative to AWS or Google Cloud, where users pay FIL tokens to store data and storage providers earn FIL for offeri
FIL: bullish spike toward $0.80The Macro Picture 🗺️
FIL spent late June carving a base against the $0.70 macro floor, wicking into it twice and refusing to break — the kind of repeated defense that sparks powerful reversals once sellers exhaust. Price has now torn back to $0.76 with RSI driving up through its midline toward 60,
FILUSD will touch 0.80$ ??LSE:FIL Update
FIL is still trading below the falling trendline. Buyers are showing up, but the breakout hasn't happened yet.We've seen a few bullish CHoCH/BOS signals on the lower timeframes, and price is holding above the short-term MAs. That's a good start, but I still want confirmation before
FIL: Bearish spike toward $0.67The Macro Picture 🗺️
FIL has been carving a descending structure since the $1.32 structural peak in early May, a sequence of lower highs that demands deeper corrections before any continuation. Price has since been pinned inside a tightening range between the $0.83 local high and the $0.67 macro s
FILUSDT - Bear Flag, Breakdown or Major Reversal?The FILUSDT chart currently shows price action moving within a Bear Flag Pattern 🚩, a bearish continuation pattern that forms after a strong decline (flagpole 📉), followed by an upward-sloping consolidation channel 📈.
From a technical perspective, this pattern remains bearish 🐻 unless price can bre
See all ideas
Summarizing what the indicators are suggesting.
Oscillators
Neutral
SellBuy
Strong sellStrong buy
Strong sellSellNeutralBuyStrong buy
Oscillators
Neutral
SellBuy
Strong sellStrong buy
Strong sellSellNeutralBuyStrong buy
Summary
Neutral
SellBuy
Strong sellStrong buy
Strong sellSellNeutralBuyStrong buy
Summary
Neutral
SellBuy
Strong sellStrong buy
Strong sellSellNeutralBuyStrong buy
Summary
Neutral
SellBuy
Strong sellStrong buy
Strong sellSellNeutralBuyStrong buy
Moving Averages
Neutral
SellBuy
Strong sellStrong buy
Strong sellSellNeutralBuyStrong buy
Moving Averages
Neutral
SellBuy
Strong sellStrong buy
Strong sellSellNeutralBuyStrong buy
Displays a symbol's price movements over previous years to identify recurring trends.