Will FLOKI start a major bullish wave soon? (4H)From the point where we placed the green arrow on the chart, a new bullish phase appears to have started. Based on the current structure, price is now in the early stages of Wave C, which is expected to be a bullish wave and could lead to further upside if the structure continues to develop as expected.
We are currently monitoring the price action closely for a potential pullback. If price retraces into the green zone, this area could provide an interesting opportunity to look for Buy/Long posi
In-depth trading ideas
FLOKIUSDT Bullish Reversal: ABC Correction at Key SupportYello Paradisers! could #FLOKI be preparing for a powerful bullish continuation while most traders are still focused on the previous downtrend?We are currently seeing a high-probability long setup developing on #FLOKI, supported by Dow Theory, price action, market structure, and RSI divergence.
💎#FLOKI, according to Dow Theory, had been forming a clear sequence of lower lows, confirming bearish structure. However, around the most recent low, something important started to change.
💎Selling pres
FLOKI can keep the last support or......Not just FLOKI, but around 80% of the top 100 coins are in the exact same situation right now. They’ve lost their Fibonacci supports one by one and are now getting close to their last support level. If they can hold it, that’s a good sign, and this drop could become a strong push for the next move up. But if they lose it, I think they could fall even further than their previous lows.
The other important technical levels are also clearly visible on the chart.
FLOKI/USDT (1h) Testing a Breakout From a Rising WedgeFLOKI/USDT is consolidating inside a rising wedge on the 1H chart after a strong impulsive move higher. Price continues to form higher lows while gradually pressing against the upper resistance around $0.0000310–$0.0000312.
A confirmed breakout and hold above the upper trendline could trigger a bullish continuation toward the $0.0000355–$0.0000365 target area.
A rejection from resistance followed by a breakdown below the rising support would weaken the bullish setup and increase the probabilit
FLOKI ForecastEntry Rationale of BINANCE:FLOKIUSDT
The main reason behind this trade idea is the higher-timeframe structure. We are currently seeing a slow, corrective bearish trend.
However, the smaller bearish legs are still showing strong momentum, while the bullish legs remain relatively slow and weak. This suggests that we may see at least one more bearish leg before the corrective structure is completed.
Keep in mind that this setup is based on a limit order , so there is no trigger condition for t
FLOKI – Correction Before the Next Move?FLOKI recently bounced strongly from the demand zone and is now entering a correction phase after its latest bullish impulse.
The key area to watch is the intersection between:
1️⃣ The 0.618 Fibonacci retracement
2️⃣ The blue demand zone
📌 As FLOKI approaches this area, we will be looking for long setups, anticipating a potential rejection and another bullish impulse.
If buyers step in from this confluence, the next major level to watch will be the 0.00003000 resistance.
For now, patience.
FLOKI Final Resistance Before a Potential Bullish Breakout?📊 Technical Analysis — CRYPTOCAP:FLOKI
⏳ Time Frame: 3D
📐 Pattern: Descending Channel 📉
💰 Current Price on Chart: around $0.00002626
---
📐📉 PATTERN — DESCENDING CHANNEL 🔻
FLOKI is still moving within a long-term Descending Channel 📉 formed by two downward-sloping trendlines:
🔴 Upper Trendline: acts as dynamic resistance 🧱 and has repeatedly pushed price downward.
🟡 Lower Trendline: acts as dynamic support 🛡️ and serves as a reaction area for buyers when selling pressure increases.
🟢 Mi
FLOKI at macro floor: base recovery toward $0.00002399The Macro Picture 🗺️
FLOKI ground down from the $0.00003834 macro ceiling all the way to the $0.00001988 macro floor and has flattened onto it at $0.00002020. The long, steady bleed has given way to a base right on support — exhaustion rather than continuation.
The Setup ⚙️
The Accumulation Zone 🟢
$0.00001801–0.00001988 is where the selling has dried up. Macro Support has held on retest, with the $0.00001801 Local Low as the deeper backstop — this is the demand base a recovery would build from
FLOKI: liquidity sweep before the next leg downThe Macro Picture 🗺️
FLOKI has been carving a descending structure since the May $0.0000380 peak, printing a clean sequence of lower highs and lower lows. Every rally has been sold — the bounce to $0.0000270 in early July was the latest lower high, and it was faded before price rolled back over. This is a market defined by persistent supply, where each recovery becomes fuel for the next flush. Price now grinds near $0.0000230, just above the $0.0000215 lows with RSI stuck below its average arou
FLOKIUSDT 4H – Bullish Recovery SetupAfter a prolonged downtrend, FLOKI is showing signs of accumulation and a potential trend reversal.
My outlook:
Buyers are defending the current support zone.
RSI is recovering above the midline, indicating improving momentum.
If price holds above the current level, I expect a move toward the next resistance area.
🎯 Potential Target: 0.00002800
⚠️ Invalidation: A break below the highlighted support would invalidate this bullish setup.
This is a swing trade idea with a favorable risk-to-rewar
FLOKI/USDT — Bear Flag, Breakdown or Reversal Ahead?On the 8-hour timeframe, FLOKI/USDT remains in a clear downtrend structure after experiencing a significant decline from its recent highs. Price is currently moving within a 🐻 Bear Flag Pattern, a bearish continuation pattern that forms after a strong downward impulse (flagpole) followed by an upward-sloping consolidation channel (flag).
From a technical perspective, the recent upward movement may simply represent a temporary retracement before the larger downtrend resumes, as long as price rem
Floki Inu, Bitcoin, Ethereum & The Altcoins MarketWe've been looking at Bitcoin, Ethereum and many of the smaller altcoins. Just yesterday doubt was still lingering in the Crypto-atmosphere, just yesterday the market was still uncertain about support.
This is normal and understandable. Bitcoin hit bottom at $60,000 6-June. Today, no more doubt and I can see, feel and experience the FOMO; I can tell by the numbers of messages I get. So people are preparing now for the next bullish wave.
It was honest doubt though, today no more.
Bitcoin moved
FLOKI is starting a bullish wave! (3D)First of all, pay attention to the timeframe; this is a 3-day chart, so reaching the targets will require patience
From the point marked by the red arrow on the chart, FLOKI has entered a larger-degree corrective phase.
This structure appears to be a Diametric pattern, and we are currently seeing the conclusion of Wave E, which is a bearish leg
Trading Strategy:Entry Zone: If a pullback occurs into the highlighted green zone, we will look for Buy/Long opportunities.
Execution: It is recommen
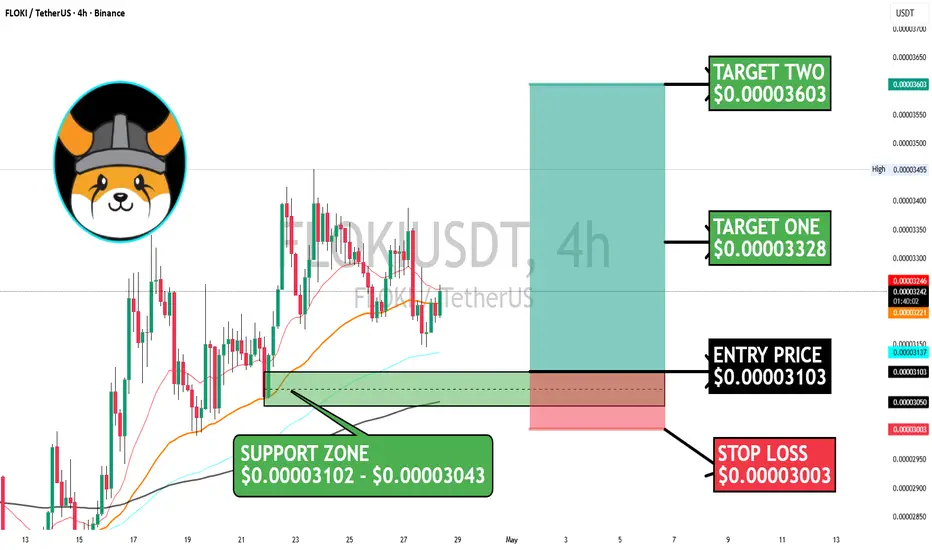
$FLOKI ready to move.????BINANCE:FLOKIUSDT on the 4H timeframe is showing a solid reaction from a well-defined demand zone, and the overall structure is leaning bullish as long as support holds.
Price recently pulled back into the key support zone at $0.00003102 – $0.00003043, which aligns with prior consolidation and dynamic support (moving averages).
We’re now seeing buyers step in again from this area — a sign that demand is still active.
The market structure hasn’t broken down, and price is attempting to build
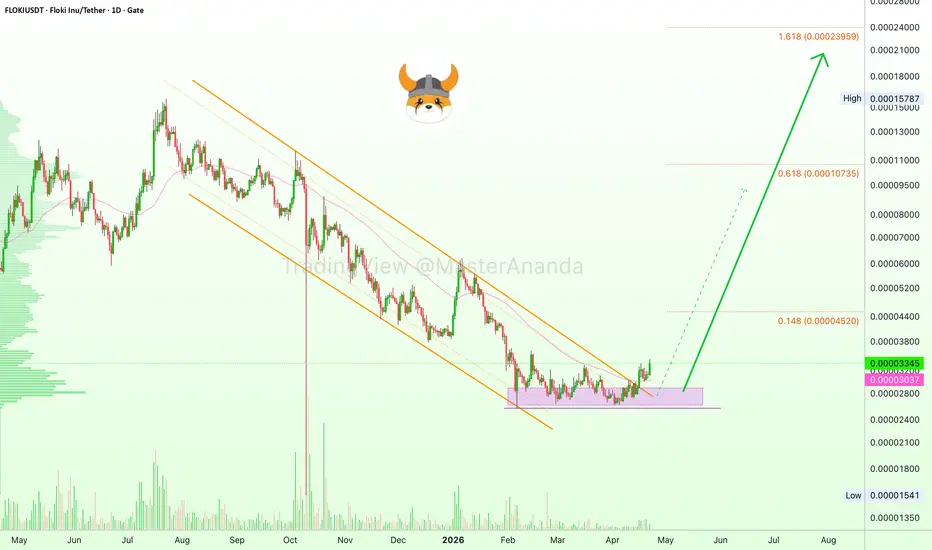
Floki Inu confirms bullish bias —Everything growsThis orange descending channel here is a very clear chart pattern. Even if you don't believe in technical analysis or don't understand it, your eyes would still be able to see the lines and how the candles were respecting those lines for quite a long time.
Floki Inu (FLOKIUSDT) broke out of this channel signaling the end to the downtrend period. No more down. It broke to the side.
Notice here the EMA55 signal. The other two projects, DOGE and SOL, were moving above this level this same day. FL
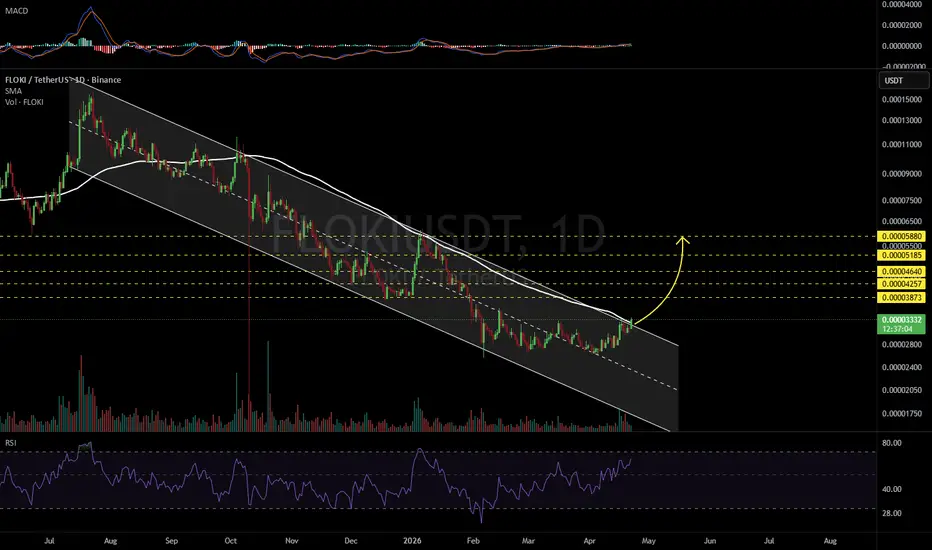
FLOKIUSDT 1D#FLOKI is breaking out above the descending channel and the SMA100 on the daily chart, but the daily candle has not closed yet. If the daily candle closes above these levels, the potential upside targets are:
🎯 $0.00003873
🎯 $0.00004257
🎯 $0.00004640
🎯 $0.00005185
🎯 $0.00005880
⚠️ Always remember to use a tight stop-loss and maintain proper risk management.
FLOKI/USDT Descending Channel – Reversal Potential or Fakeout?On the 1D timeframe, FLOKI/USDT is clearly moving within a Descending Channel (Bearish Channel) formed after the previous peak. This structure is characterized by:
Lower Highs & Lower Lows (downtrend structure)
Channel boundaries:
Upper resistance trendline (red)
Lower support trendline (yellow)
Currently, price is testing the channel resistance, which is a crucial area that will determine the next direction.
---
📐 Pattern Explanation: Descending Channel
A Descending Channel is typica
Will FLOKI Bounce from hereFLOKIusdt exhibiting a strong breakdown with bearish flag formation. The breakdown has achieved the flag pole target which suggest a potential bottom been achieved.
We can believe price has now dropped into a clear Accumulation Zone above the Main Bottom at 0.00001553. The immediate resistance area to pay attention to is the Sell-off Zone near 0.00009803. A break above this level would signal the first real bullish shift.
What’s your target for FLOKI? Drop your thoughts.
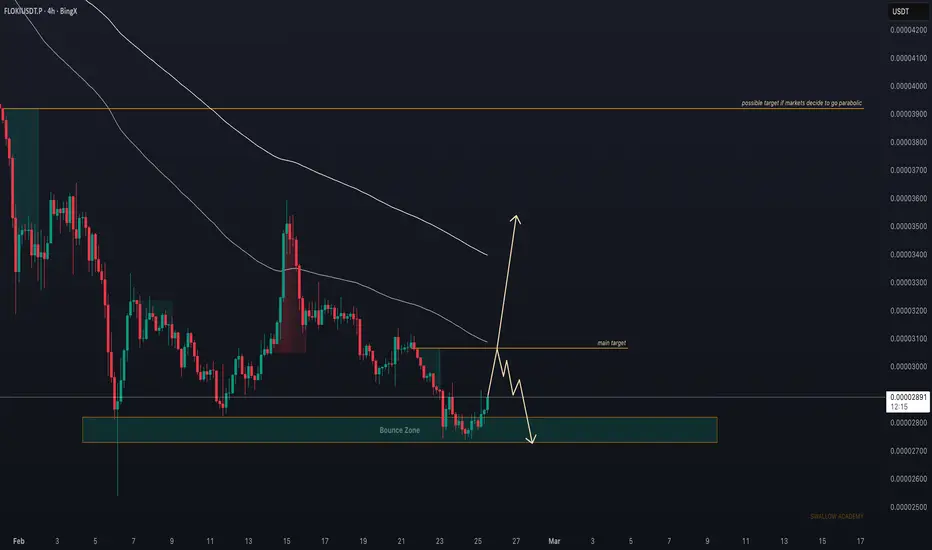
Floki (FLOKI): Good Bounce Happened | Targeting CME GapFLOKI looks healthy for a smaller upside move here toward the bullish CME gap that was formed during the weekend.
If momentum continues, that is the target we are looking for. So we are going long and keeping this game plan active as long as price stays above the bounce zone. If this zone is lost, we will likely see further downside.
And if momentum is very strong, we might even fill the bigger CME — but that is not our main target for now.
Swallow Academy
Floki (FLOKI): Risk:Reward Ratio is Too Good Not To Long | BUYFLOKI is sitting right near the local support zone, which can turn into a bounce area. So far buyers are keeping this level clean and holding it strongly. I would say the R:R is too good not to try a long here, so that’s exactly what we will be doing.
Swallow Academy
Floki (FLOKI): Trend Shift Happened | Expecting +45% After BreakFLOKI showed a solid break above the EMAs followed by a clean re-test, which confirms buyers stepping in. Price is now holding above that EMA zone and slowly building pressure toward local resistance. If buyers keep control here, we should see a push into the next resistance area, with higher targets opening up once that level is broken.
Swallow Academy