FLOKI: liquidity sweep before the next leg downThe Macro Picture 🗺️
FLOKI has been carving a descending structure since the May $0.0000380 peak, printing a clean sequence of lower highs and lower lows. Every rally has been sold — the bounce to $0.0000270 in early July was the latest lower high, and it was faded before price rolled back over. This is a market defined by persistent supply, where each recovery becomes fuel for the next flush. Price now grinds near $0.0000230, just above the $0.0000215 lows with RSI stuck below its average around 44, and the path of least resistance still points down toward the liquidity pooling beneath the range.
The Setup ⚙️
The Ceiling: The $0.0000270 decision line is where bears are defending. As marked by the red projection, this former support flipped into resistance and rejected the last attempt to recover.
The Rejection: Above sits the $0.0000270–0.00003 supply block. Price would need to reclaim this entire band to neutralize the downtrend, and momentum offers no support for that case yet.
The Trigger: A break below the $0.0000215 lows would clear out over-leveraged longs stacked at support and open the path of least resistance toward the $0.00002 macro floor.
The Roadmap: Primary target sits at $0.00002 — the red projection points there as the natural draw on liquidity below the range. Invalidation: a sustained 4H close back above $0.0000270 would invalidate this bearish thesis and signal a structural reset in favor of the bulls.
More setups in profile.
#FLOKI #CRYPTO #Memecoins #Altcoins #TechnicalAnalysis
In-depth trading ideas
FLOKIUSDT 4H – Bullish Recovery SetupAfter a prolonged downtrend, FLOKI is showing signs of accumulation and a potential trend reversal.
My outlook:
Buyers are defending the current support zone.
RSI is recovering above the midline, indicating improving momentum.
If price holds above the current level, I expect a move toward the next resistance area.
🎯 Potential Target: 0.00002800
⚠️ Invalidation: A break below the highlighted support would invalidate this bullish setup.
This is a swing trade idea with a favorable risk-to-reward ratio.
What do you think? Bullish or bearish?
Not financial advice.
FLOKI/USDT — Bear Flag, Breakdown or Reversal Ahead?On the 8-hour timeframe, FLOKI/USDT remains in a clear downtrend structure after experiencing a significant decline from its recent highs. Price is currently moving within a 🐻 Bear Flag Pattern, a bearish continuation pattern that forms after a strong downward impulse (flagpole) followed by an upward-sloping consolidation channel (flag).
From a technical perspective, the recent upward movement may simply represent a temporary retracement before the larger downtrend resumes, as long as price remains below the upper boundary of the channel.
---
🐻 Bear Flag Pattern
🔍 Pattern Characteristics
✅ Formed after a strong bearish impulse (flagpole)
✅ Price then develops a relatively narrow ascending channel
✅ Volume typically decreases during the flag formation
✅ A breakdown below channel support confirms bearish continuation
📌 On This Chart
✔️ The flagpole was established during the sharp decline in early June.
✔️ The ascending flag channel is defined by:
🔴 Red Support Trendline
🟡 Yellow Resistance Trendline
✔️ Price is currently trading very close to the channel support.
⚠️ This makes the current area a key decision zone for the next major move.
---
🐂 Bullish Scenario
The bullish case will only gain validation if buyers successfully defend channel support and push price above the Bear Flag resistance.
🎯 Bullish Targets
🥇 Mid-channel resistance around 0.00002750
🥈 Upper channel resistance around 0.00003000
🚀 If a valid breakout occurs:
➡️ Potential move toward 0.00003200
➡️ Potential move toward 0.00003400
✅ Bullish Confirmation
✔️ An 8H candle closes above channel resistance
✔️ Resistance flips into support after a successful retest
✔️ Increasing volume during the breakout
📈 As long as the red trendline support remains intact, a relief rally remains possible.
---
🐻 Bearish Scenario (Primary Scenario)
The overall market structure still favors the bearish outlook, as the larger trend remains downward.
If the red support trendline is broken:
🎯 Bearish Targets
🔻 Support 1: 0.00002460
🔻 Support 2: 0.00002385
🔻 Support 3: 0.00002310
🎯 Major Support: 0.00002200
The 0.00002200 level represents the primary Bear Flag target and aligns with the projected downside move shown on the chart.
✅ Bearish Confirmation
✔️ Breakdown below channel support
✔️ An 8H candle closes below the red trendline
✔️ Failed retest back into the channel
✔️ Increasing selling pressure
📉 If the 0.00002200 support fails to hold, FLOKI could enter a deeper distribution phase and extend its decline further.
---
🔍 Conclusion
FLOKI/USDT appears to be in the final stages of forming a 🐻 Bear Flag Pattern on the 8-hour timeframe.
Current price action suggests that channel support is being tested, making this one of the most important areas for determining the next directional move.
📌 As long as price remains inside the channel, consolidation is still in progress.
📌 A breakout above the channel could trigger a recovery toward the 0.00003000 region.
📌 A breakdown below channel support would confirm the Bear Flag and potentially send price toward 0.00002200, the primary downside target.
⚖️ At the moment, probabilities still slightly favor the sellers, as the broader trend remains bearish and the current structure represents a classic bearish continuation pattern.
---
⚠️ Disclaimer
📚 This analysis is for educational purposes only and should not be considered financial advice.
🛡️ Always practice proper risk management.
⏳ Wait for confirmation before making any trading decisions.
#FLOKI #FLOKIUSDT #BearFlag #CryptoAnalysis #TechnicalAnalysis #TradingView #Altcoins #CryptoTrading #PriceAction #ChartPattern #BearishContinuation #SupportAndResistance #TrendAnalysis #CryptoMarket
Floki Inu, Bitcoin, Ethereum & The Altcoins MarketWe've been looking at Bitcoin, Ethereum and many of the smaller altcoins. Just yesterday doubt was still lingering in the Crypto-atmosphere, just yesterday the market was still uncertain about support.
This is normal and understandable. Bitcoin hit bottom at $60,000 6-June. Today, no more doubt and I can see, feel and experience the FOMO; I can tell by the numbers of messages I get. So people are preparing now for the next bullish wave.
It was honest doubt though, today no more.
Bitcoin moved below the April 2025 low to hit $60,000. The recent drop resulted in a double-bottom because the action was happening already below the April low.
Ethereum on the other hand remained above the April 2025 low in early February. For this reason, the recent drop produced a lower low, compared to February, but still a higher low vs April 2025. Now the stage is all set.
I love it because people know. In a day, everything changes.
Summary: Bitcoin is going up, Ethereum is going up and the altcoins market is going up. We saw a correction lasting one month and now we get a bullish resumption, or initial bullish breakout, or recovery; it depends. It depends on the trading pair in question because each one is in a different situation.
The general market bias is bullish so many projects will grow. The top performers will only be a few. Some will move first. Others will stay behind and never move. You know how it goes—choose wisely.
FLOKIUSDT (Floki Inu) is one of those that will move first. The chart is hyper-bullish; the stochastic supports massive growth.
I will show you many more projects of course.
Remember, months of sustained bullish action. 90 days bullish (6-Feb through 6-May) vs 30 days bearish (6-May through 6-June). Now we get 90-120 days bullish vs...
Who cares... We have so much time for bullish action that we will adapt by taking profits at the top of the bullish wave. The time to buy is now—you've been warned.
Thank you for reading.
Namaste.
flokiusdt longInstructions:
Entry point: yellow
Stop loss: red
Take profit: green
👉Leverage x 5-10-20 for crypto
👉Leverage x 20-50-100 for commodities, stocks, indices, and forex
👉Margin 1-5% max.
Always practice risk and money management.
Invest a maximum of 5% on any trade or across all your trades.
Invest only what you can afford to lose, as no one is in control of the market.
👉Our analyses are primarily based on:
breakouts: two trend lines (ascending and descending) and a line indicating a horizontal breakout.
chart patterns: shoulders and head, triangle parttern, elliott impulse, etc etc.
We don't always have the time to track them at all times or to represent them visibly, given the numerous signals, the number of channels to manage, and especially because of the often rapid pace of market movements.
indicators: We associate at least two indicators with this technique.
👉Depending on the circumstances, we use specific indicators, often setting 3 or more take profit levels.
👉Indeed, there are good days in trading and also bad days. No one can promise to win every trade, and like all traders worldwide, we also experience stop-loss orders. However, we win more than we lose and remain positive.
👉You can close the position before or after the take profit orders indicated by the green lines if you are personally satisfied; the same applies to stop loss orders.
👉We must stay positive, clear-headed, and humble.
we cannot provide all instructions or all trades here on this channel.
Good luck to us all, and may God guide us. Amen.
flokiusdt shortInstructions:
Entry point: yellow
Stop loss: red
Take profit: green
👉Leverage x 5-10-20 for crypto
👉Leverage x 20-50-100 for commodities, stocks, indices, and forex
👉Margin 1-5% max.
Always practice risk and money management.
Invest a maximum of 5% on any trade or across all your trades.
Invest only what you can afford to lose, as no one is in control of the market.
👉Our analyses are primarily based on:
breakouts: two trend lines (ascending and descending) and a line indicating a horizontal breakout.
chart patterns: shoulders and head, triangle parttern, elliott impulse, etc etc.
We don't always have the time to track them at all times or to represent them visibly, given the numerous signals, the number of channels to manage, and especially because of the often rapid pace of market movements.
indicators: We associate at least two indicators with this technique.
👉Depending on the circumstances, we use specific indicators, often setting 3 or more take profit levels.
👉Indeed, there are good days in trading and also bad days. No one can promise to win every trade, and like all traders worldwide, we also experience stop-loss orders. However, we win more than we lose and remain positive.
👉You can close the position before or after the take profit orders indicated by the green lines if you are personally satisfied; the same applies to stop loss orders.
👉We must stay positive, clear-headed, and humble.
we cannot provide all instructions or all trades here on this channel.
Good luck to us all, and may God guide us. Amen.
FLOKI is starting a bullish wave! (3D)First of all, pay attention to the timeframe; this is a 3-day chart, so reaching the targets will require patience
From the point marked by the red arrow on the chart, FLOKI has entered a larger-degree corrective phase.
This structure appears to be a Diametric pattern, and we are currently seeing the conclusion of Wave E, which is a bearish leg
Trading Strategy:Entry Zone: If a pullback occurs into the highlighted green zone, we will look for Buy/Long opportunities.
Execution: It is recommended to enter using a DCA (Dollar Cost Averaging) approach within the green box to optimize the entry price.
Targets: Profit targets are clearly marked on the chart.
Risk Management: Move your stop loss to Break-even (BE) once the first target is hit.
⚠️ Invalidation Level:The analysis remains valid as long as the price holds above the specified invalidation level. A daily candle close below this level will void the setup.
If you have a coin or altcoin you want analyzed, first hit the like button and then comment its name so I can review it for you.
Do you also think FLOKIE is bullish?
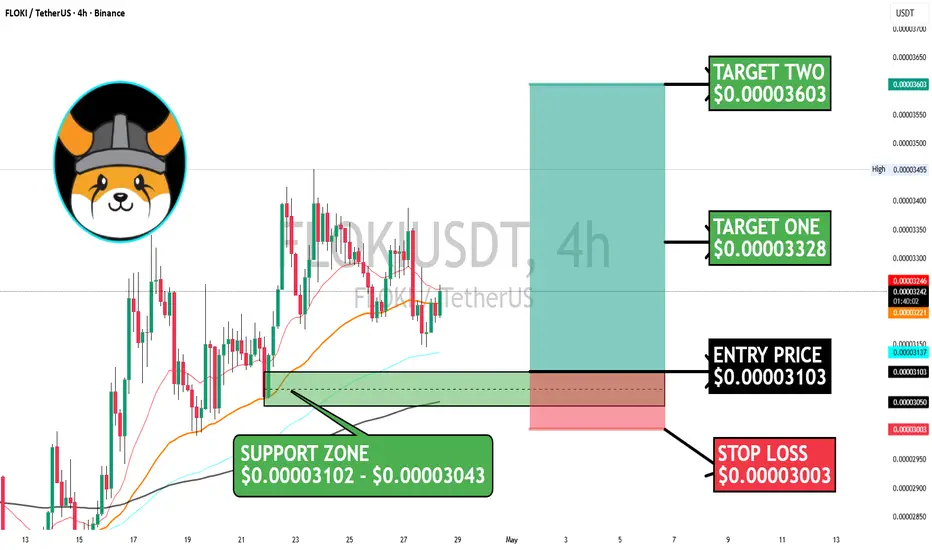
$FLOKI ready to move.????BINANCE:FLOKIUSDT on the 4H timeframe is showing a solid reaction from a well-defined demand zone, and the overall structure is leaning bullish as long as support holds.
Price recently pulled back into the key support zone at $0.00003102 – $0.00003043, which aligns with prior consolidation and dynamic support (moving averages).
We’re now seeing buyers step in again from this area — a sign that demand is still active.
The market structure hasn’t broken down, and price is attempting to build a higher low here. If momentum continues, this could fuel the next leg up.
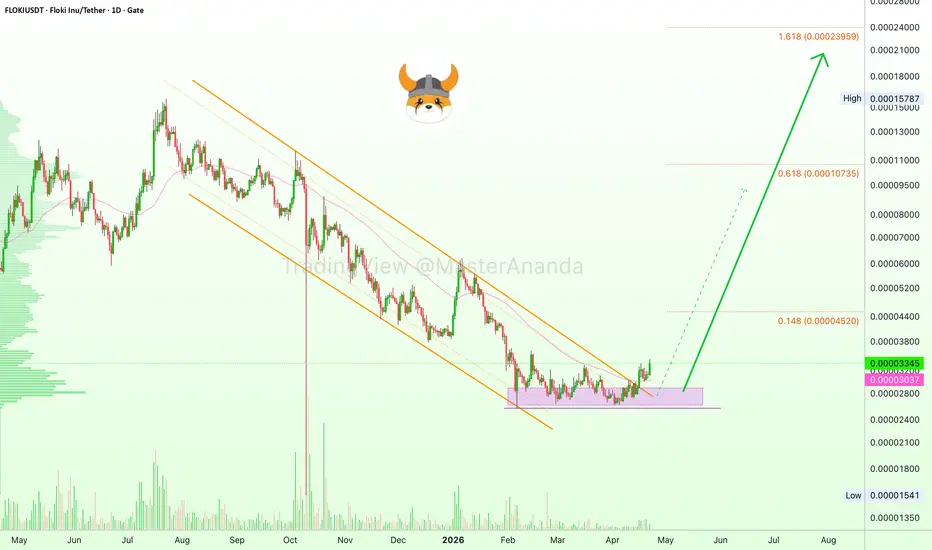
Floki Inu confirms bullish bias —Everything growsThis orange descending channel here is a very clear chart pattern. Even if you don't believe in technical analysis or don't understand it, your eyes would still be able to see the lines and how the candles were respecting those lines for quite a long time.
Floki Inu (FLOKIUSDT) broke out of this channel signaling the end to the downtrend period. No more down. It broke to the side.
Notice here the EMA55 signal. The other two projects, DOGE and SOL, were moving above this level this same day. FLOKI, a smaller altcoin, moved above it days ago. We can predict what will happen to the bigger projects by looking at the smaller ones.
Also notice how EMA55 is already starting to curve upward, it is very subtle but this is a strong confirmation. This level was not only conquered as resistance but also confirmed as support and will now try to follow FLOKIUSDT as it moves up. The bullish wave is now unavoidable.
The bullish wave can unravel fast or it can go for months. There is no need to think that it must end after several weeks, it can happen but it is not mandatory. "But, what about sell in May and go away?" That's conventional wisdom once more. It is like saying, "Bitcoin must crash because of war." The war never had any real negative effect on Bitcoin, in fact, Bitcoin started to rise more strongly the same day the war started in full force.
Crypto went through a massive bear market. We can see a bullish wave last one month or three months. There will always be corrections, retraces and pauses on the way up, but we should expect long-term growth.
The bear market started for most projects in March 2024, ending in March 2026 (or Feb). We can expect growth on those projects until March 2028 at the least. There will be strong variations of course. Many projects grew in 2025 and this would call for a different analysis. Each chart needs to be considered in isolation.
Apart from the strong variations, short-term, everything grows. The market moves in unison as one.
Namaste.
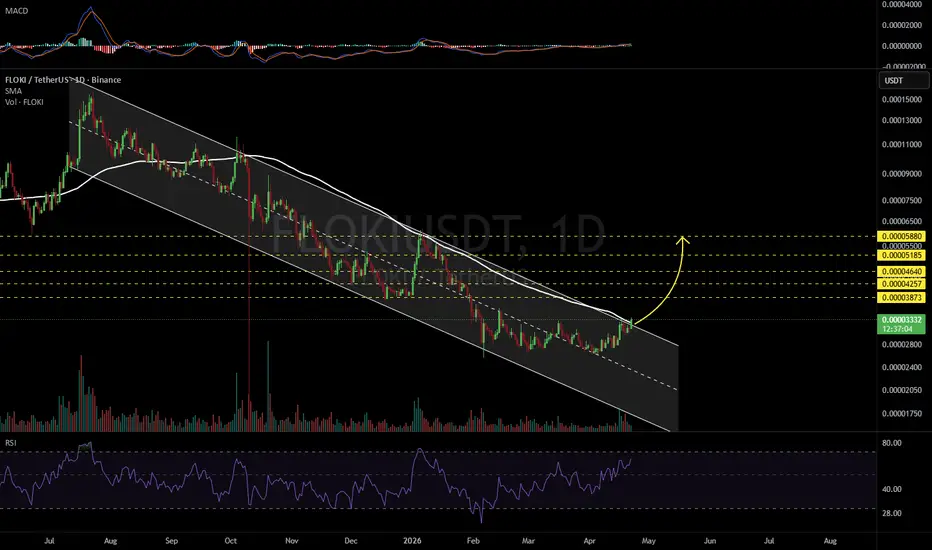
FLOKIUSDT 1D#FLOKI is breaking out above the descending channel and the SMA100 on the daily chart, but the daily candle has not closed yet. If the daily candle closes above these levels, the potential upside targets are:
🎯 $0.00003873
🎯 $0.00004257
🎯 $0.00004640
🎯 $0.00005185
🎯 $0.00005880
⚠️ Always remember to use a tight stop-loss and maintain proper risk management.
FLOKI/USDT Descending Channel – Reversal Potential or Fakeout?On the 1D timeframe, FLOKI/USDT is clearly moving within a Descending Channel (Bearish Channel) formed after the previous peak. This structure is characterized by:
Lower Highs & Lower Lows (downtrend structure)
Channel boundaries:
Upper resistance trendline (red)
Lower support trendline (yellow)
Currently, price is testing the channel resistance, which is a crucial area that will determine the next direction.
---
📐 Pattern Explanation: Descending Channel
A Descending Channel is typically a bearish continuation pattern, but it can also turn into a reversal pattern if a breakout to the upside occurs.
Key characteristics in this chart:
Price consistently reacts within the channel
Gradually decreasing momentum (consolidation phase)
Price is now testing resistance → potential breakout zone
---
🚀 Bullish Scenario
Bullish confirmation occurs if:
✅ Price breaks and closes above the channel resistance (red line)
✅ Supported by increasing volume (valid breakout)
✅ Successful retest turns resistance into support
Upside targets (based on horizontal levels):
0.0003550
0.0003920
0.0004240
0.0005070
0.0005500 – 0.0005800 (main target zone)
📈 This move could indicate a potential trend reversal after a prolonged downtrend.
---
📉 Bearish Scenario
Bearish continuation remains valid if:
❌ Price fails to break resistance and gets rejected
❌ Strong rejection appears (long wicks / bearish engulfing)
❌ Price falls back into the channel
Downside targets:
Mid-channel area
Lower channel support (yellow line)
Potential new lower low if breakdown occurs
⚠️ If the lower support breaks, the downtrend may continue further.
---
⚖️ Conclusion
Current price is at a key decision zone
Breakout = potential bullish reversal
Rejection = continuation of the downtrend
Wait for confirmation, avoid entering based on assumptions alone.
#FLOKI #FLOKIUSDT #CryptoAnalysis #TechnicalAnalysis #Altcoin #Breakout #DescendingChannel #BullishSetup #BearishScenario #CryptoTrading #SupportResistance #TrendReversal
Will FLOKI Bounce from hereFLOKIusdt exhibiting a strong breakdown with bearish flag formation. The breakdown has achieved the flag pole target which suggest a potential bottom been achieved.
We can believe price has now dropped into a clear Accumulation Zone above the Main Bottom at 0.00001553. The immediate resistance area to pay attention to is the Sell-off Zone near 0.00009803. A break above this level would signal the first real bullish shift.
What’s your target for FLOKI? Drop your thoughts.
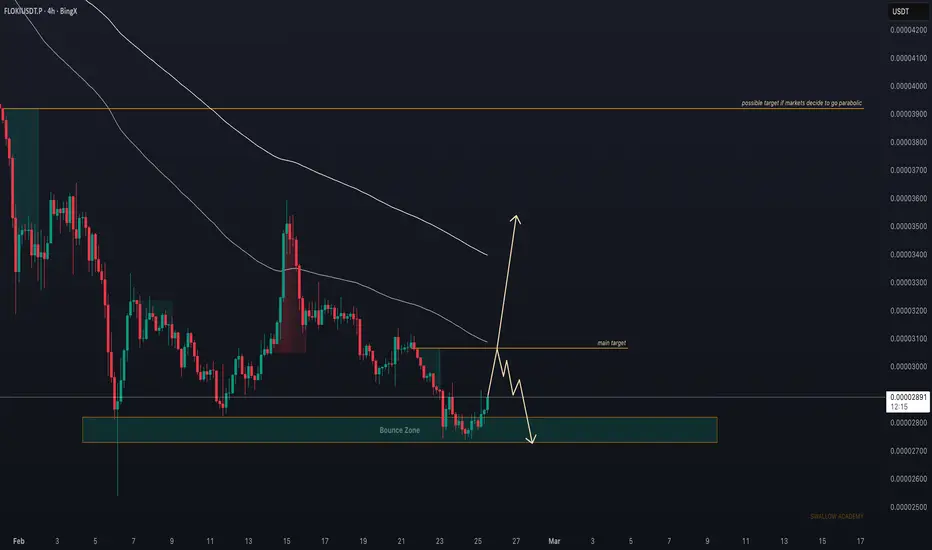
Floki (FLOKI): Good Bounce Happened | Targeting CME GapFLOKI looks healthy for a smaller upside move here toward the bullish CME gap that was formed during the weekend.
If momentum continues, that is the target we are looking for. So we are going long and keeping this game plan active as long as price stays above the bounce zone. If this zone is lost, we will likely see further downside.
And if momentum is very strong, we might even fill the bigger CME — but that is not our main target for now.
Swallow Academy
Floki (FLOKI): Risk:Reward Ratio is Too Good Not To Long | BUYFLOKI is sitting right near the local support zone, which can turn into a bounce area. So far buyers are keeping this level clean and holding it strongly. I would say the R:R is too good not to try a long here, so that’s exactly what we will be doing.
Swallow Academy
Floki (FLOKI): Trend Shift Happened | Expecting +45% After BreakFLOKI showed a solid break above the EMAs followed by a clean re-test, which confirms buyers stepping in. Price is now holding above that EMA zone and slowly building pressure toward local resistance. If buyers keep control here, we should see a push into the next resistance area, with higher targets opening up once that level is broken.
Swallow Academy
Floki (FLOKI): Buyers Showing Some Kind of Reaction Near SupportFLOKI is showing a decent reaction near the local support zone, which again confirms the validity of this area. As long as buyers keep holding this zone, the game plan stays the same.
If they manage to pull off a clean BOS from here, we’ll be looking for a long setup and aim for a retest of the 100 & 200 EMA. Until then, we just monitor how price behaves around this support and whether buyers can maintain control.
Swallow Academy
Floki (FLOKI): Waiting For Breakout from EMAsFLOKI is showing a clear turnover here — buyers are slowly switching the trend and testing the EMAs again. What we want to see now is a clean EMA reclaim; that would confirm buyers have proper control. If that happens, the next upside move could aim toward the liquidity zones above.
Good momentum building up here, just need that solid confirmation before the push.
Swallow Academy
FLOKIUSDT Forming Bullish MomentumFLOKIUSDT is forming a clear bullish momentum pattern, a classic bullish reversal signal that often indicates an upcoming breakout. The price has been consolidating within a narrowing range, suggesting that selling pressure is weakening while buyers are beginning to regain control. With consistent volume confirming accumulation at lower levels, the setup hints at a potential bullish breakout soon. The projected move could lead to an impressive gain of around 70% to 80% once the price breaks above the wedge resistance.
This bullish momentum pattern is typically seen at the end of downtrends or corrective phases, and it represents a potential shift in market sentiment from bearish to bullish. Traders closely watching FLOKIUSDT are noting the strengthening momentum as it nears a breakout zone. The good trading volume adds confidence to this pattern, showing that market participants are positioning early in anticipation of a reversal.
Investors’ growing interest in FLOKIUSDT reflects rising confidence in the project’s long-term fundamentals and current technical strength. If the breakout confirms with sustained volume, this could mark the start of a fresh bullish leg. Traders might find this a valuable setup for medium-term gains, especially as the pattern completes and buying momentum accelerates.
✅ Show your support by hitting the like button and
✅ Leaving a comment below! (What is your opinion about this Coin?)
Your feedback and engagement keep me inspired to share more insightful market analysis with you!
Floki coin (FLOKI): Looking For Good Bounce From HereFLOKI is still moving cleanly inside the ascending channel, with each touch on the trendline giving us a solid reaction. Once again, price is holding the lower trendline support, which has been tested multiple times and respected every single time.
As long as buyers hold this structure, the game will be to look for entry which would be ideal once we see MSB (market structure break) — we are looking for trend reversal to the upside. Our target is upper side of bullish channel, where we expect the next strong reaction.
Swallow Academy
FLOKI: meme season or exit liquidity? key levels for todayFLOKI
Is meme season really back or is this just exit liquidity in a dog mask? Recently FLOKI grabbed headlines again as market chatter about new integrations and listings picked up, and you can see how fast liquidity chased it up. Now the hype cooled off a bit and price is pulling back from that upper red supply zone on the 4H chart.
On the 4H, price rejected hard from the 0.000031–0.000032 area and is sliding toward the mid black band, while RSI rolled over from overbought. For me that screams “cooldown phase,” not full trend reversal yet. As long as buyers defend the first green demand block below, I lean to a corrective dip first, then another attempt higher as fresh news keeps meme money rotating in.
My plan: I’m watching for a sweep into the nearest green zone and a bounce with RSI curling up to take a speculative long, targeting a retest of the red zone above. If price slices clean through that green demand and closes 4H below it, I flip the script and look for deeper downside into the lower green box. I might be wrong, but chasing green candles up here feels like buying the top of the carnival ride 🚀