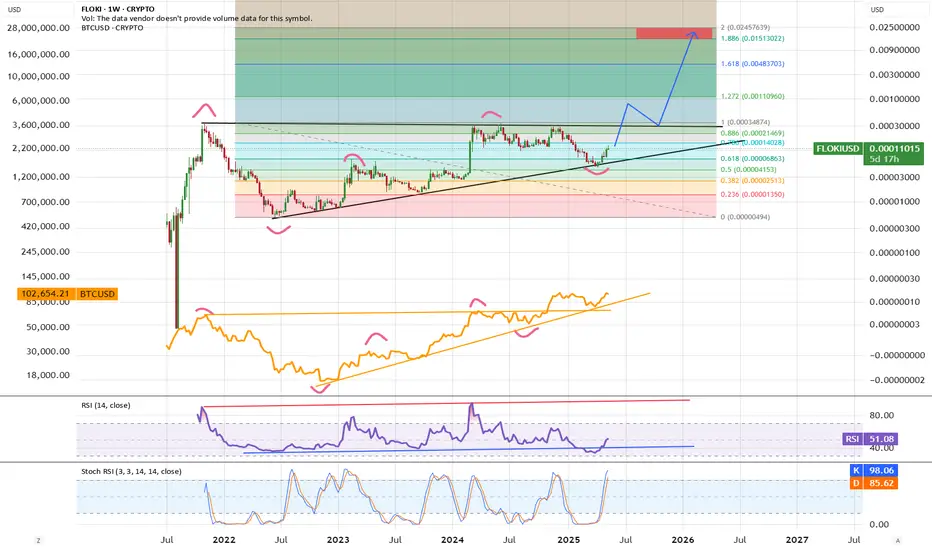
FLOKI / USD Weekly RSI BreakoutIn this chart, we are analyzing the long-term price action of FLOKI on a weekly timeframe. During a period of increasing market volatility and pessimism, the pure technical structures presented by the chart draw a very clear roadmap for us:
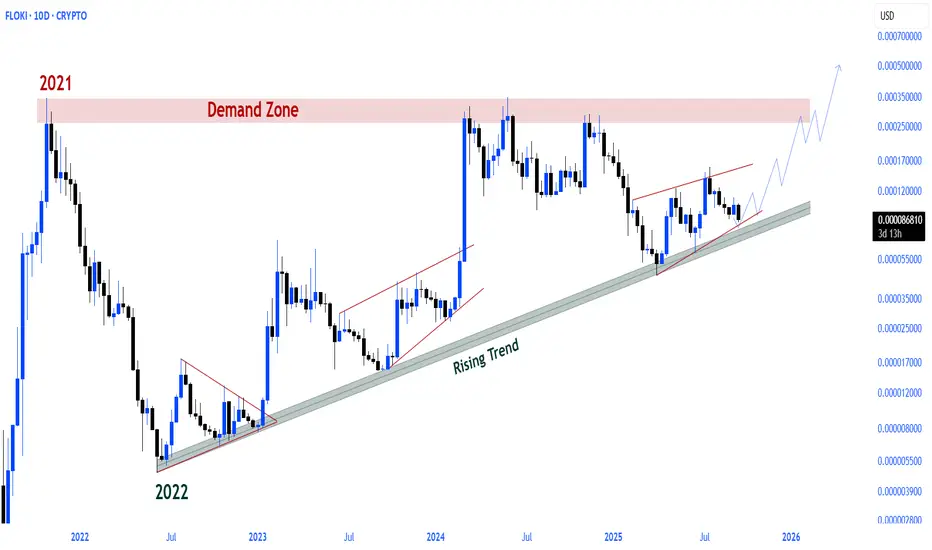
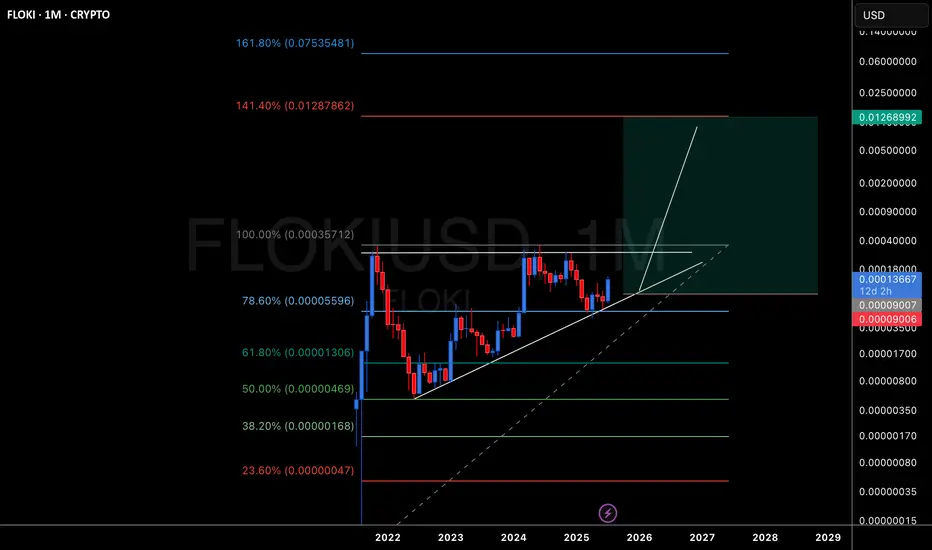
FLOKI has come back to its main trend support after a long corrective phase. On the chart, price is trying to hold above a long-term ascending support line that has been respected for years.
The ascending support line, which has formed the main backbone of
FLOKI / WBNB
No trades
No trades
In-depth trading ideas
Meme Coins Flying While You Celebrate New YearMeme coins absolutely flying - printing a bullish pivot exactly as the clock struck midnight at the turn of the year.
This is what crypto does - just as you're celebrating and drinks are popping, this market is also popping.
But relative to duration this is still quite early and is another aspect of the risk canon I described in a previous thread (see linked idea).
And that is - higher risk moves first.
Meme coins are highest risk (since they have 0 fundamentals) and so they move first.
And
Floki flowCurrent Market Activity
FLOKI is experiencing significant trading activity with a 24-hour trading volume of $92.3 million
1, representing a 25.60% increase from the previous day
1. The token is currently priced at $0.00004636
1.
Key Order Flow Indicators
Exchange Distribution: The highest volume is concentrated on major exchanges, with Binance leading at $13.9 million (15.08% of total volume)
$Floki Vikings are getting ready.Floki is positioned on the lower band of the major ascending channel on the 2W timeframe, a strong support line.
This same level overlaps the middle band of the descending channel, creating a technical double support area.
Retest period following the breakout observed on the RSI is nearing completion. This structure indicates that the overall upward trend remains valid and that the pair may be preparing for a new acceleration.
It's beneficial to focus on the bigger picture without being dist
Long Opportunity on FLOKI – Breakout Above Key SupportFLOKI has pushed above the 0.0001100 support zone and is showing strong bullish continuation signs. This sets up a long trade opportunity with clear levels.
Entry Zone: 0.0001095 – 0.0001100
Stop Loss: 0.0001082 (below support)
Target Zone: 0.0001244
Risk/Reward: ≈ 1:2
Why Long?
Break and retest above 0.0001100 confirms bullish control.
Strong upward momentum with higher lows building.
Buyers defending support, showing accumulation.
📊 Plan: As long as price stays above 0.0001100, I’m lo
$FLOKI BUY LIMIT SETUPAfter the previous rally (as predicted in my earlier chart), a correction is now unfolding—likely to sweep the uncleared liquidity below before the next impulsive move.
🔹 POI Entry Zone:
Buy Limit: $0.00006808
Stop Loss: $0.00005789
Target : $0.00028603 (Sell Order Block Zone)
Weekly structure remains bullish. Watching closely for price reaction from the POI demand zone before continuation to the sell-side order block.
And the 1W Chart is just for clarity sake.
#FLOKI #Memcoin
FLOKI - Oki Doki PumpJust one of many coins that I am picking in this area.
But these meme coins can have some pop - and so this is one I share with TradingView.
It had once nice push up (arrow) - signalling it has plenty of bullish potential.
The low time frame is choppy but the candles are both narrowing and shallowing -
I think this may be building pressure for a next wave up.
This analysis is shared for educational purposes only and does not constitute financial advice. Please conduct your own research bef
FLOKIUSDT Breaks Key Resistance – Bullish Continuation Ahead?BINANCE:FLOKIUSDT is trading inside its longest ascending triangle. The price has respected the triangle's support and bounced back. It has now broken a key resistance zone. As seen in the chart, every time the price breaks a major resistance, a bullish move follows, and we can expect a similar scenario this time.
SEED_DONKEYDAN_MARKET_CAP:FLOKI CRYPTO:FLOKIUSD
Cheers
Hexa🧘♀️
FLOKIUSD – Impulse and ReturnFloki launched into a sharp rally from below 0.00007200, peaking just shy of 0.00008100 before retracing. Despite the correction, the move set a new short-term high and shifted the structure bullish. Current action shows a clean pullback into a former breakout zone (~0.00007250), where price is beginning to base again. A reclaim of 0.00007450 opens the door for another impulsive move.
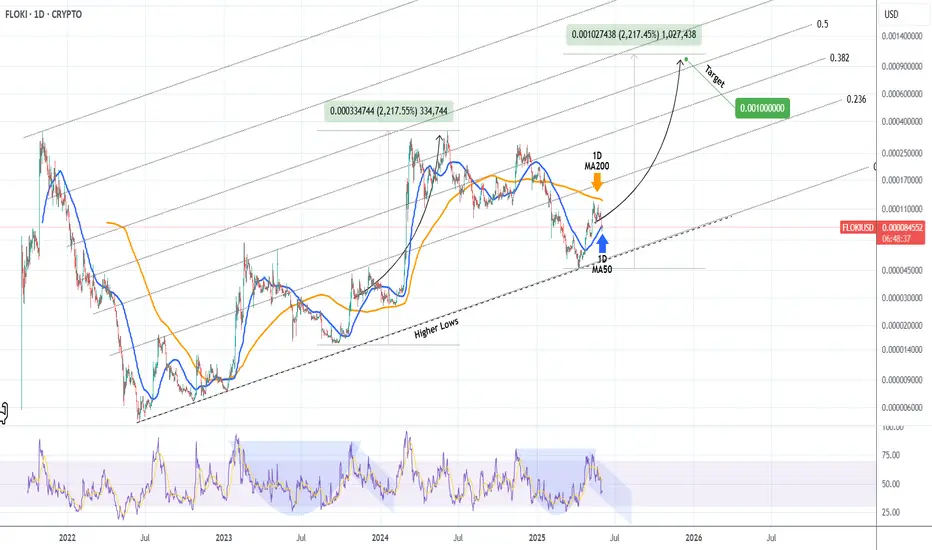
FLOKI Can it hit $0.0010 by the end of the year?Floki Inu (FLOKIUSD) made a strong rebound from its April 08 bottom, which happened to be on the Higher Lows trend-line from its 2022 Bear Cycle Low. That was a major Buy Signal long-term and right now the price has found itself ranged within the 1D MA200 (orange trend-line) and 1D MA50 (blue trend-line).
A break above its 1D MA200 would by the next Buy Signal as it would confirm the full extension of this Bullish Leg. This is similar to what took place on Phase 2 after the start of the previou
Solvery IG: Top 3 Meme Coins Set for a Bullish Run by End of MayAs traditional crypto markets remain volatile, meme coins are once again stealing the spotlight with rapid, speculative surges. What began as internet jokes has evolved into a category of high-risk, high-reward digital assets that traders can't afford to ignore.
The expert team at Solvery IG, known for its focus on emerging trends and volatile crypto assets, has identified three meme coins with strong potential for bullish movement through the end of May 2025.
1. Pepe (PEPE)
Solvery IG Analysi
FLOKIUSD: The buy opportunity of the year.FLOKI is bearish on its 1W technical outlook (RSI = 34.609, MACD = 0.000, ADX = 19.895) hitting this week the bottom of the 3 year Bullish Megaphone. The 1W RSI is posting a sequence similar to the previous bottom on September 11th 2023. Technically a rally of identical proportions should begin to price the Cycle Top. TP = 0.0010.
## If you like our free content follow our profile to get more daily ideas. ##
## Comments and likes are greatly appreciated. ##
FLOKIUSD Channel Up bottomed. Best buy level for $0.001FLOKI is trading inside a Channel Up since the June 13th 2022 Bear Cycle bottom.
As the 1week RSI touched 35.00 and is holding, this is technically a strong buy indicator long term.
The price just broke below the 0.5 Fibonacci level and touched the bottom of the 3 year Channel Up.
There is no better buy signal than this. Buy and target 0.001 (just under the 1.5 Fib extension).
Follow us, like the idea and leave a comment below!!
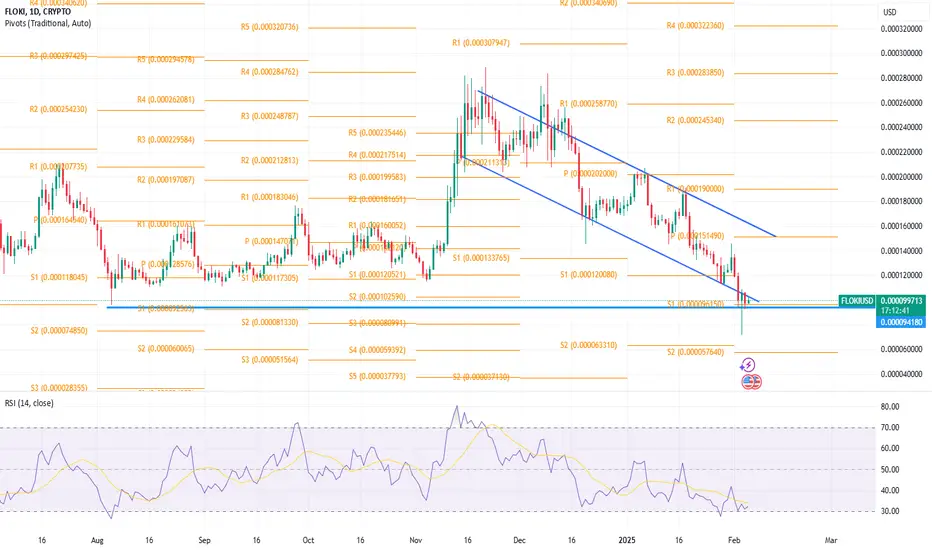
F"IN AROUND WITH FLOKIEPlaying around with the FLOKIE chart to see if there is any interesting MEME stuff, news. Did find it interesting that when I zoomed out to 2021 I had realized we had been up in these altitudes before. I'll be keeping an eye on that support level of .00011.
Any constructive criticisms, advice, tips, tricks, feedback, happy thoughts always appreciated.
Cheers
FLOKI 12H Best Level to BUY/HOLD 100% gains bullish swing🔸Hello traders, today let's review 12hour price chart for FLOKI. Range locked price action last 8+ months, however there is still room left for a decent bounce off the lows.
🔸FLOKI currently is in the consolidation state drifting lower on auto-pilot, however strong stack of order blocks below highlights bullish liquidity. Once triggered I'm expecting
decent reaction and bounce off the lows.
🔸Recommended strategy bulls: Wait for the price action to trigger liquidity order block below market pri