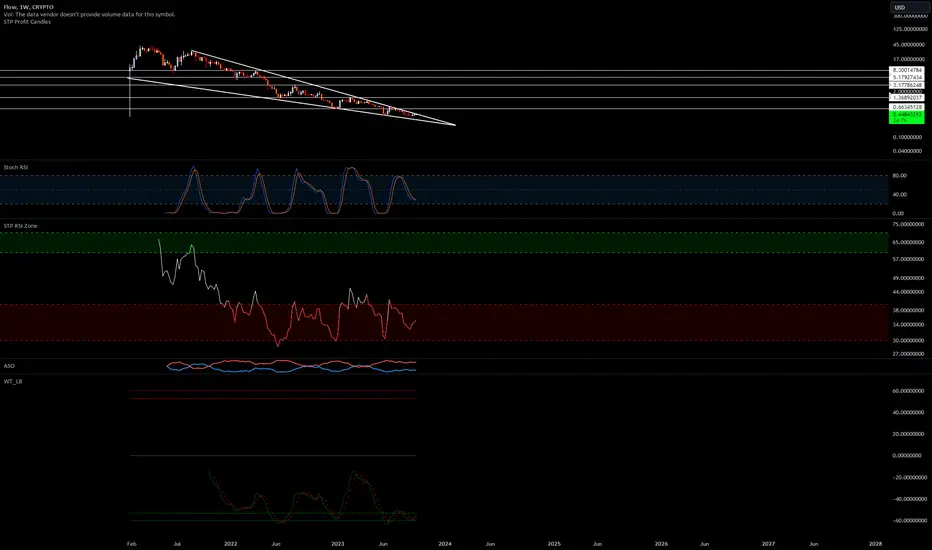
Fib And POCSo something I discovered that i found to be pretty cool. Its probly known by many but I just learned it on my own so im psyked about it. So my last idea regarding the crypto Flow, I wanted to see where my areas were where the price my stall a little bit, go a little slow, have some blockage. So I used a pretty amazing tool that doesnt give the POC and volume histogram for a given zone but it gives it for EVERY SINGLE CANDLE! All the little white lines you see are Point of Control lines for each
In-depth trading ideas
๏ปฟFlowFlow Just formed a big cohesive M. Its now at the lower trend line where POV also is and HVN both acting as strong support in support of this trendline. Volume Void above where trading was previously in that zone but missed price levels in trading and those levels now have magnetic quality. With that Big pretty M and the support its sitting on with friendly skies above is see nowhere to go but strongly Up. Thank You.
FLOW at macro floor: base recovery toward $0.0296The Macro Picture ๐บ๏ธ
FLOW unwound from the $0.04675 macro ceiling all the way down to the $0.02451 floor and has stopped falling right on it. RSI is washed out near 38 and the selling has flattened โ the shape of exhaustion rather than continuation.
The Setup โ๏ธ
The Accumulation Zone ๐ข
$0.02451โ0.02521 is where the selling has dried up. The macro floor has held, and this is the demand shelf a recovery would build from.
The Decision Point ๐ด
$0.03223 (Local High) is the bigger structural gate.
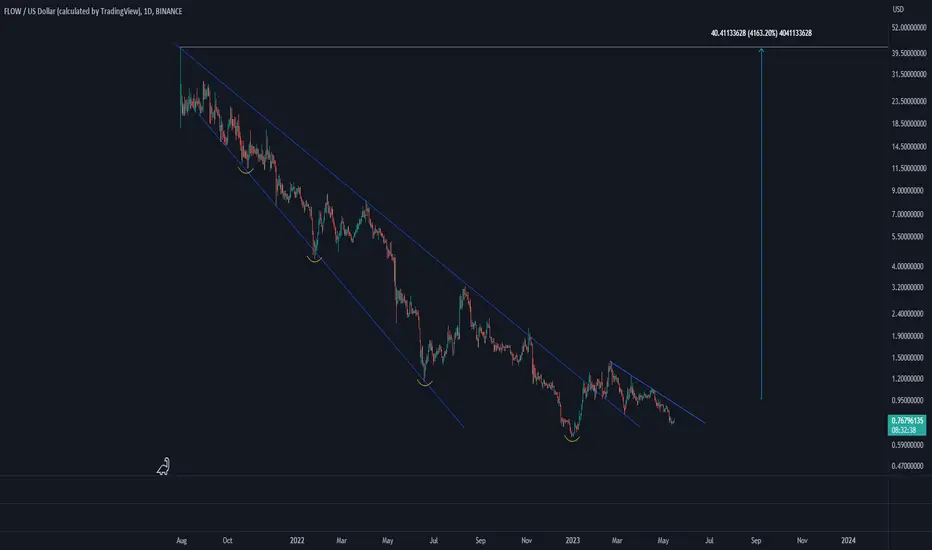
FlowFlow is an interesting blockchain platform which was in a downtrend move since the birth! It is evident from the chart that lower lows were made one after another. However, price have recently broke the downtrend line and if one higher high and one higher low occur, we can hope for a reversal. Let's see what happens.
FLong
$100 invested into flow for 11 days.I usually invest around $300 per trade, but my account is currently running low and need to top it up, I invested $100 flow so I can sell it for an 18% profit. That is $18.
FLong
Those who went with the $FLOWUSD are ... DROWNING! Big Shitcoin!This must be the weakest, dumbest shitcoin in existence. It is even weaker than FIL , which speaks volumes. This shitcoin is still down 97% from its all-time-high and has not had a significant rally despite the entire crypto space mooning into orbit.
Remember the shills when they tweeted and posted tradingview ideas about this ponzi, telling you to just go with the FLOW ? If you went with the #FLOW, chances are you drowned or still drowning.
I expect this shitcoin to dump into the depths of he
๐ Riding the Wave: Uncovering FLOW's Market Divergence! ๐Hello Crypto Explorers! ๐งญ
Have you tuned into FLOW's recent market activity? There's something fascinating unfolding! ๐ง I've been analyzing the crypto market and noticed a potential divergence in FLOW and in another ALTCOINS.. This could be an indicator of an exciting shift! ๐ช๏ธ
Why FLOW? ๐ค
For those who aren't familiar, FLOW is more than just a digital currency. It's a fast, decentralized, and developer-friendly blockchain, designed to power the next generation of apps, games, and digital ass
FLong
๐๐ #FLOW/USDT Falling Wedge Setup Alert ๐๐Hey traders! ๐ฃ
I've identified an exciting opportunity on the $FLOW/USDT chart. ๐ง
๐ Price Action: FLOW is currently forming a falling wedge pattern, which can be a bullish sign! ๐
๐ Technical Analysis:
Falling Wedge Pattern โ
Decreasing Volume โ
Potential Breakout Brewing โ
๐
Timeframe: Keep a close watch on this setup as it unfolds, and patience may pay off.
๐ฏ Entry Point: Consider an entry upon a breakout above the upper wedge trendline. ๐
๐ Stop-Loss: Prudent risk management suggests se
FLOWUSD Huge Falling Wedge and 4hour MA200 breakoutFLOWUSD is crossing today over both the giant Falling Wedge pattern that started at the beginning of 2023 and the 4hour MA200, which has been a Resistance since July 24th.
It is easy to understand that this is a major bullish development for the long term trend. The short term Resistance that is left is the 1day MA50 and that is only $3 away.
As you see we've split the analysis into two charts the 4hour (left) and the 1day (right). Both have the next common bullish benchmark at 0.63500, on the