FLOW/USDT H1: Correction before decline🎯 TP1: $0.029094 (+0.87%) │ TP2: $0.028838 (+1.74%)
🛑 SL: $0.029815 (-1.58%) │ R/R: 1 : 1.1
⚠️ SL is placed beyond the nearest candle tails to reduce the risk of accidental stop-outs.
FUNDAMENTAL BACKGROUND
FLOW lacks its own catalysts, moving in line with the broader crypto market. The Fear & Gree
FLOW/USDT H2: flow – fall without support🎯 TP1: $0.030654 (+1.43%) │ TP2: $0.030208 (+2.87%)
🛑 SL: $0.031911 (-2.61%) │ R/R: 1 : 1.1
⚠️ SL is placed beyond the nearest candle tails to reduce the risk of accidental triggering
DIRECTION
🔴 SELL — FLOW UNDER PRESSURE AMID GENERAL MARKET RISE
FUNDAMENTAL BACKGROUND
FLOW shows weakness amid th
FLOW / FLOWUSDT Long Setup | Breaker Block ReclaimMARKET ANALYSIS
FLOW is currently reacting from a key technical area highlighted on the chart.
As long as the protected support zone remains intact, the bullish market structure remains valid and higher liquidity targets may continue to attract price action.
A breakdown below the invalidation
FLOWUSDT Forming Falling WedgeFLOWUSDT is forming a clear falling wedge pattern, a classic bullish wave signal that often indicates an upcoming breakout. The price has been consolidating within a narrowing range, suggesting that selling pressure is weakening while buyers are beginning to regain control. With consistent volume co
FLOW/USDT — Short at Recovery Top [Quantum Algo]Title: "FLOW/USDT — Short at Recovery Top "
Description:
FLOWUSDT Perpetual
Context:
FLOW has been in a sustained downtrend since late May — selling off from 0.0345 down to 0.0252. After bottoming, price has staged a recovery rally back to 0.0295. Right at the top of the recovery, a fresh Sell sig
Flow · The altcoins bull market starts now · Crypto is going up Some projects leave no room for doubt. You look at this chart and there is no way to conceive the start of a bear market. It is just not possible. A really long one just ended late last month.
FLOWUSDT produced the highest volume ever in March 2026, by far the highest, truly something. The 9-March
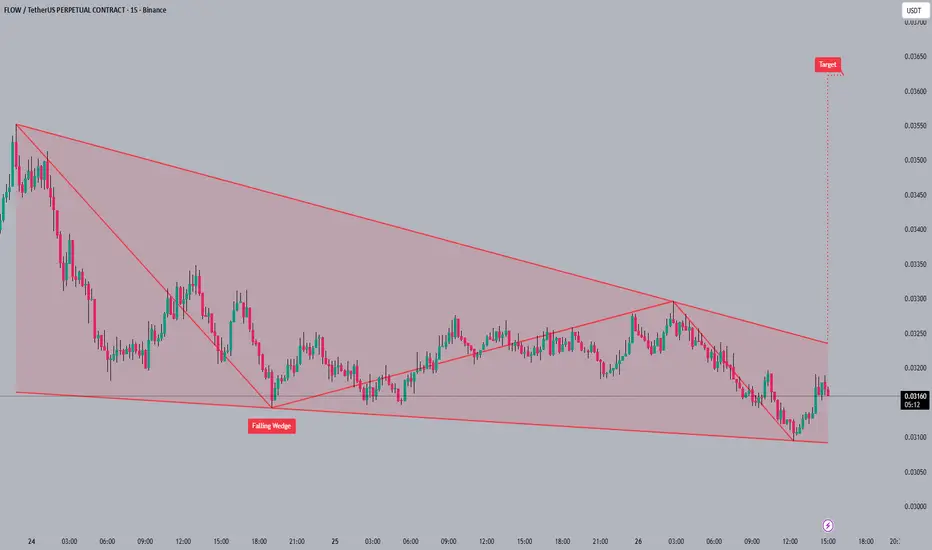
#FLOW#FLOW is currently trading within a falling wedge pattern 📉, hinting at a potential bullish reversal. The falling wedge formation 📐 suggests decreasing selling pressure as the price consolidates. A breakout from this wedge could target the 0.0365 level 🎯.
A breakout from this wedge could target the
FLOWUSDT Forming Falling WedgeFLOWUSDT is forming a clear falling wedge pattern, a classic bullish reversal signal that often indicates an upcoming breakout. The price has been consolidating within a narrowing range, suggesting that selling pressure is weakening while buyers are beginning to regain control. With consistent volum
FLOW: bounce or drop? key levels and targets for todayFLOW
Who’s brave enough to touch a chart that looks like a ski slope straight to zero? According to market chatter, FLOW’s been under pressure with weak liquidity and fading hype, but lately the headlines about ecosystem updates and partnerships are starting to creep back in. That’s usually when s
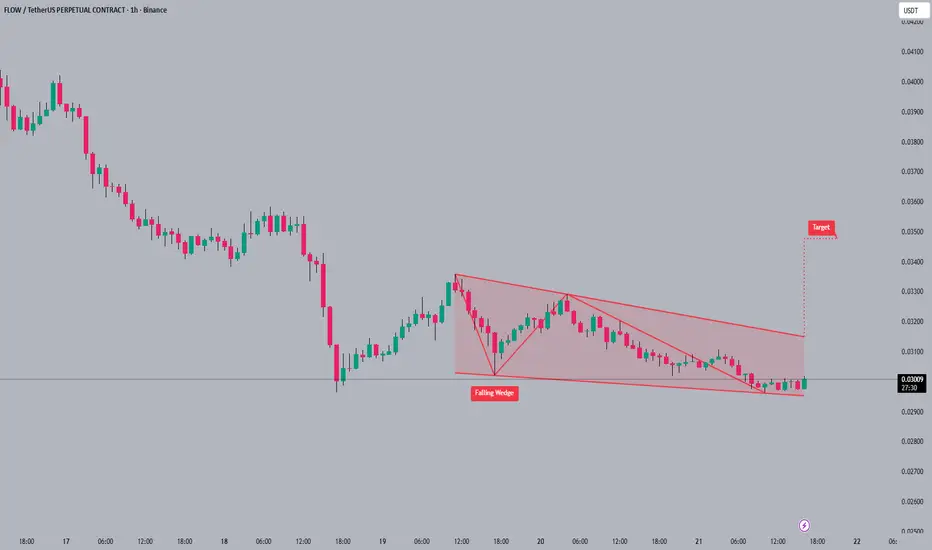
#FLOW#FLOW is currently consolidating within a falling wedge pattern 📐, hinting at a potential breakout. The price action is coiling tighter 🐍, and volume appears to be declining as it approaches the wedge's apex. Should the breakout occur, the projected target 🎯 lies around 0.035.
#FLOW #altcoin #tradi
See all ideas
Summarizing what the indicators are suggesting.
Oscillators
Neutral
Oscillators
Neutral
Summary
Neutral
Summary
Neutral
Summary
Neutral
Moving Averages
Neutral
Moving Averages
Neutral
Displays a symbol's price movements over previous years to identify recurring trends.