FLOW/USDT H1: Correction before decline🎯 TP1: $0.029094 (+0.87%) │ TP2: $0.028838 (+1.74%)
🛑 SL: $0.029815 (-1.58%) │ R/R: 1 : 1.1
⚠️ SL is placed beyond the nearest candle tails to reduce the risk of accidental stop-outs.
FUNDAMENTAL BACKGROUND
FLOW lacks its own catalysts, moving in line with the broader crypto market. The Fear & Greed Index in the 68–75 zone indicates overheated altcoins, increasing correction risks. Expectations around the Fed's rate decision on 16.09.2026 create uncertainty, limiting appetite for risk assets. G
In-depth trading ideas
FLOW/USDT H2: flow – fall without support🎯 TP1: $0.030654 (+1.43%) │ TP2: $0.030208 (+2.87%)
🛑 SL: $0.031911 (-2.61%) │ R/R: 1 : 1.1
⚠️ SL is placed beyond the nearest candle tails to reduce the risk of accidental triggering
DIRECTION
🔴 SELL — FLOW UNDER PRESSURE AMID GENERAL MARKET RISE
FUNDAMENTAL BACKGROUND
FLOW shows weakness amid the overall crypto market growth—lack of project catalysts and low liquidity make the token vulnerable to a correction. Despite the bullish sentiment of the Fear & Greed Index (62 — Greed) and the recov
FLOW / FLOWUSDT Long Setup | Breaker Block ReclaimMARKET ANALYSIS
FLOW is currently reacting from a key technical area highlighted on the chart.
As long as the protected support zone remains intact, the bullish market structure remains valid and higher liquidity targets may continue to attract price action.
A breakdown below the invalidation level would weaken the current bullish scenario and require a reassessment of market conditions.
📍 Entry, Stop Loss and Take Profit levels are marked directly on the chart.
━━━━━━━━━━━━━━
⚠️ DISCL
FLOWUSDT Forming Falling WedgeFLOWUSDT is forming a clear falling wedge pattern, a classic bullish wave signal that often indicates an upcoming breakout. The price has been consolidating within a narrowing range, suggesting that selling pressure is weakening while buyers are beginning to regain control. With consistent volume confirming accumulation at lower levels, the setup hints at a potential bullish breakout soon. The projected move could lead to an impressive gain of around 40% to 50% once the price breaks above the we
FLOW/USDT — Short at Recovery Top [Quantum Algo]Title: "FLOW/USDT — Short at Recovery Top "
Description:
FLOWUSDT Perpetual
Context:
FLOW has been in a sustained downtrend since late May — selling off from 0.0345 down to 0.0252. After bottoming, price has staged a recovery rally back to 0.0295. Right at the top of the recovery, a fresh Sell signal has fired as price tags the previous breakdown zone.
Why this setup works — three confluences:
Recovery into breakdown zone — the 0.0295–0.0305 area was where the previous downtrend accelerated.
Flow · The altcoins bull market starts now · Crypto is going up Some projects leave no room for doubt. You look at this chart and there is no way to conceive the start of a bear market. It is just not possible. A really long one just ended late last month.
FLOWUSDT produced the highest volume ever in March 2026, by far the highest, truly something. The 9-March weekly session produced 275.06 M worth of volume. To add some perspective, the second highest week on this chart did 139.54 M in January 2024. Then it goes much lower and this happened only several ti
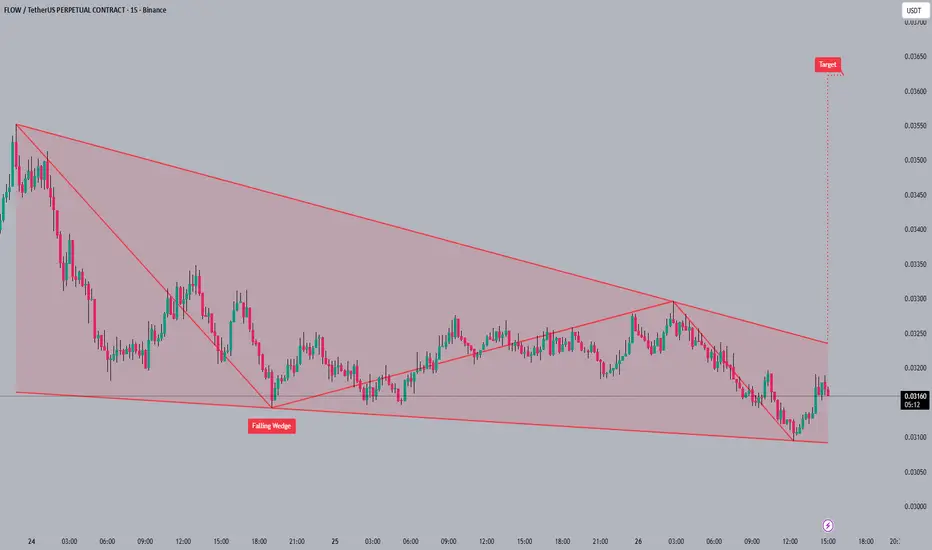
#FLOW#FLOW is currently trading within a falling wedge pattern 📉, hinting at a potential bullish reversal. The falling wedge formation 📐 suggests decreasing selling pressure as the price consolidates. A breakout from this wedge could target the 0.0365 level 🎯.
A breakout from this wedge could target the 0.0365 level 🎯.
#FLOW #crypto #trading #altcoin
FLOWUSDT Forming Falling WedgeFLOWUSDT is forming a clear falling wedge pattern, a classic bullish reversal signal that often indicates an upcoming breakout. The price has been consolidating within a narrowing range, suggesting that selling pressure is weakening while buyers are beginning to regain control. With consistent volume confirming accumulation at lower levels, the setup hints at a potential bullish breakout soon. The projected move could lead to an impressive gain of around 290% to 300% once the price breaks above
FLOW: bounce or drop? key levels and targets for todayFLOW
Who’s brave enough to touch a chart that looks like a ski slope straight to zero? According to market chatter, FLOW’s been under pressure with weak liquidity and fading hype, but lately the headlines about ecosystem updates and partnerships are starting to creep back in. That’s usually when smart money quietly accumulates while everyone else memes it to death.
On the 4H chart we’re sitting on a heavy demand pocket after a brutal bleed, with RSI stuck in oversold but curling up. I see a t
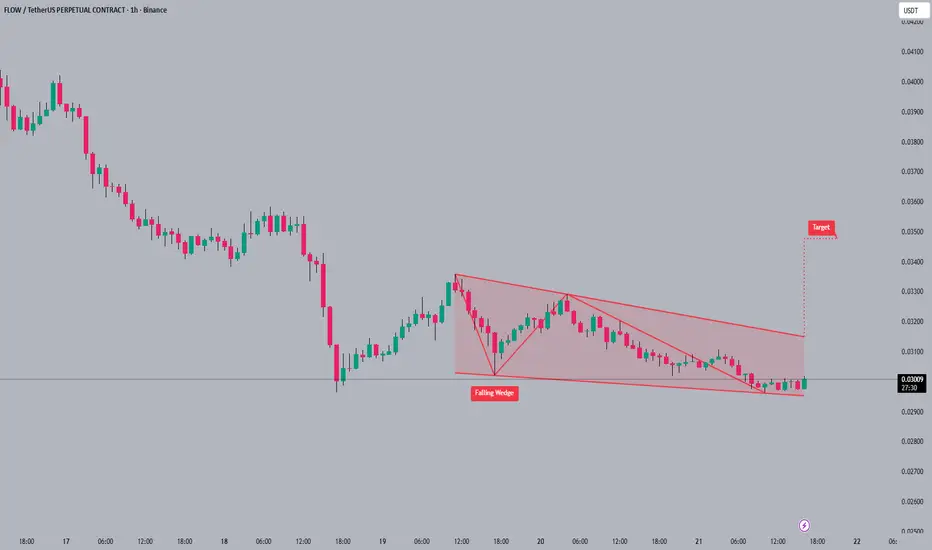
#FLOW#FLOW is currently consolidating within a falling wedge pattern 📐, hinting at a potential breakout. The price action is coiling tighter 🐍, and volume appears to be declining as it approaches the wedge's apex. Should the breakout occur, the projected target 🎯 lies around 0.035.
#FLOW #altcoin #trading #crypto
FLOWUSDT Forming Bullish PennantFLOWUSDT is forming a clear bullish pennant pattern, a classic bullish continuation signal that often indicates an upcoming breakout. The price has been consolidating within a narrowing range, suggesting that selling pressure is weakening while buyers are beginning to regain control. With consistent volume confirming accumulation at lower levels, the setup hints at a potential bullish breakout soon. The projected move could lead to an impressive gain of around 190% to 200% once the price breaks
FLOWUSDT Tight Bull ,Price Floor ,Deep Retrace And OBV Inflow
FLOWUSDT 27/02/2026 19:28
💰 0.04014 | Fut: 0.04009 🟢 Tight BULL 10.12% at 1.23x
🟢(55.1%) : 🔴(44.9%) ⏳Clarity: 49%
Retrace: -26% Bounce: 19% 0.7x ⚠️ Partial
FLOW is trading at 0.04014 spot and 0.04009 futures with a tight bullish structure reading 55.1 to 44.9 in favor of buyers across 30 bull signals against 25 bear out of 112 total. The spread at 9.1 percent with tight conviction tells you this is a contested market with a slight bullish lean rather than a committed directional move. Clarity
FLong
FLOW: ready for a bounce? key levels to watch in the days aheadFLOW. Tired of watching this one bleed every week? News feed is still cold on NFT and gaming coins, while liquidity keeps hugging the majors, which is exactly why I like hunting oversold bounces here. FLOW is sitting on a fat multi-week demand zone that the market keeps defending.
On the 4H chart price is parked in the green box around 0.036-0.039, RSI just ripped up from deep oversold and is back above 50. VPVR shows the next serious liquidity node up near 0.042-0.044, right where my first red
FLOW/USDT 1$ !!!Over the past three weeks, has been building a solid support base at the $0.35 zone, where buyers have consistently stepped in to defend the level. Price action is now showing signs of a bullish structure activation, with an aggressive push from whales fueling strong upward momentum.
Recently, FLOW has successfully reclaimed the $0.40 zone with notable volume, confirming demand returning to the market. With this momentum, the structure is favoring further upside:
TP1: $0.88
TP2: $1.10 (exten
Potential Reversal in Play – Eyes on the Breakout!Trend Broken: The long-term downtrend has finally been broken, signaling a potential shift in market structure.
Liquidity Taken: Recent price action swept the lows, grabbing liquidity before bouncing back.
MACD Turning Up: Momentum is starting to build on the upside, indicating possible bullish continuation.
📍 Plan: Watching for follow-through towards the key supply zone around 0.69.
💡 Educational Note: For a more precise entry, switch to a lower timeframe (4H or 2H) and look for the most re
FLOWUSDT Breakout + Golden Pocket Retest: Ready to Explode?After being trapped in a persistent downtrend for months, FLOW has finally shown a major technical signal: a clean breakout from the dominant descending trendline that has defined price action since late 2024.
This breakout isn’t just visually appealing — it’s backed by strong technical confluence, including a key demand zone, Fibonacci retracement support, and potential shift in market psychology.
---
🧠 Technical Structure & Chart Breakdown
📉 Descending Trendline Breakout
The major downtre
Good time to buy FLOWUSDT (33% Signal)FLOW has successfully consolidated above a major support area. The main target is $0.621 but a less risky exit point would be $0.57.
FLong
FLOWTrend: Overall downtrend since 2023, but currently bouncing from the lower boundary of the channel.
Current Price: $0.406, up 8.27% this week – a bullish sign.
Support Zone: Around $0.33–$0.35 (lower boundary of the descending channel).
Resistance Zone: $0.70–$0.80 short-term, and $1.28 long-term (upper channel boundary).
🧠 Summary:
FLOW shows signs of a potential reversal from the bottom of a long-term channel. If it continues to respect this bullish momentum, it could target higher resistance
Flow: Your Altcoin ChoiceBefore starting, I want to show you the linear chart for FLOWUSDT. I always use the log. chart to be able to see the high and lows and the candles more clearly.
When the candles become flat and almost invisible, it means the market is trading at bottom prices. This is FLOWUSDT long-term:
This applies to all pairs and Cryptocurrency projects. When the candles become almost invisible, it means that the current neutral market cycle has been exhausted. Next comes the bull market.
Now we can go t
Flowusdt.pHello friends
We will have the analysis of the currency flow, stay with me
We have 3 entry points in a stepwise manner
0.352
0.288
0.25
But the targets for saving profit
1.668
4.331
18
Please observe capital management, our view for this coin is medium and long term
Be successful and profitable🌹