FLR at macro floor: base recovery toward $0.00707The Macro Picture 🗺️
FLR ground down from the $0.01008 macro ceiling all the way to the $0.00614 macro floor and has flattened onto it at $0.00622. The long, steady bleed has given way to a base right on support — exhaustion rather than continuation.
The Setup ⚙️
The Accumulation Zone 🟢
$0.00614–0.00622 is where the selling has dried up. Macro Support has held on retest, and this is the demand shelf a recovery would build from.
The Decision Point 🔴
$0.00829 (Local High) is the structural gate. Before it, the $0.00707 measured-move target is the first objective — reclaiming it proves buyers are stepping back in.
The Roadmap 🛣️
Hold the $0.00614 floor → recover toward $0.00707 as the first leg up. Invalidation is a clean daily close below $0.00614 — that voids the accumulation thesis.
This is a textbook DCA Accumulation Zone setup: scale in across the $0.00614–0.00622 band and let the base do the work.
#FLR #Flare #crypto #trading #TA #3Commas #DCA
In-depth trading ideas
FLR | Week 20 1hr chart | May 2026 Added a bunch of Daily BackSide levels above price which may act as resistance.
Added some support levels from daily, 4hr, and 1hr.
** T.A explained **
Multiple Time-Frame Analysis; Color Code:
Strength favors the higher timeframe.
Yearly timeframe = black
Monthly timeframe = pink
weekly = grey
daily = red
4hr = orange
1hr = yellow
15min = blue
5min = green if they are shown. (Level visibility on intervals is set to timeframe the level was found on and below to keep chart view organized.)
Ranges defined
A Range = two or more consecutive color candles (2+ in a row, same color creates a range)
There are two types of ranges - Accumulation Ranges &
Distribution Ranges.
*A single candle is a range on a lower timeframe. Mark the candle and then find the range / level on a lower timeframe aka "Range Finding".
Some people use boxes and call this boxing finding the zone - supply & demand zones - and marking the entire range top to bottom. This is acceptable but introduces risk by increasing probability of orders getting filled.
Candle Science further defines the zone / range into levels. So. after finding a range, identify and label the first and last candle of the range.
This is Candle Science. Everything has a default expectation and users thinking is guided by IF/THEN statements.
Below are the default expectations for each range and the first and last candle within the range.
DISTRIBUTION RANGES:
When price is above a distribution range its default expectation is to support price accumulation.
The first distribution candle in a distribution range is labeled as the BackSide Candle (BS).
Expectation = strong reaction to price. Look for price action to create long wicks reaching to or away from level. A steep angle trend is expected to form so Fair Value Gaps are expected to form on the timeframe of the level and lower timeframes.
If a steep angle trend is not forming, and long wicks are not being created then the idea is that liquidity is not there, confidence in the level is low. Price Action may then be looking for more liquidity to and seek it out at the FrontSide Candle.
FrontSide (FS) Candle = The last distribution candle in a distribution range.
Expectation = create a low angle accumulation trend reversal.
3 bar reversal patterns laddering up
like the distribution candles are the rungs of an accumulation ladder. price uses the top side of the BackSide Candle or the top side of the FrontSide Candle as support. They are used in bull flags to break distribution trends.
IF price fails to gain a BackSide or FrontSide level THEN they act as RESISTANCE. But we will then train our eyes to look at the bottom side of Accumulation Ranges because they have a default expectation as Resistance.
When Price is below an accumulation candle, the bottom side of the accumulation candle is the level of resistance.
ACCUMULATION RANGES DEFINED:
Inverse BackSide Candle (Inv.BS) = the first accumulation candle in an accumulation range.
Expectation. = strong reaction to price. long wicks reaching to or away from level. Creates a steep angle distribution trend. Usually create F.V.G's and impulsive, volatile moves like the BackSide Candle.
Inverse FrontSide Candle (Inv.FS) = The last accumulation candle in an accumulation range.
Expectation = reversal, create a low angle distribution trend. The bottom side of the accumulation candles are used as resistance levels.
TOOLS USED:
Boxes - used to define a zone by marking the entire range (if its small) or just one entire candle or just the wick of the candle to define the zone.
Horizontal Ray tool - used to define the level.
levels when dashed lines are untested, active level where buyers or sellers are waiting to create a level of interest.
Tested levels are dotted lines. If used, they reference the range and could become Origin levels or R.a.t.s in the future (levels where new trends originate or where traders are using Rejection as A Target to scalp and reverse position - aka stoploss hunters; like the rats they are.
Again the color code:
Yearly timeframe color is Black
Monthly timeframe is color pink
weekly grey
daily is red
4hr is orange
1hr is yellow
15min is blue
5min is green if they are shown.
strength favors the higher timeframe.
FLR | 4hr Chart FLR lost the 2023 SwingLow support creating All Time Low's.
4hr timeframe tracking support / resistance.
** T.A explained **
Multiple Time-Frame Analysis; Color Code:
Strength favors the higher timeframe.
Yearly timeframe = black
Monthly timeframe = pink
weekly = grey
daily = red
4hr = orange
1hr = yellow
15min = blue
5min = green if they are shown. (Level visibility on intervals is set to timeframe the level was found on and below to keep chart view organized.)
Ranges defined
A Range = two or more consecutive color candles (2+ in a row, same color creates a range)
There are two types of ranges - Accumulation Ranges &
Distribution Ranges.
*A single candle is a range on a lower timeframe. Mark the candle and then find the range / level on a lower timeframe aka "Range Finding".
Some people use boxes and call this boxing finding the zone - supply & demand zones - and marking the entire range top to bottom. This is acceptable but introduces risk by increasing probability of orders getting filled.
Candle Science further defines the zone / range into levels. So. after finding a range, identify and label the first and last candle of the range.
This is Candle Science. Everything has a default expectation and users thinking is guided by IF/THEN statements.
Below are the default expectations for each range and the first and last candle within the range.
DISTRIBUTION RANGES:
When price is above a distribution range its default expectation is to support price accumulation.
The first distribution candle in a distribution range is labeled as the BackSide Candle (BS).
Expectation = strong reaction to price. Look for price action to create long wicks reaching to or away from level. A steep angle trend is expected to form so Fair Value Gaps are expected to form on the timeframe of the level and lower timeframes.
If a steep angle trend is not forming, and long wicks are not being created then the idea is that liquidity is not there, confidence in the level is low. Price Action may then be looking for more liquidity to and seek it out at the FrontSide Candle.
FrontSide (FS) Candle = The last distribution candle in a distribution range.
Expectation = create a low angle accumulation trend reversal.
3 bar reversal patterns laddering up
like the distribution candles are the rungs of an accumulation ladder. price uses the top side of the BackSide Candle or the top side of the FrontSide Candle as support. They are used in bull flags to break distribution trends.
IF price fails to gain a BackSide or FrontSide level THEN they act as RESISTANCE. But we will then train our eyes to look at the bottom side of Accumulation Ranges because they have a default expectation as Resistance.
When Price is below an accumulation candle, the bottom side of the accumulation candle is the level of resistance.
ACCUMULATION RANGES DEFINED:
Inverse BackSide Candle (Inv.BS) = the first accumulation candle in an accumulation range.
Expectation. = strong reaction to price. long wicks reaching to or away from level. Creates a steep angle distribution trend. Usually create F.V.G's and impulsive, volatile moves like the BackSide Candle.
Inverse FrontSide Candle (Inv.FS) = The last accumulation candle in an accumulation range.
Expectation = reversal, create a low angle distribution trend. The bottom side of the accumulation candles are used as resistance levels.
TOOLS USED:
Boxes - used to define a zone by marking the entire range (if its small) or just one entire candle or just the wick of the candle to define the zone.
Horizontal Ray tool - used to define the level.
levels when dashed lines are untested, active level where buyers or sellers are waiting to create a level of interest.
Tested levels are dotted lines. If used, they reference the range and could become Origin levels or R.a.t.s in the future (levels where new trends originate or where traders are using Rejection as A Target to scalp and reverse position - aka stoploss hunters; like the rats they are.
Again the color code:
Yearly timeframe color is Black
Monthly timeframe is color pink
weekly grey
daily is red
4hr is orange
1hr is yellow
15min is blue
5min is green if they are shown.
strength favors the higher timeframe.
FLR Shows Strong Buying Momentum – Positive BoP Signals Bullish FLR is currently displaying a positive Balance of Power (BoP) on the one-day chart, signaling that buyers are in control. With the BoP at 0.26, market sentiment is leaning strongly bullish, reflecting active buying pressure.
The BoP is a key indicator measuring the strength of buyers versus sellers over a period. A positive BoP, like FLR’s current reading, suggests that buying momentum exceeds selling pressure, which often precedes sustained upward price movements.
Conversely, a negative BoP typically points to seller dominance and can foreshadow price declines or consolidation phases.
Given FLR’s current positive sentiment, the likelihood of a continued rally appears strong as buyers push the price higher.
FLRUS breaking above the invh&s necklineNice it confirms the breakout the target is around 3 cents. Could always dip back below the neckline a time or two before that happens, but considering how it feels lke we are finally confirming an altseason here with bitcoin dominance taking a big dump probability highly favors an eventually validation of this breakout on flr. *not financial advice*
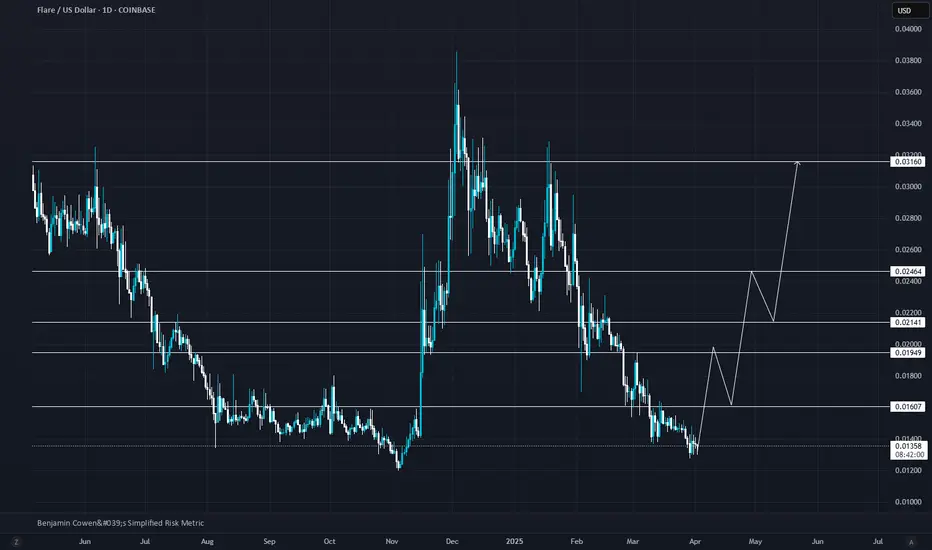
FLR/USD: Anticipating a Bullish Reversal from Key Support LevelsFLR/USD is showing strong potential for a bullish reversal after recently bouncing off critical support. The chart illustrates possible upward momentum through clearly marked horizontal resistance levels. Monitoring each of these levels closely will provide strategic entry and exit points.
Stay vigilant and trade responsibly!
FLRUSD Currency Quote | Chart & Forecast SummaryKey Indicators On Trade Set Up In General
1. Push Set Up
2. Range Set up
3. Break & Retest Set Up
Notes On Session
# FLRUSD Currency Quote
- Double Formation
* Trendline 1&2 | Entry Area | Long Support
* 1st Retracement + 0.618 Area | Subdivision 1
- Triple Formation
* ABC Flat Feature | Subdivision 2
* 2nd Retracement | Short Entry Bias | Subdivision 3
* Daily Time Frame | Trend Settings Condition
Active Sessions On Relevant Range & Elemented Probabilities;
European-Session(Upwards) - East Coast-Session(Downwards) - Asian-Session(Ranging)
Conclusion | Trade Plan Execution & Risk Management On Demand;
Overall Consensus | Sell
Breaking: $FLARE Soars 16.71% Amidst Bullish Flag PatternThe cryptocurrency market is no stranger to volatility, but Flare Network’s native token, NYSE:FLR , is making waves with a remarkable 16.71% surge today. Despite the broader crypto landscape remaining bearish, NYSE:FLR is defying the odds, showcasing strong technical and fundamental indicators that suggest further upside potential. Let’s dive into the details of what’s driving this surge and why NYSE:FLR could be poised for a breakout.
Technical Analysis
NYSE:FLR is currently forming a bullish flag pattern, a continuation signal that often precedes a significant upward move. The pattern is characterized by a sharp rise (the flagpole) followed by a period of consolidation (the flag). For NYSE:FLR , the flagpole was the recent surge, and the consolidation phase is now underway.
A breakout above the flag’s ceiling could trigger a 70% surge, targeting the psychological resistance level of $0.038. This would mark a decisive move for NYSE:FLR , potentially attracting more buyers and fueling further gains.
The Relative Strength Index (RSI) for NYSE:FLR is currently at 44.98, which is neither overbought nor oversold. This suggests that there is ample room for upward momentum before the token enters overbought territory. A rising RSI could accompany the breakout, confirming the strength of the move.
The 24-hour trading volume of $35.9 million and a market cap of $1.33 billion indicate strong liquidity and investor interest. The recent price surge has likely caught the attention of traders, further boosting momentum.
Flare Network’s Unique Value Proposition
Flare is an Ethereum Virtual Machine (EVM)-compatible Layer 1 blockchain designed to enhance blockchain utility. Its unique architecture allows developers to access high-integrity data from other chains and the internet, enabling new use cases and monetization models.
One of Flare’s standout features is its ability to provide decentralized access to data from external sources. Flare allows dApps to serve multiple blockchains through a single deployment, reducing fragmentation and increasing efficiency.
With a market cap exceeding $1 billion, Flare has firmly established itself as a significant player in the crypto market.
Conclusion: A Breakout in the Making?
NYSE:FLR ’s recent surge and technical setup indicate that the token could be on the verge of a major breakout. The bullish flag pattern, combined with strong fundamentals, makes NYSE:FLR a compelling asset in the current market environment.
As always, it’s essential to conduct your own research and consider your risk tolerance before investing. But one thing is clear: NYSE:FLR is a token to watch as it continues to defy market trends and carve out its niche in the crypto ecosystem.
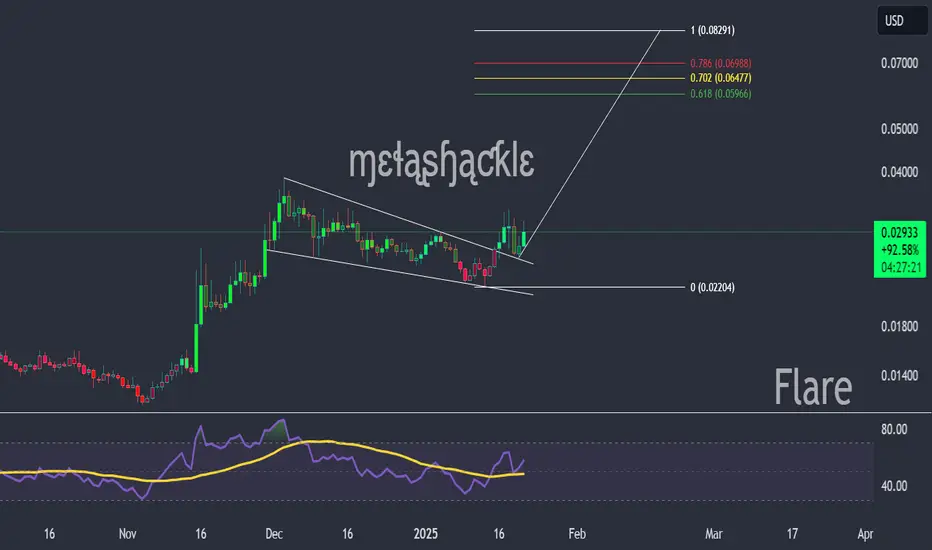
FLARE is setting up for a potential 100% + bullish move!After a successful backtest of the bullish descending wedge's upper trendline, Flare looks to be setting up for a move to the $0.06 - $0.07 range. If this move plays true, Flare could easily double over the next 3 to 6 weeks.
Good luck, and always use a stop-loss!
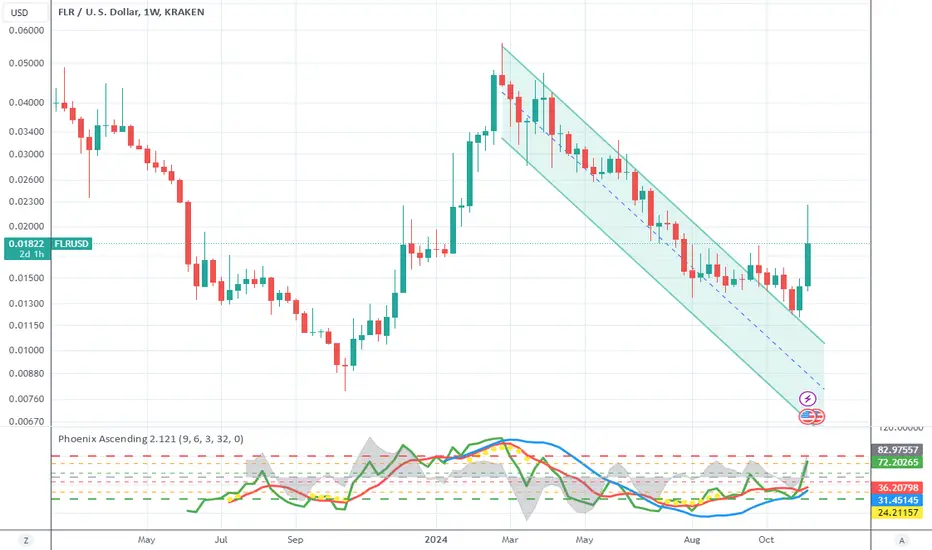
FLR in weekly chart I do not have anything more than that I published for this symbol in my last idea and it is a complementary road map for the future.
If you have not been able to get in this coin, please wait for a correction in this weekly chart and then start investing.
Please check my last idea of this chart.
Thanks
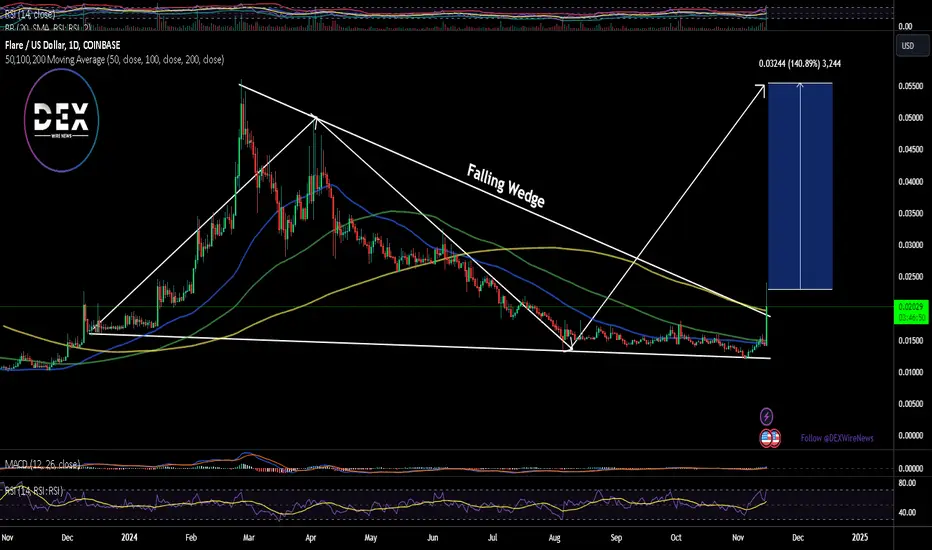
Flare breaking up from falling wedge that is also a bullpennantThe shorter dotted purple line is the breakout target for just the falling wedge alone. The much longer dotted purple line is the measured move / breakout target line for the entire pennant. As we can see the price action has treated this longer dotted purple line as exact wick resistance here now as it begins its ascension to the breakout targets which helps tell us that this measured move line is indeed a very valid one. We can also see an impending golden cross just around the corner for flare as well at which point I expect it to get the same bullish impulse most of the alt market has been getting after their golden cross happens. If we hit the full breakout target of the entire pennant, that will take price action above a double bottom neckline as well which wll then lead to the opportunity for an even bigger breakout target. *not financial advice*
Flare Network ($FLR) Up 50%- What Next?Flare Network ( NYSE:FLR ) is making waves in the blockchain space with its innovative approach to interoperability and decentralized data acquisition. With a massive 50% price surge in the last 24 hours, Flare is capturing attention for its technical breakout and transformative developments. Here’s a closer look at what makes Flare unique and how it’s shaping the future of blockchain.
What is Flare (FLR)?
Flare is an Ethereum Virtual Machine (EVM)-based Layer 1 blockchain that aims to enhance blockchain utility. By enabling decentralized access to high-integrity data from other blockchains and the internet, Flare provides developers with tools to create dApps capable of serving multiple chains through a single deployment.
This unique capability unlocks new use cases and monetization models, making Flare an essential player in the evolving blockchain ecosystem.
Key Features That Set Flare Apart
1. Native Interoperability Protocols
Flare’s architecture revolves around two groundbreaking protocols:
- The State Connector: Acquires event data from other blockchains and Web2 sources, allowing smart contracts on Flare to interact seamlessly with external events.
- Flare Time Series Oracle (FTSO): Delivers decentralized prices and data series, ensuring data accuracy without relying on centralized providers.
2. Decentralized Data Acquisition
By using independent data providers, Flare secures blockchain and Web2 data in a decentralized manner. This minimizes risks for developers and users while enabling a wider range of applications.
3. Real-World Integration: Decentralized Identity
Recently, Flare partnered with Red Date Technology to launch a KYC solution for Mainland Chinese visitors in Hong Kong. This system uses decentralized identity technology to perform KYC checks while safeguarding user privacy—a crucial step in bridging blockchain technology with real-world regulatory requirements.
Flare’s Price and Market Performance
- Current Price: $0.020915
- Market Cap: $1.09 billion
- 24-Hour Trading Volume: $63 million
- Price Surge: 48.24% increase in the last 24 hours
- Circulating Supply: 52.5 billion FLR
Flare’s ranking at #73 on CoinMarketCap underscores its growing prominence in the crypto landscape.
Technical Outlook: Breaking Barriers
Flare’s price action is drawing bullish momentum:
- Recent Breakout: NYSE:FLR broke out of a falling wedge pattern, signaling a strong upward trend.
- RSI Levels: Currently at 80, the Relative Strength Index indicates overbought conditions. However, with clear momentum and strong volume, there’s room for further growth.
- Resistance Levels: If the rally continues, NYSE:FLR may target $0.03 as the next significant resistance.
- Support Levels: A consolidation phase could see NYSE:FLR retrace to $0.018 before resuming its upward trajectory.
The Road Ahead for Flare
With its unique technology and expanding use cases, Flare is more than just another blockchain—it’s a foundation for the next wave of decentralized applications. The recent price surge and breakout signal strong investor confidence, and as its ecosystem develops, NYSE:FLR could become a key player in the blockchain world.
For now, the 50% rally marks a milestone, but the journey for Flare is just beginning. Investors and developers alike should keep a close eye on this innovative project.
Conclusion
Flare ( NYSE:FLR ) is redefining blockchain interoperability and decentralized data access with groundbreaking protocols and real-world integrations. With a strong technical breakout and robust fundamentals, NYSE:FLR is showing immense potential to revolutionize the blockchain space. As adoption grows, Flare could very well be the bridge that connects the fragmented worlds of Web2, Web3, and blockchain.
Another FLARE signalWe hav seen in the past when flare breakers it’s previous highs, it has a tendency to sky rocket.
When we see these next 15min candles close above $0.01650 we could see a power move to catch up to the rest of the market. Selling under $0.02.
If the tend line fails, I’m out.
Good luck and have fun with it