FRAX / FRAXUSDT Bullish Setup | Futures Trade IdeaMARKET ANALYSIS
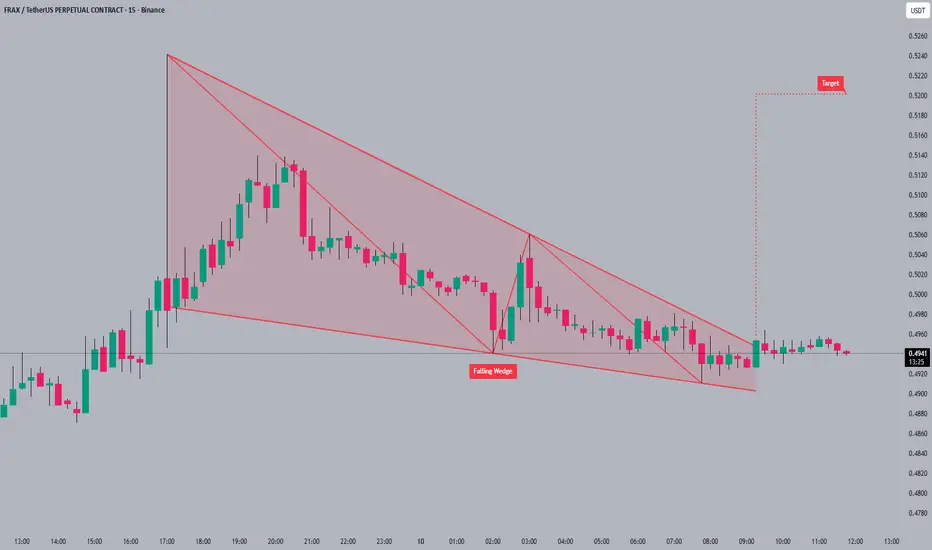
FRAX is currently reacting from a key technical area highlighted on the chart.
As long as the protected support zone remains intact, the bullish market structure remains valid and higher liquidity targets may continue to attract price action.
A breakdown below the invalidation
FRAX / TetherUS PERPETUAL CONTRACT
No trades
No trades
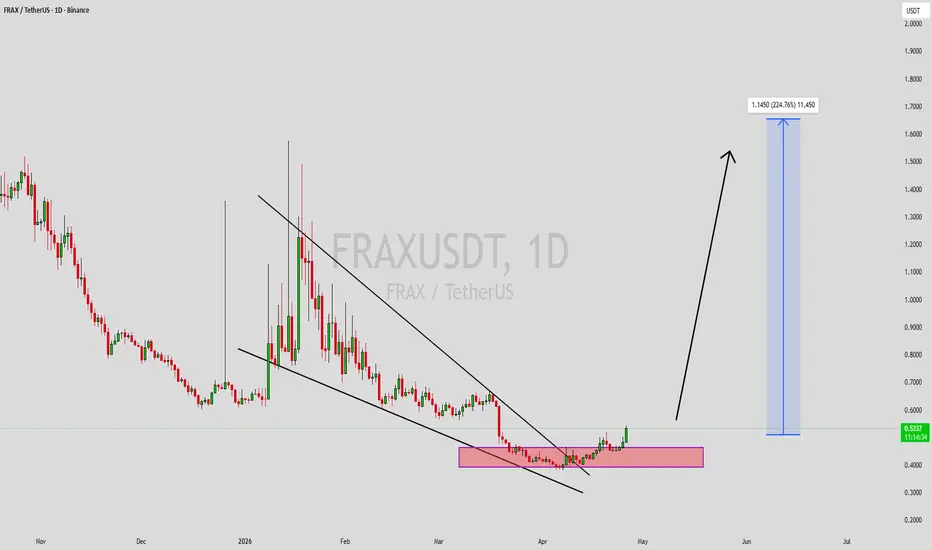
FRAXUSDT Forming Bullish MomentumFRAXUSDT is currently forming a clear bullish momentum pattern, a classic wave structure that often signals an upcoming breakout. The price has been consolidating within a narrowing range, indicating that selling pressure is gradually weakening while buyers are beginning to regain control. With cons
FRAXUSDT UPDATEFRAX Technical Setup Pattern: Falling Wedge Breakout Current Price: $0.5247 Target Price: $0.80, $0.87 Target % Gain: 75.42%
Technical Analysis: FRAX is breaking out of a falling wedge pattern on the 1D timeframe with price pushing above the descending resistance trendline, indicating a bullish rev
FRAXUSDT: short setup from daily support at 0.76BINANCE:FRAXUSDT.P is confidently approaching its all-time lows.
Right now, the price is consolidating above the 0.76 level, positioning itself, in my view, for further downside. What caught my attention is the massive drop on Jan 25, followed by the asset simply "hanging" just above the support
See all ideas
Summarizing what the indicators are suggesting.
Oscillators
Neutral
SellBuy
Strong sellStrong buy
Strong sellSellNeutralBuyStrong buy
Oscillators
Neutral
SellBuy
Strong sellStrong buy
Strong sellSellNeutralBuyStrong buy
Summary
Neutral
SellBuy
Strong sellStrong buy
Strong sellSellNeutralBuyStrong buy
Summary
Neutral
SellBuy
Strong sellStrong buy
Strong sellSellNeutralBuyStrong buy
Summary
Neutral
SellBuy
Strong sellStrong buy
Strong sellSellNeutralBuyStrong buy
Moving Averages
Neutral
SellBuy
Strong sellStrong buy
Strong sellSellNeutralBuyStrong buy
Moving Averages
Neutral
SellBuy
Strong sellStrong buy
Strong sellSellNeutralBuyStrong buy
Displays a symbol's price movements over previous years to identify recurring trends.