FRAX / FRAXUSDT Bullish Setup | Futures Trade IdeaMARKET ANALYSIS
FRAX is currently reacting from a key technical area highlighted on the chart.
As long as the protected support zone remains intact, the bullish market structure remains valid and higher liquidity targets may continue to attract price action.
A breakdown below the invalidation level would weaken the current bullish scenario and require a reassessment of market conditions.
๐ Entry, Stop Loss and Take Profit levels are marked directly on the chart.
โโโโโโโโโโโโโโ
โ ๏ธ DISCL
FRAX / TetherUS
No trades
No trades
In-depth trading ideas
๏ปฟFrax has been on a downtrend since forever. Can we fill due GapFrax has been on slipperly slop downtrend and has difficulty gaining conclusive momentum, despite BTC doing 25k move to the top from 57k, Frax has only accumulated roughly 1million in volume.
Last time it hit this legacy trend line, it consolidated for about 3 months before making a 230% move to the upside. However, the catch is, its been two months since it hit the line. Im curious if the fractal will play early and hit this long target of FVG on daily. Or will it maintain its long kept downtr
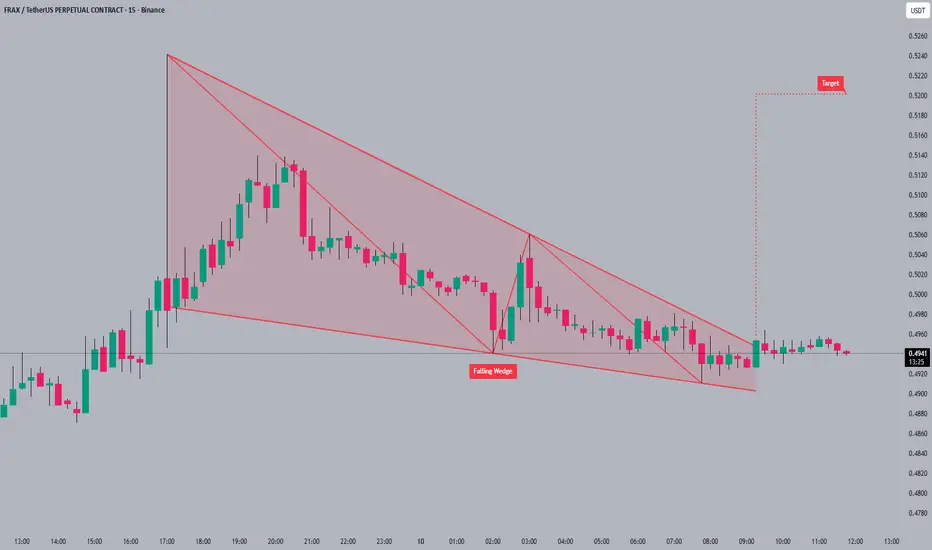
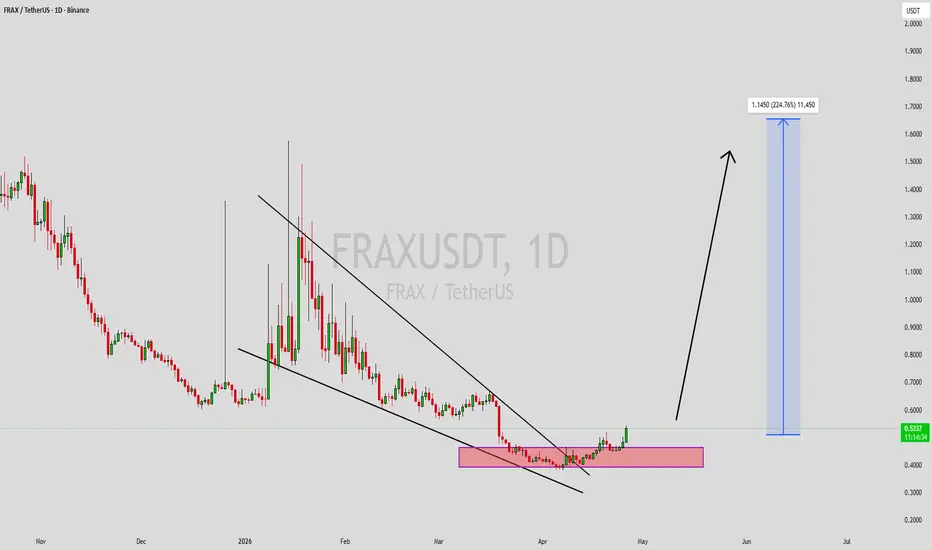
FRAXUSDT Forming Bullish MomentumFRAXUSDT is forming a clear bullish momentum pattern, a classic bullish reversal signal that often indicates a drop. The price has been consolidating within a narrowing range, suggesting that selling pressure is weakening while buyers are beginning to regain control. With consistent volume confirming accumulation at lower levels, the setup hints at a potential bullish breakout soon. The projected move could lead to an impressive gain of around 40% to 50% once the price breaks above the wedge res
FRAX / FRAXUSDT Bullish Setup | Futures Trade IdeaMARKET ANALYSIS
FRAX is currently reacting from a key technical area highlighted on the chart.
As long as the protected support zone remains intact, the bullish market structure remains valid and higher liquidity targets may continue to attract price action.
A breakdown below the invalidation level would weaken the current bullish scenario and require a reassessment of market conditions.
๐ Entry, Stop Loss and Take Profit levels are marked directly on the chart.
โโโโโโโโโโโโโโ
โ ๏ธ DISCL
FRAXUSDT Forming Bullish MomentumFRAXUSDT is currently forming a clear bullish momentum pattern, a classic wave structure that often signals an upcoming breakout. The price has been consolidating within a narrowing range, indicating that selling pressure is gradually weakening while buyers are beginning to regain control. With consistent volume supporting accumulation at lower levels, the setup suggests a strong possibility of a bullish breakout in the near term.
If the price breaks above the wedge resistance, the projected mo
FRAXUSDT UPDATEFRAX Technical Setup Pattern: Falling Wedge Breakout Current Price: $0.5247 Target Price: $0.80, $0.87 Target % Gain: 75.42%
Technical Analysis: FRAX is breaking out of a falling wedge pattern on the 1D timeframe with price pushing above the descending resistance trendline, indicating a bullish reversal supported by recent strong candles and momentum shift after consolidation near the lows. Time Frame: 1D
FRAXUSDT: short setup from daily support at 0.76BINANCE:FRAXUSDT.P is confidently approaching its all-time lows.
Right now, the price is consolidating above the 0.76 level, positioning itself, in my view, for further downside. What caught my attention is the massive drop on Jan 25, followed by the asset simply "hanging" just above the support with minimal volatility. Normally, volatility decreases gradually. Here, we saw a ~25% crash, and the very next day, volatility dropped by a factor of 3.5. This is abnormal.
Two negative factors:
Hi