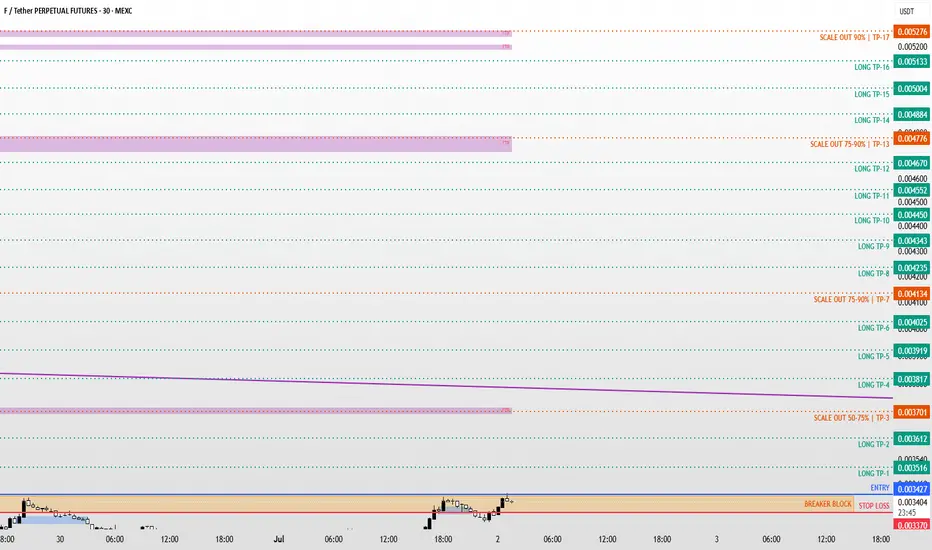
F / FUSDT Bullish Setup | Futures Trade IdeaMARKET ANALYSIS
FUSDT is currently reacting from a key technical area highlighted on the chart.
As long as the protected support zone remains intact, the bullish market structure remains valid and higher liquidity targets may continue to attract price action.
A breakdown below the invalidation
Compare with F / TetherUS
#FUSDT.P Breakout Alert! Don’t Sleep on This OneHey folks!
We’re back with a fresh and spicy new analysis straight outta the Binanciega family kitchen. We just couldn’t let you miss out on this one!
Today’s hot opportunity is #FUSDT.P, straight from Binance Futures. I’m seeing a solid setup here — and with low leverage, this could turn into a s
F/USDTMarkets don’t become clear just because momentum appears.
Most of the time, strong moves happen inside imperfect conditions.
Right now F/USDT is trading near 0.00640, after a fast move higher, approaching resistance around 0.00680.
The broader structure leans bullish, but the environment is not c
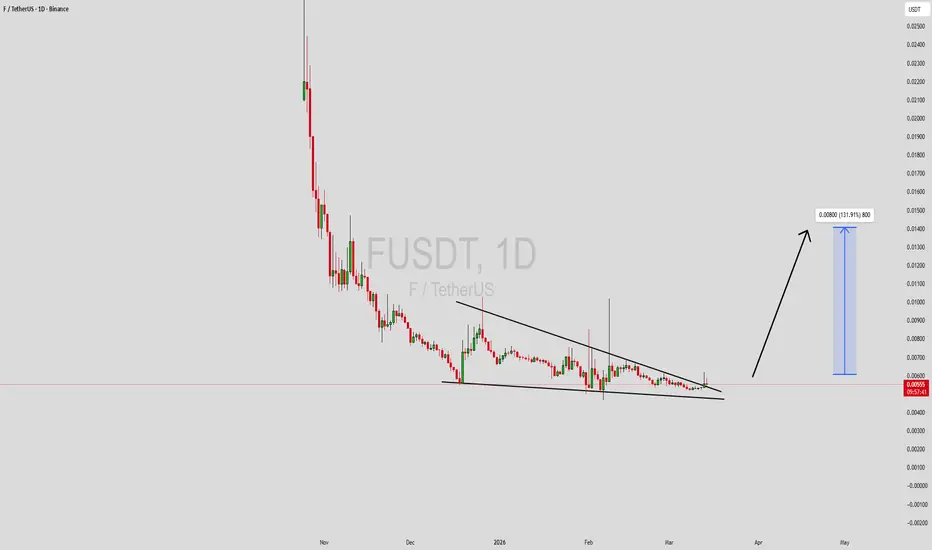
FUSDT Forming Falling WedgeFUSDT is forming a clear falling wedge pattern, a classic bullish reversal signal that often indicates an upcoming breakout. The price has been consolidating within a narrowing range, suggesting that selling pressure is weakening while buyers are beginning to regain control. With consistent volume c
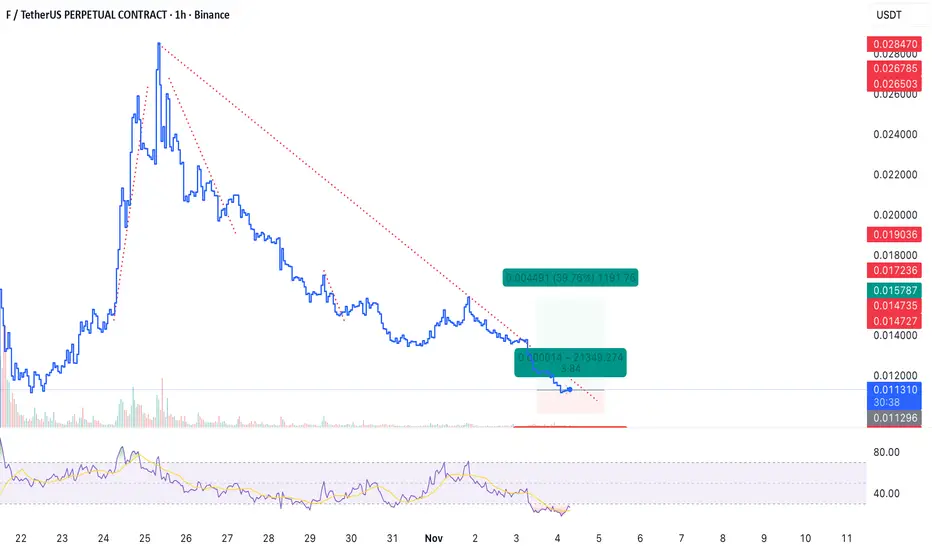
Scalp Long – F💎 Scalp Long – F
Price is consolidating just below the downtrend resistance, preparing for a potential breakout. RSI is deeply oversold, suggesting strong reversal potential. A temporary recovery is anticipated once the breakout is confirmed.
🎯 Trade Setup:
→ TP: 0.15788 | SL: 0.10125 | RR: 1 : 3.
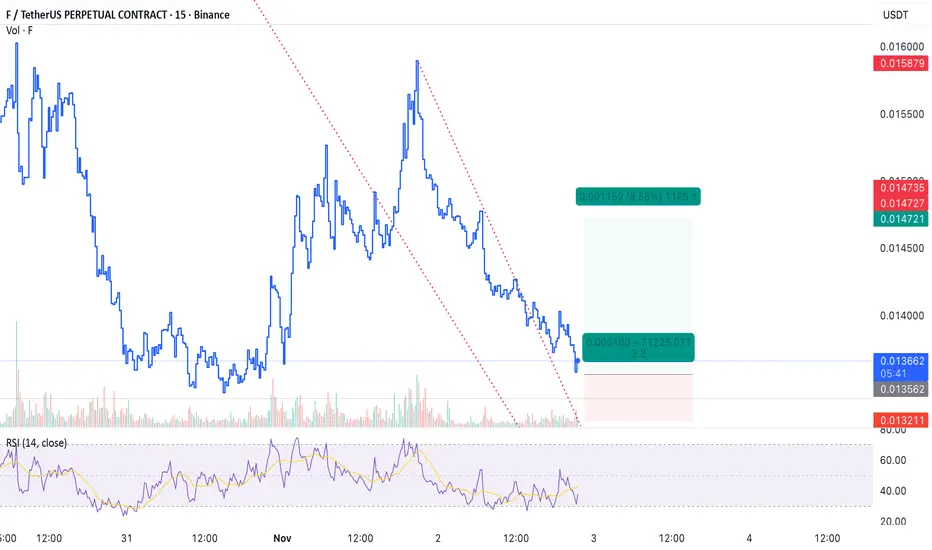
Scalp Long – F💎 Scalp Long – F
Price has broken out of the downtrend and is now retesting major support.
Price action shows strong reaction signals, with buying volume starting to build, indicating a potential rebound.
🎯 Plan:
→ Enter after confirmation of support hold.
→ TP: 0.14629 | SL: 0.13175 | RR: 1 : 3.3
$F SynFutures READY TO FLYSynFutures expanded into commodities like WTI oil and XAU gold on Base chain, powered by Chainlink/Pyth oracles. Trading volume for these assets grew 40% MoM in September 2025
F broke above the 50% Fibonacci retracement level ($0.0143) with a 258% spike in volume. However, RSI-14 (43.02) remains n
F/USDT – Range Breakout Attempt and Early Trend Shifthey all! How are you doing?
Date: October 24, 2025
After months of sideways movement and low volatility, F is showing early signs of a potential trend reversal. The token is testing a key resistance level that has capped price since May, and a breakout from this area could open the door to a more
FUSDT - Scalp Long!Scalp Long Setup
Reason: RSI is in the buy zone → bullish momentum building. Short-term trendline has been broken → early reversal signal.
Plan:
Entry: After a confirmed breakout and retest.
TP: 0.019429
SL: 0.014033
RR: ~1:2.28 → tight risk management required.
Additional Confirmation: Risin
F Looks Bearish (2H)First of all, you should know that this is a low market cap and highly volatile coin. Manage your position size and leverage carefully; otherwise, you may face a big loss.
It seems to be completing a bearish triangle, and we are currently in wave **D**. If the price finds support again and moves up
See all ideas
Summarizing what the indicators are suggesting.
Oscillators
Neutral
Oscillators
Neutral
Summary
Neutral
Summary
Neutral
Summary
Neutral
Moving Averages
Neutral
Moving Averages
Neutral
Displays a symbol's price movements over previous years to identify recurring trends.
Frequently asked questions
The current price of F / TetherUS (F) is 0.003725 USDT — it has fallen −1.57% in the past 24 hours. Try placing this info into the context by checking out what coins are also gaining and losing at the moment and seeing F price chart.
F / TetherUS price has risen by 10.02% over the last week, its month performance shows a 16.16% increase, and as for the last year, F / TetherUS has decreased by −82.26%. See more dynamics on F price chart.
Keep track of coins' changes with our Crypto Coins Heatmap.
F / TetherUS (F) reached its highest price on Oct 25, 2025 — it amounted to 0.028530 USDT. Find more insights on the F price chart.
See the list of crypto gainers and choose what best fits your strategy.
F / TetherUS (F) reached the lowest price of 0.002610 USDT on Aug 14, 2026. View more F / TetherUS dynamics on the price chart.
See the list of crypto losers to find unexpected opportunities.
The safest choice when buying F is to go to a well-known crypto exchange. Some of the popular names are Binance, Coinbase, Kraken. But you'll have to find a reliable broker and create an account first. You can trade F right from TradingView charts — just choose a broker and connect to your account.
Crypto markets are famous for their volatility, so one should study all the available stats before adding crypto assets to their portfolio. Very often it's technical analysis that comes in handy. We prepared technical ratings for F / TetherUS (F): today its technical analysis shows the buy signal, and according to the 1 week rating F shows the neutral signal. And you'd better dig deeper and study 1 month rating too — it's buy. Find inspiration in F / TetherUS trading ideas and keep track of what's moving crypto markets with our crypto news feed.
F / TetherUS (F) is just as reliable as any other crypto asset — this corner of the world market is highly volatile. Today, for instance, F / TetherUS is estimated as 4.40% volatile. The only thing it means is that you must prepare and examine all available information before making a decision.
You can discuss F / TetherUS (F) with other users in our public chats, Minds or in the comments to Ideas.