Potential outside week and bearish potential for APXEntry conditions:
(i) lower share price for ASX:APX below the level of the potential outside week noted on 5th June (i.e.: below the level of $1.08).
Stop loss for the trade would be:
(i) above the high of the outside week on 2nd June (i.e.: above $1.285), should the trade activate.
In-depth trading ideas
APP is at the double bottom support zone.APP Appen is at the double bottom support zone as seen.
This is only a Technical Analysis, as this is an AI Ticker, but is currently showing a serious weak Trend despite other positive movers.
In my opinion is oversold and ripe for the risky buyer as the potential upside could be +35%
As you should know - please consult with your personal Investment Advisor before using any suggestions seen here, as this is mostly 1-5 years speculation.
However, should you consider my chart study helpful, sma
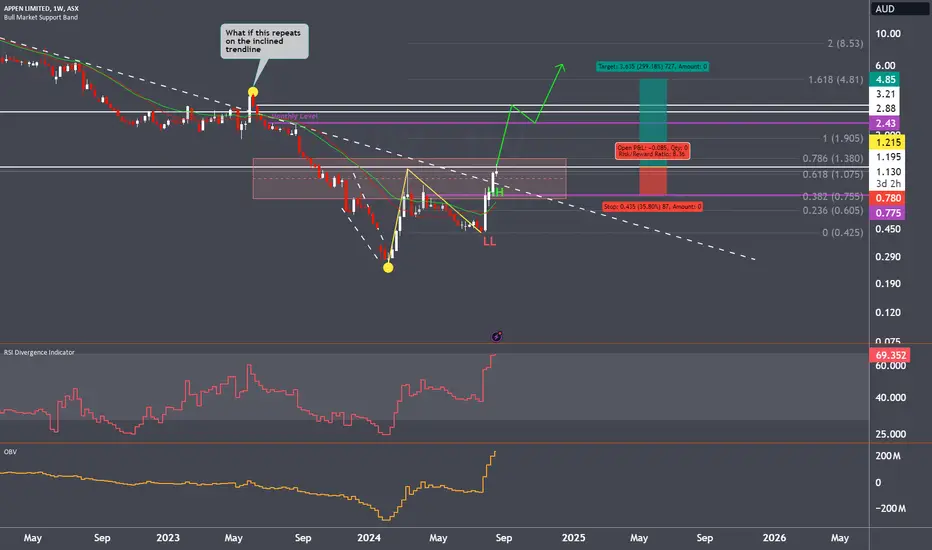
APX Rebound in Play?📈 “APX Rebound in Play? Eyeing the AUD 1.55 Resistance”
Appen (APX) has shown a significant uptick today, closing at AUD 1.040 (+5.58%) with a sharp volume spike (8.96M shares) that could suggest accumulation. After a long downtrend, price appears to be consolidating above key support near AUD 1.00, forming a potential base for reversal.
🔍 Chart Highlights:
Support Zone: AUD 1.000 – strong historical level holding.
Resistance Targets: → AUD 1.555 → AUD 1.655 → AUD 1.785
R/R Setup: Defined g
Finer Market Points: ASX Top 10 Momentum Stocks: 11 Mar 2024TSX:TSK ASX:APX NASDAQ:CUE LSE:IMC BSE:VMS LSE:DCC $360 ASX:ZIP NYSE:BOC MIL:BRE
Momentum leading shares are the market's best performers today. They are the fastest-growing shares on the ASX over the last 90 days. These companies can't get to be leaders without first appearing on our Launch Pad list.
The Launch Pad List is published weekly on Fridays.
Today's ASX's Top 10 Quarterly Momentum Stocks are:
Task Group Holdings Limited (TSK)
Appen Limited (APX)
CUE Energy Resou
Is APX ready for a counter-trend rally ?I have dissected the price action behaviour into two boxes as shown as Box of Tricks 1 and Box of Tricks 2. Why ?
When the previously posted PnF chart Price Target met, it alerted me to a potential end of the down move. No different than that of A2M chart!
Now, If one studies the first box(Box of Tricks 1), break below the support and continuation of the down trend is on display. Same can also be said to 2nd box as of this writing. But, the climactic volume action behaviour, shown with the bar
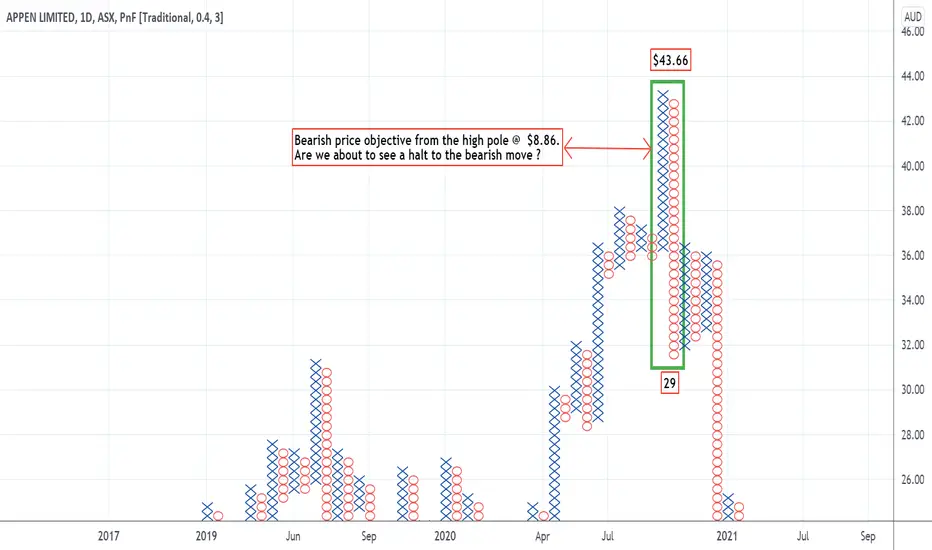
APX Bearish Price Objective Calculation.This is to demonstrate the educational side of the PnF charting in terms of bearish price objective calculation. Bearish count taken from the high pole and calculation from it is shown on the chart.
It(Bearish Price Objective) has been met today(29/09/2021)!
Let's now wait and see if the decline will halt at current levels ?
This analysis is for educational purposes only.
APPEN LIMITED DOUBLE BOTTOM IDEAHello guys. As you can see APPEN just double bottomed today. This bullish sign could pump APPEN to about 12AUD (8,85USD). The strong support at 9,58 AUD (7,07USD) should hold in the future and could be a good stoploss.
Do your own research / Trade at your own risk
NOT FINANCIAL ADVICE/RECOMMENDATION ( just my toughts about this stock) :)
Possible 30%/157% trade for Appen Limited / APXHello guys :). As you can see, APPEN dumped hard and hit crucial support after half year earnings results. If it holds the light purple support we could see a breakout to the first resistance line -10USD- (30% profit).
But there is certainly more possible like the second resistance line -11.15USD (42% profit) or even the third at -19.70-USD (157% profit). For those higher targets we would need some more volume and good news for APPEN.
Do your own research / Trade at your own risk
NOT FINANC
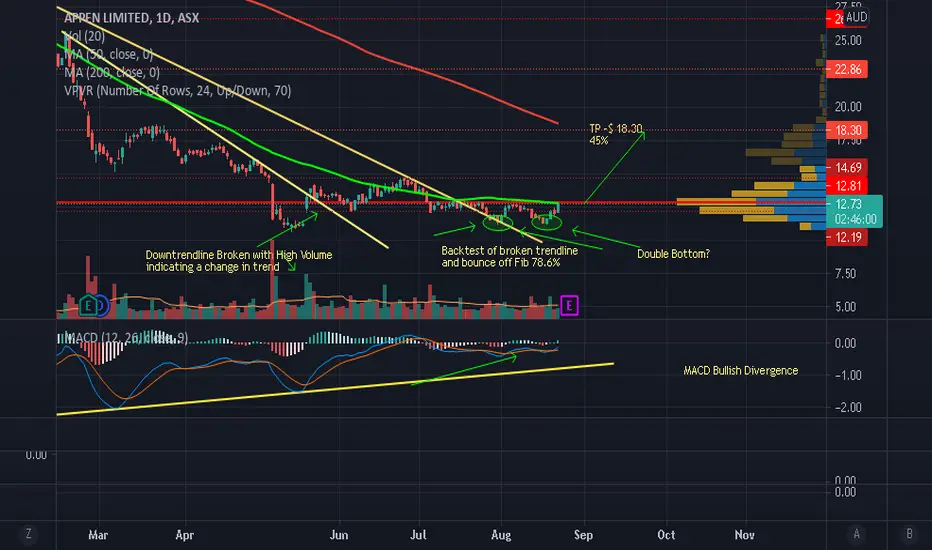
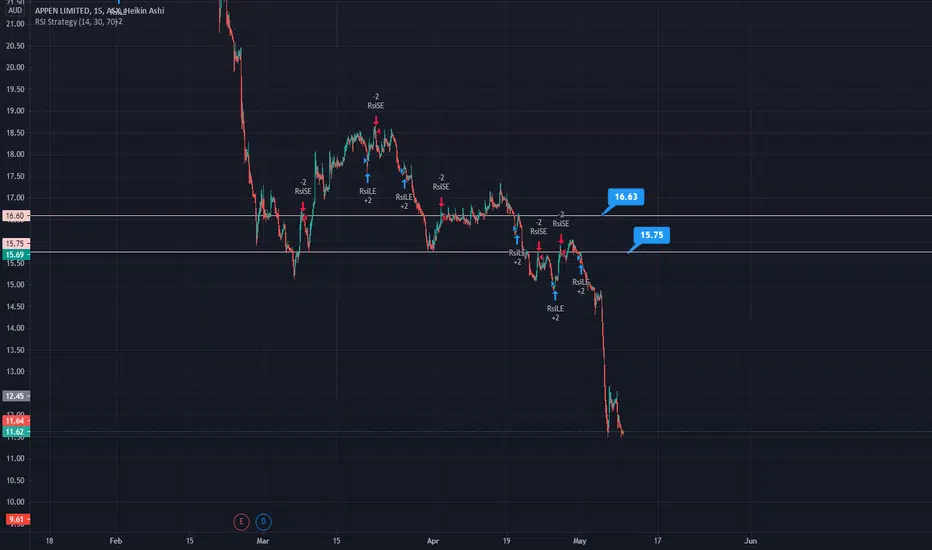
APX - Trade PlanAPX has been consolidating for a while but the price action is very telling. It plummeted hard since August 2020 after making a peak around $44.00 all the way down to $11.00 in May 2021, ( a Fibonacci retracement of 78.6% since its IPO). The recent price action indicates that the trend may have changed after it broke out of its downtrend line coupled with High Volume. Since its recent high of around $14.70, it pulled back to 78.6% and forming a potential double bottom which indicates that there
ASX: APX (Appen Ltd.): Breaking Out of Downtrend?APX has begun to give indications that it is breaking out of the long term downtrend (see the red trend-band borrowed from Mohammed_Seeker's post). Reasons to be cautious/remain bearish: 1. Stocks are in a seasonally bearish part of the year 2. APX looks like it has been rejected by the 50 day EMA and has been showing weak momentum 3. I do not see any major potentially bullish news events until the half-year results are announced in late August. Potential reasons to be bullish: 1. Yields (at lea
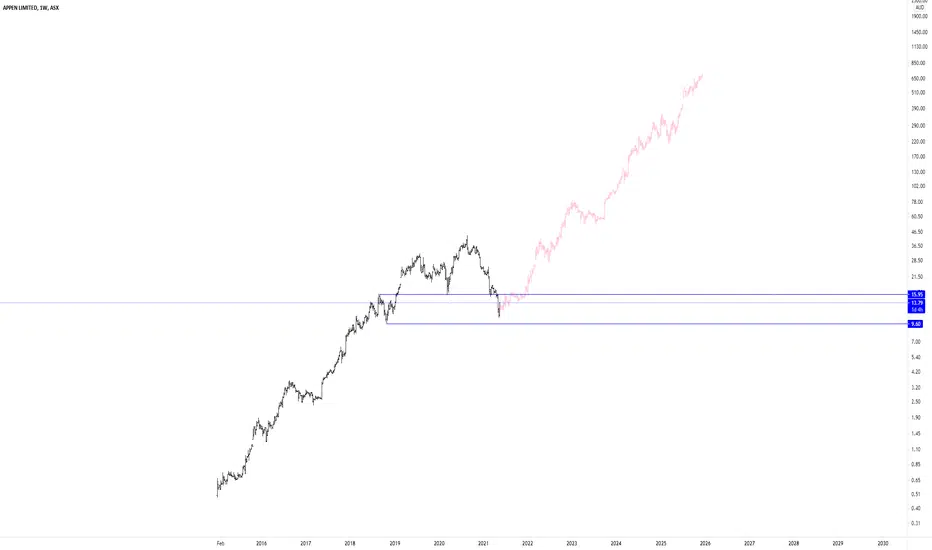
Catching the waveSometimes catching a wave is hard and other times it's about as easy as buying double A batteries from Woolworths. You pick when and where.
Jokes aside, Appen is setting itself up to bounce off of the 8/1 gann ratio and longer term trend we've seen building over a 12+ month period. The weekly RSI is ticking oversold territory and could work in the favour of this trade.
With an upcoming quarterly report it will be worth watching how it reacts.
Best of luck out there!