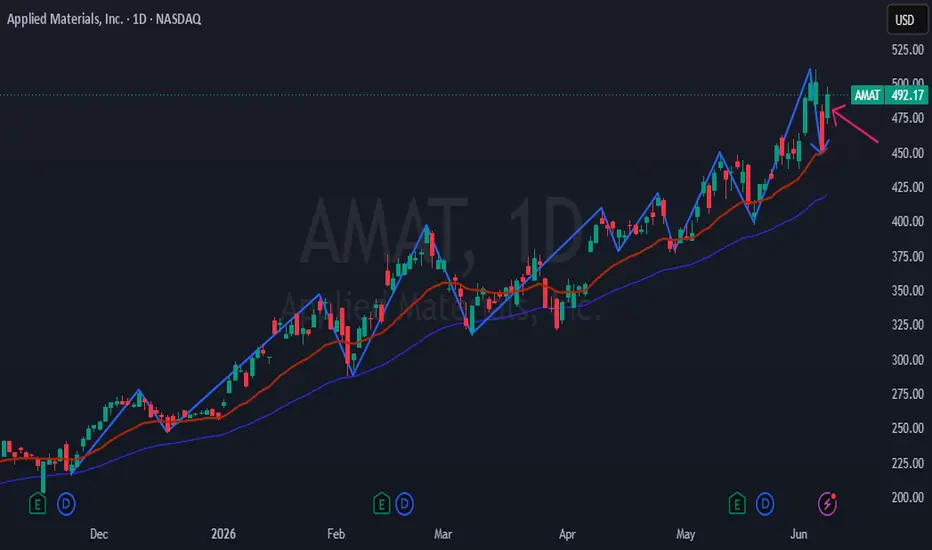
AMAT Pullback to Key Support Creates Buying OpportunityAMAT's recent retracement presents a potential buying opportunity as the stock remains in a strong uptrend, characterized by higher highs and higher lows while trading above well-aligned 20- and 50-day moving averages.
Applied Materials, Inc. is a $478.36 billion market capitalization company that
Applied Materials, Inc.
No trades
No trades
Compare with Applied Materials, Inc.
9.1 EUR
6.07 B EUR
24.59 B EUR
790.01 M
Next report date
—
Report period
—
EPS estimate
—
Revenue estimate
—
Details
Sector
Industry
CEO
Gary E. Dickerson
Website
Headquarters
Santa Clara
Founded
1967
IPO date
Oct 5, 1972
ISIN
US0382221051
CUSIP
038222105
FIGI
BBG000J003X5
Identifiers
ISIN US0382221051
Applied Materials, Inc. engages in provision of materials engineering solutions used to produce semiconductors. The firm also focuses on design, development, production, and servicing of the critical wafer fabrication tools used for customers to manufacture semiconductors. It operates through the following segments: Semiconductor Systems and Applied Global Services (AGS). The Semiconductor Systems segment includes designing, development, manufacturing and sale of equipment used to fabricate semiconductor chips referred to as integrated circuits. The AGS segment engages in provision of services, spares, and factory automation software to customer fabrication plants globally. The company was founded on November 10, 1967 and is headquartered in Santa Clara, CA.
AMAT Rose 300%+ to a Record, Then Fell. What Its Chart Says NowIt's no secret that semiconductor-related stocks like Applied Materials NASDAQ:AMAT have had a pretty rough week or so, with AMAT falling some 20% after hitting an all-time high just on June 30. Let’s see what Applied Materials' chart and fundamental analysis say could happen next with the semicon
AMAT | May, 2026 | Continued stock growth- Timeframe: Weekly
- Trade type: Buy stop order
- Price: 462.40
- Take Profit: Open
- Stop Loss: 438.00 (-5.30 %)
Idea: Long on a breakout above last week's high — bullish momentum continuation.
Entry: Buy stop above last week’s high.
Stop-loss: Below the low of the same candle.
If the weekly cand
AMAT, KLAC, LRCX - Be careful for BullsThese 3 stocks AMAT, KLAC, LRCX on the daily chart is going like a parabolic pattern (meaning an exponential, rapid rise in an asset's price that eventually curves upward, followed by a sudden, sharp reversal or crash). Since this type of pattern usually has no support built in the prior trend move,
Applied Materials (AMAT) Pullback Offers OpportunityApplied Materials (AMAT) is attracting buying interest following a recent pullback. The stock remains in a well-defined uptrend, characterized by a series of higher highs and higher lows while trading above its rising 20-day and 50-day moving averages, signaling continued bullish momentum.
Applied
Applied Materials: Uptrend Intact?Applied Materials has climbed most of the year, and some traders may think its uptrend remains intact.
The first pattern on today’s chart is the bullish gap on April 8. The provider of chip equipment tested the low of that session three weeks later and held. This week it appears to have made a high
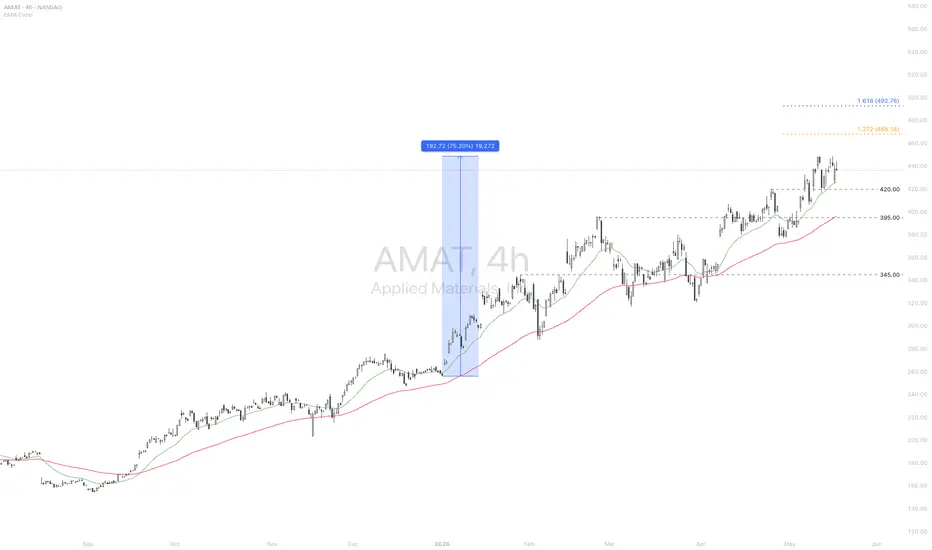
Applied Materials beats on AI-driven semiconductor demandAMAT | 4H Technical Analysis — May 18, 2026
Applied Materials reported Q2 FY2026 results after market close, beating expectations with revenue up 11% YoY to $7.91B and net income surging 31% to $2.81B. CEO Gary Dickerson noted that AI computing demand will be a sustained growth driver for years ah
See all ideas
Summarizing what the indicators are suggesting.
Neutral
SellBuy
Strong sellStrong buy
Strong sellSellNeutralBuyStrong buy
Neutral
SellBuy
Strong sellStrong buy
Strong sellSellNeutralBuyStrong buy
Neutral
SellBuy
Strong sellStrong buy
Strong sellSellNeutralBuyStrong buy
An aggregate view of professional's ratings.
Neutral
SellBuy
Strong sellStrong buy
Strong sellSellNeutralBuyStrong buy
Neutral
SellBuy
Strong sellStrong buy
Strong sellSellNeutralBuyStrong buy
Neutral
SellBuy
Strong sellStrong buy
Strong sellSellNeutralBuyStrong buy
Displays a symbol's price movements over previous years to identify recurring trends.
5.871% YTM
Maturity dateApr 1, 2047
Coupon4.35% (Fixed)
5.803% YTM
Maturity dateJun 1, 2050
Coupon2.75% (Fixed)
5.693% YTM
Maturity dateJun 15, 2041
Coupon5.85% (Fixed)
5.287% YTM
Maturity dateJan 15, 2036
Coupon4.60% (Fixed)
5.261% YTM
Maturity dateOct 1, 2035
Coupon5.10% (Fixed)
4.832% YTM
Maturity dateJan 15, 2031
Coupon4.00% (Fixed)
4.822% YTM
Maturity dateJun 1, 2030
Coupon1.75% (Fixed)
4.624% YTM
Maturity dateJun 15, 2029
Coupon4.80% (Fixed)
4.553% YTM
Maturity dateApr 1, 2027
Coupon3.30% (Fixed)
See all AP2 bonds
Weight0.79%
Market value18.23 B
Weight0.89%
Market value14.91 B
Weight1.96%
Market value8.85 B
Weight1.59%
Market value6.04 B
Weight0.67%
Market value5.78 B
Weight0.70%
Market value5.47 B
Weight2.26%
Market value3.85 B
Weight3.04%
Market value3.55 B
Weight5.06%
Market value3.53 B
Weight5.21%
Market value2.24 B
Weight1.96%
Market value1.89 B
Explore more ETFs
Frequently asked questions
The current price of AP2 is 481.5 EUR — it has decreased by −5.09% in the past 24 hours. Watch Applied Materials, Inc. stock price performance more closely on the chart.
Depending on the exchange, the stock ticker may vary. For instance, on FWB exchange Applied Materials, Inc. stocks are traded under the ticker AP2.
AP2 stock has risen by 3.40% compared to the previous week, the month change is a −5.87% fall, over the last year Applied Materials, Inc. has showed a 201.28% increase.
We've gathered analysts' opinions on Applied Materials, Inc. future price: according to them, AP2 price has a max estimate of 791.17 EUR and a min estimate of 373.61 EUR. Watch AP2 chart and read a more detailed Applied Materials, Inc. stock forecast: see what analysts think of Applied Materials, Inc. and suggest that you do with its stocks.
AP2 stock is 5.36% volatile and has beta coefficient of 0.75. Track Applied Materials, Inc. stock price on the chart and check out the list of the most volatile stocks — is Applied Materials, Inc. there?
Today Applied Materials, Inc. has the market capitalization of 374.28 B, it has decreased by −8.43% over the last week.
Yes, you can track Applied Materials, Inc. financials in yearly and quarterly reports right on TradingView.
Applied Materials, Inc. is going to release the next earnings report on Aug 13, 2026. Keep track of upcoming events with our Earnings Calendar.
AP2 earnings for the last quarter are 2.44 EUR per share, whereas the estimation was 2.28 EUR resulting in a 6.73% surprise. The estimated earnings for the next quarter are 2.99 EUR per share. See more details about Applied Materials, Inc. earnings.
Applied Materials, Inc. revenue for the last quarter amounts to 6.74 B EUR, despite the estimated figure of 6.55 B EUR. In the next quarter, revenue is expected to reach 7.90 B EUR.
AP2 net income for the last quarter is 2.39 B EUR, while the quarter before that showed 1.71 B EUR of net income which accounts for 0.00% change. Track more Applied Materials, Inc. financial stats to get the full picture.
Yes, AP2 dividends are paid quarterly. The last dividend per share was 0.46 EUR. As of today, Dividend Yield (TTM)% is 0.36%. Tracking Applied Materials, Inc. dividends might help you take more informed decisions.
Applied Materials, Inc. dividend yield was 0.78% in 2025, and payout ratio reached 20.55%. The year before the numbers were 0.81% and 17.66% correspondingly. See high-dividend stocks and find more opportunities for your portfolio.
As of Jul 25, 2026, the company has 36.5 K employees. See our rating of the largest employees — is Applied Materials, Inc. on this list?
EBITDA measures a company's operating performance, its growth signifies an improvement in the efficiency of a company. Applied Materials, Inc. EBITDA is 7.87 B EUR, and current EBITDA margin is 31.39%. See more stats in Applied Materials, Inc. financial statements.
Like other stocks, AP2 shares are traded on stock exchanges, e.g. Nasdaq, Nyse, Euronext, and the easiest way to buy them is through an online stock broker. To do this, you need to open an account and follow a broker's procedures, then start trading. You can trade Applied Materials, Inc. stock right from TradingView charts — choose your broker and connect to your account.
Investing in stocks requires a comprehensive research: you should carefully study all the available data, e.g. company's financials, related news, and its technical analysis. So Applied Materials, Inc. technincal analysis shows the sell today, and its 1 week rating is strong buy. Since market conditions are prone to changes, it's worth looking a bit further into the future — according to the 1 month rating Applied Materials, Inc. stock shows the buy signal. See more of Applied Materials, Inc. technicals for a more comprehensive analysis.
If you're still not sure, try looking for inspiration in our curated watchlists.