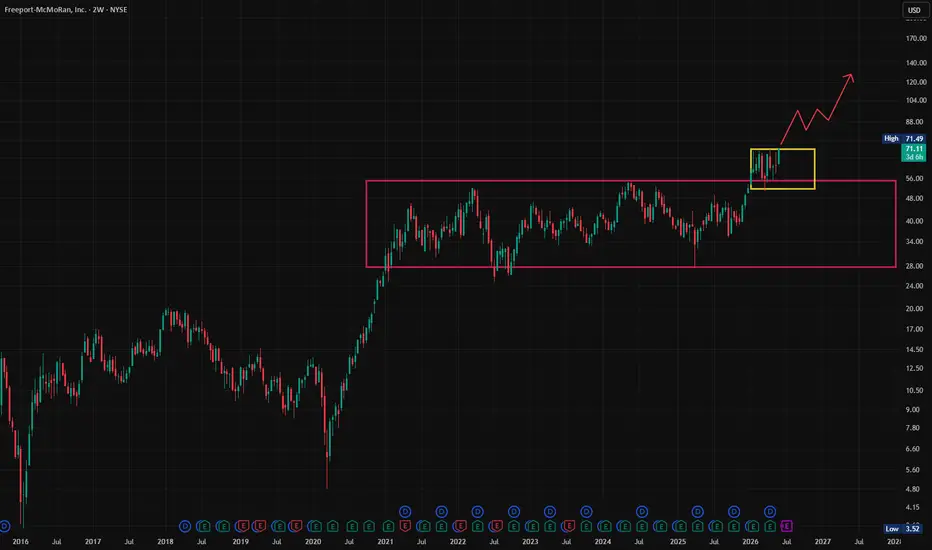
$FCX – The Copper Supercycle Breakout!!?The Pattern: NYSE:FCX has completed a massive, 10-year W-Bottom. The first trough was set in 2016 at **$3.52**, followed by a second higher low in 2020 at $4.82. The recent monthly close above the $60.00 neckline validates this multi-year trend reversal.
The Log Target: On a logarithmic scale, th
Freeport-McMoRan, Inc.
No trades
No trades
Compare with Freeport-McMoRan, Inc.
Key facts today
Wells Fargo kept an Overweight on Freeport-McMoRan (FCX) and raised its price target to $70 from $68, updating the bank’s valuation and outlook for the stock. 1
1.87 B EUR
21.39 B EUR
1.43 B
Last report date
Jul 23, 2026
Report period
Q2 2026
EPS
0.65 EUR
Revenue
6.15 B EUR
Earnings call summary
Q2 2026 saw strong operational and financial performance, with U.S. operations driving a 65% increase in net income year-over-year and significant progress at Grasberg. The company is advancing major growth projects, maintaining a robust balance sheet, and expects higher sales and cash flows in the second half of 2026 and beyond.
Details
Sector
Industry
CEO
Kathleen L. Quirk
Website
Headquarters
Phoenix
Founded
1987
IPO date
May 5, 1988
ISIN
US35671D8570
CUSIP
35671D857
FIGI
BBG000FDHLM5
Identifiers
ISIN US35671D8570
Freeport-McMoRan, Inc. engages in the mining of copper, gold, and molybdenum. It operates through the following segments: U.S. Copper Mines, South America Operations, Indonesia Operations, Molybdenum Mines, U.S. Rod and Refining, Atlantic Copper, and Corporate and Other. The U.S. Copper Mines segment operates open-pit copper mines in Morenci, Bagdad, Safford, Sierrita, Miami in Arizona and Chino, and Tyrone in New Mexico. The South America Operations segment includes Cerro Verde in Peru and El Abra in Chile. The Indonesia Operations segment handles the operations of the Grasberg minerals district that produce copper concentrate containing significant quantities of gold and silver. The Molybdenum Mines segment includes the Henderson underground mine and Climax open pit mine, both in Colorado. The U.S. Rod and Refining segment consists of copper conversion facilities located in North America and includes refinery and rod mills. The Atlantic Copper segment smelts and refines copper concentrate and markets refined copper and precious metals in slimes. The Corporate and Other segment offers other mining and eliminations, oil and gas operations, and other corporate and elimination items. The company was founded by James R. Moffett on November 10, 1987, and is headquartered in Phoenix, AZ.
FCX Long — $FCX pulling back to the breakout shelf at $69, HTF uOn the 4h chart, FCX has established a clear uptrend from the late-April low near $56 through successive higher highs and higher lows, culminating in a push to $72+ in early June. The most recent structural event is a mild pullback from that $72 high into the $69–70 zone, which previously acted as a
$FCX Breakout and bullish ascending triangleLooking at the charts for FCX today and we can see that we have a huge long term sideways price action over the past 20 years. We're the current price is looks like a steady increase in volume and a build up on the RSI.
I'm expecting that we might see another retracement, but ultimately building to
Freeport Flirts with Record HighsFreeport-McMoRan has been challenging a long-term level, and some traders may think a breakout is coming.
The first pattern on today’s chart is the series of higher lows since mid-March, which may reveal buying pressure.
Second is the previous all-time high of $63.62 from 2008. The copper miner ju
$FCX NEW ALL-TIME HIGH!I said in before that I was highly confident the stock would double from there, either this year or next year.
With this breakout to new highs, I believe the odds have increased significantly that it happens this year.
Bought a major position at the bottom and will sell it all in the highs.
FCX: bullish potential for 2026Among a few bullish trend structures we are currently watching and planning to participate on the long side.
Price has entered and already reacted from an important mid-term support zone at 54–50, where we expect a higher low formation and continuation toward the larger degree resistance zone at 7
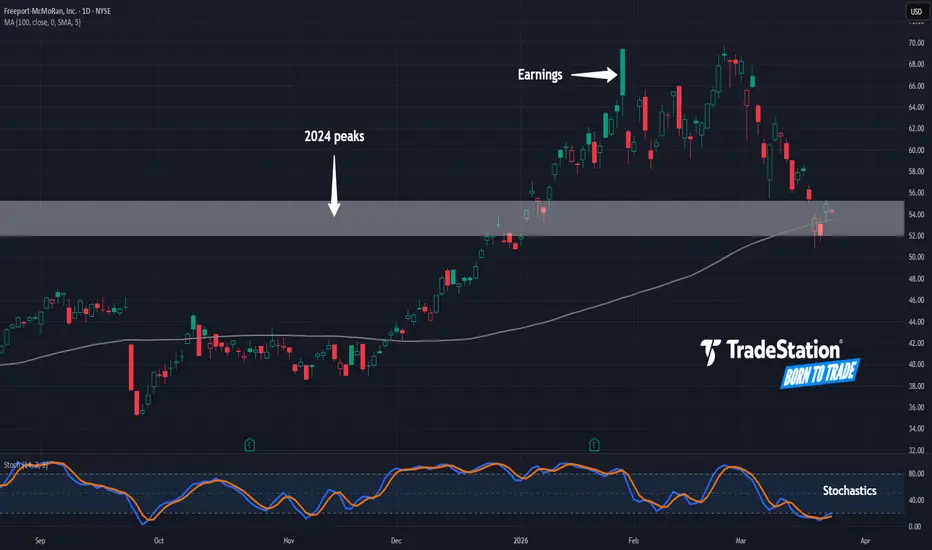
Freeport May Be OversoldMetal producers like Freeport-McMoRan outperformed before the Iran war, and now some traders may think the copper stock is oversold.
The first pattern on today’s chart is the price range between $52 and $55.30, which matches long-term peaks from 2024. With FCX holding those old highs, is resistance
FCX - Pick of the Week, March 2FCX is currently exhibiting a clean, persistent weekly uptrend, supported by:
• Strong higher highs and higher lows on the weekly timeframe
• Weekly momentum readings consistent with trend continuation
• Price action pressing into new highs rather than mean reverting
From a macro perspective, FCX re
FCX - We had a great month, can we continue with the uptrend?FCX
Looking for a potential buy!
🔍 Technical Context:
FCX had a tremendous up-beat with 24% increase in the stock just in march!
MACD Bullish Crossover: A clear bullish cross on the MACD confirmed upward momentum.
RSI Strength: The RSI remains in bullish territory, signaling further upside poten
See all ideas
Summarizing what the indicators are suggesting.
Neutral
SellBuy
Strong sellStrong buy
Strong sellSellNeutralBuyStrong buy
Neutral
SellBuy
Strong sellStrong buy
Strong sellSellNeutralBuyStrong buy
Neutral
SellBuy
Strong sellStrong buy
Strong sellSellNeutralBuyStrong buy
An aggregate view of professional's ratings.
Neutral
SellBuy
Strong sellStrong buy
Strong sellSellNeutralBuyStrong buy
Neutral
SellBuy
Strong sellStrong buy
Strong sellSellNeutralBuyStrong buy
Neutral
SellBuy
Strong sellStrong buy
Strong sellSellNeutralBuyStrong buy
Displays a symbol's price movements over previous years to identify recurring trends.
6.464% YTM
Maturity dateApr 14, 2052
Coupon6.20% (Fixed)
6.083% YTM
Maturity dateMar 15, 2043
Coupon5.45% (Fixed)
5.682% YTM
Maturity dateMar 15, 2034
Coupon6.13% (Fixed)
5.618% YTM
Maturity dateApr 14, 2032
Coupon5.32% (Fixed)
5.438% YTM
Maturity dateSep 1, 2029
Coupon5.25% (Fixed)
5.392% YTM
Maturity dateJun 1, 2031
Coupon9.50% (Fixed)
5.389% YTM
Maturity dateNov 14, 2034
Coupon5.40% (Fixed)
5.259% YTM
Maturity dateNov 1, 2027
Coupon7.13% (Fixed)
5.100% YTM
Maturity dateAug 1, 2030
Coupon4.63% (Fixed)
5.079% YTM
Maturity dateSep 1, 2027
Coupon5.00% (Fixed)
5.003% YTM
Maturity dateMar 1, 2030
Coupon4.25% (Fixed)
See all FPMB bonds
Weight0.12%
Market value2.87 B
Weight0.14%
Market value2.35 B
Weight0.14%
Market value1.22 B
Weight0.14%
Market value1.12 B
Weight0.34%
Market value859.87 M
Weight5.41%
Market value458.92 M
Weight4.82%
Market value351.98 M
Weight2.92%
Market value323.58 M
Weight5.90%
Market value265.21 M
Weight0.14%
Market value228.04 M
Weight0.14%
Market value214.81 M
Explore more ETFs
Frequently asked questions
The current price of FPMB is 55.37 EUR — it has decreased by −0.54% in the past 24 hours. Watch Freeport-McMoRan, Inc. stock price performance more closely on the chart.
Depending on the exchange, the stock ticker may vary. For instance, on FWB exchange Freeport-McMoRan, Inc. stocks are traded under the ticker FPMB.
FPMB stock has risen by 8.19% compared to the previous week, the month change is a −2.07% fall, over the last year Freeport-McMoRan, Inc. has showed a 45.79% increase.
We've gathered analysts' opinions on Freeport-McMoRan, Inc. future price: according to them, FPMB price has a max estimate of 72.08 EUR and a min estimate of 43.95 EUR. Watch FPMB chart and read a more detailed Freeport-McMoRan, Inc. stock forecast: see what analysts think of Freeport-McMoRan, Inc. and suggest that you do with its stocks.
FPMB reached its all-time high on Jun 2, 2026 with the price of 62.05 EUR, and its all-time low was 3.25 EUR and was reached on Jan 20, 2016. View more price dynamics on FPMB chart.
See other stocks reaching their highest and lowest prices.
FPMB stock is 0.54% volatile and has beta coefficient of 1.34. Track Freeport-McMoRan, Inc. stock price on the chart and check out the list of the most volatile stocks — is Freeport-McMoRan, Inc. there?
Today Freeport-McMoRan, Inc. has the market capitalization of 79.11 B, it has decreased by −3.16% over the last week.
Yes, you can track Freeport-McMoRan, Inc. financials in yearly and quarterly reports right on TradingView.
Freeport-McMoRan, Inc. is going to release the next earnings report on Oct 15, 2026. Keep track of upcoming events with our Earnings Calendar.
FPMB earnings for the last quarter are 0.65 EUR per share, whereas the estimation was 0.54 EUR resulting in a 20.25% surprise. The estimated earnings for the next quarter are 0.63 EUR per share. See more details about Freeport-McMoRan, Inc. earnings.
Freeport-McMoRan, Inc. revenue for the last quarter amounts to 6.15 B EUR, despite the estimated figure of 5.88 B EUR. In the next quarter, revenue is expected to reach 6.46 B EUR.
FPMB net income for the last quarter is 861.60 M EUR, while the quarter before that showed 756.47 M EUR of net income which accounts for 0.00% change. Track more Freeport-McMoRan, Inc. financial stats to get the full picture.
Yes, FPMB dividends are paid quarterly. The last dividend per share was 0.13 EUR. As of today, Dividend Yield (TTM)% is 0.96%. Tracking Freeport-McMoRan, Inc. dividends might help you take more informed decisions.
Freeport-McMoRan, Inc. dividend yield was 1.18% in 2025, and payout ratio reached 39.41%. The year before the numbers were 1.58% and 46.04% correspondingly. See high-dividend stocks and find more opportunities for your portfolio.
As of Jul 25, 2026, the company has 29 K employees. See our rating of the largest employees — is Freeport-McMoRan, Inc. on this list?
EBITDA measures a company's operating performance, its growth signifies an improvement in the efficiency of a company. Freeport-McMoRan, Inc. EBITDA is 6.84 B EUR, and current EBITDA margin is 32.09%. See more stats in Freeport-McMoRan, Inc. financial statements.
Like other stocks, FPMB shares are traded on stock exchanges, e.g. Nasdaq, Nyse, Euronext, and the easiest way to buy them is through an online stock broker. To do this, you need to open an account and follow a broker's procedures, then start trading. You can trade Freeport-McMoRan, Inc. stock right from TradingView charts — choose your broker and connect to your account.
Investing in stocks requires a comprehensive research: you should carefully study all the available data, e.g. company's financials, related news, and its technical analysis. So Freeport-McMoRan, Inc. technincal analysis shows the buy rating today, and its 1 week rating is strong buy. Since market conditions are prone to changes, it's worth looking a bit further into the future — according to the 1 month rating Freeport-McMoRan, Inc. stock shows the buy signal. See more of Freeport-McMoRan, Inc. technicals for a more comprehensive analysis.
If you're still not sure, try looking for inspiration in our curated watchlists.