
 Long
LongIn-depth trading ideas
Long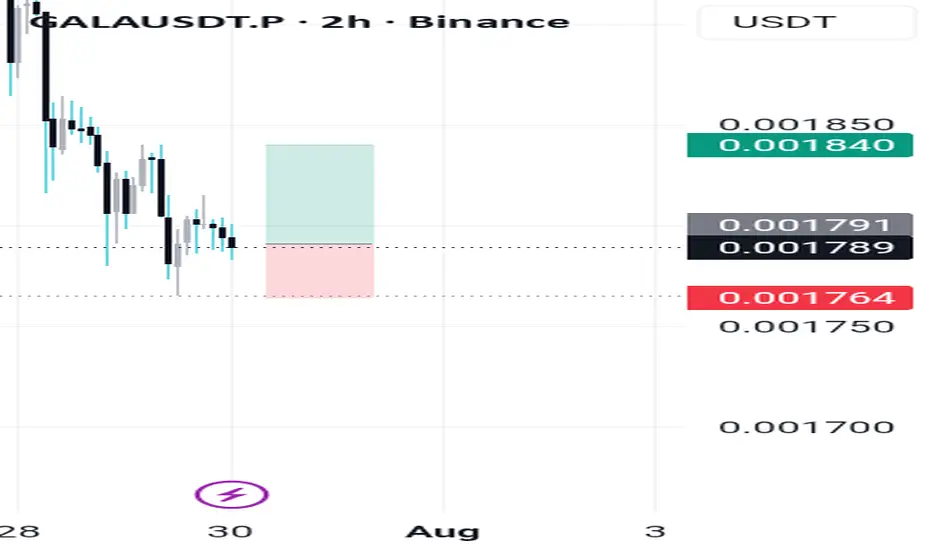
GalaActs 3:15 — "And killed the Prince of life, whom God hath raised from the dead; whereof we are witnesses."
GALA was slain. Left for dead in the marketplace. The investors wept.
But the raising hath begun. Quietly. Without announcement. Without fanfare.
Those who kept vigil at the tomb shall be witnesses.
0.00209 is not a price. It is a resurrection stone.
Ye are witnesses. Remember this day.
Long
#GALAUSDT — Holding the Last Fortres, Recovery or Final Break#GALA
The price is moving within a descending channel on the 1-hour timeframe and has reached the lower boundary. It is now poised for a bounce and is expected to retest this boundary.
The Relative Strength Index (RSI) indicates a downward trend, which is likely to continue given the overbought conditions.
There is a key support zone in green at 0.001675. The price has bounced off this zone several times, making it a strong support level.
The price is trending towards the 100-period moving average, which we are approaching. This trend supports an upward move.
Entry Price: 0.001777
Target 1: 0.001790
Target 2: 0.001819
Target 3: 0.001844
Stop Loss: At the resistance zone in green
Remember this simple rule: Money management.
Any questions? Please leave a comment.
Thank you.
Long Short
Short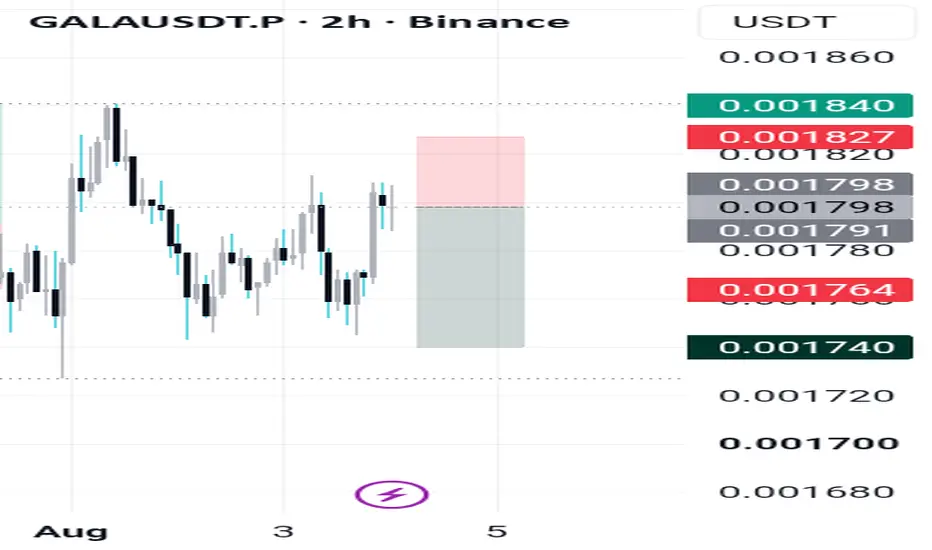
GALA at macro floor: base recovery toward $0.002164The Macro Picture 🗺️
GALA ground down from the $0.004540 high all the way to the $0.001729 macro floor and has flattened onto it at $0.001763. The long, steady bleed has given way to a base right on support — exhaustion rather than continuation.
The Setup ⚙️
The Accumulation Zone 🟢
$0.001729–0.001763 is where the selling has dried up. Macro Support has held on retest, and this is the demand shelf a recovery would build from.
The Decision Point 🔴
$0.004540 (Local High) is the structural gate far above. Before it, the $0.002164 measured-move target is the first objective — reclaiming it proves buyers are stepping back in.
The Roadmap 🛣️
Hold the $0.001729 floor → recover toward $0.002164 as the first leg up. Invalidation is a clean daily close below $0.001729 — that voids the accumulation thesis.
This is a textbook DCA Accumulation Zone setup: scale in across the $0.001729–0.001763 band and let the base do the work.
#GALA #GALAGames #crypto #trading #TA #3Commas #DCA
Long
#GALAUSDT — Holding the Last Fortres, Recovery or Final Break#GALA
The price is moving within a descending channel on the 1-hour timeframe and has reached the lower boundary. It is now poised for a bounce and is expected to retest this boundary.
The Relative Strength Index (RSI) indicates a downward trend, which is likely to continue given the overbought conditions.
There is a key support zone in green at 0.001928. The price has bounced off this zone several times, making it a strong support level.
The price is trending towards the 100-period moving average, which we are approaching. This trend supports an upward move.
Entry Price: 0.001984
Target 1: 0.002000
Target 2: 0.002020
Target 3: 0.002042
Stop Loss: At the resistance zone in green
Remember this simple rule: Money management.
Any questions? Please leave a comment.
Thank you.
Long
#GALAUSDT — Holding the Last Fortres, Recovery or Final Break#GALA
The price is moving within a descending channel on the 1-hour timeframe and has reached the lower boundary. It is now poised for a bounce and is expected to retest this boundary.
The Relative Strength Index (RSI) indicates a downward trend, which is likely to continue given the overbought conditions.
There is a key support zone in green at 0.001928, and the price has bounced off this zone several times, making it a strong support level.
The price is trending towards the 100-period moving average, which we are approaching. This trend supports an upward move.
Entry Price: 0.002080
Target 1: 0.002114
Target 2: 0.002169
Target 3: 0.002226
Stop Loss: At the resistance zone in green
Remember this simple rule: Money management.
Any questions? Please leave a comment.
Thank you.
Long
#GALAUSDT — Holding the Last Fortres, Recovery or Final Break#GALA
The price is moving within a descending channel on the 1-hour timeframe and has reached the lower boundary. It is now poised for a bounce and is expected to retest this boundary.
The Relative Strength Index (RSI) indicates a downward trend, which is likely to continue given the overbought conditions.
There is a key support zone in green at 0.001940. The price has bounced off this zone several times, making it a strong support level.
The price is trending towards the 100-period moving average, which we are approaching. This trend supports an upward move.
Entry Price: 0.002020
Target 1: 0.002060
Target 2: 0.002096
Target 3: 0.002137
Stop Loss: At the resistance zone in green
Remember this simple rule: Money management.
Any questions? Please leave a comment.
Thank you.
Long
GALA: liquidity sweep before the next leg downThe Macro Picture 🗺️
GALA has been in a relentless descending structure since the May $0.00455 peak, printing a textbook sequence of lower highs and lower lows with barely a pause. Every bounce has been shallow and quickly sold — the market is defined by persistent supply, and buyers have shown no appetite to defend any level for long. Price has now pressed to fresh lows near $0.00200 with RSI weak around 37 and still pointed down. Until the structure of lower highs breaks, the path of least resistance points straight toward the next liquidity pocket below.
The Setup ⚙️
The Ceiling: The $0.0024 decision line is where bears are defending. As marked by the red projection, this former support has flipped into resistance and capped every recent attempt to recover.
The Rejection: Above sits the $0.0024–0.0028 supply block. Price would need to reclaim this entire band to neutralize the downtrend, and momentum offers no support for that case yet.
The Trigger: A clean break of the $0.0020 lows would clear out the last of the over-leveraged longs and open the path of least resistance toward the $0.0018 macro floor.
The Roadmap: Primary target sits at $0.0018 — the red projection points there as the natural draw on liquidity below the range. Invalidation: a sustained 4H close back above $0.0024 would invalidate this bearish thesis and signal a structural reset in favor of the bulls.
More setups in profile.
#GALA #CRYPTO #Gaming #Altcoins #TechnicalAnalysis
Short
GALA / GALAUSDT Long Setup | Breaker Block ReclaimMARKET ANALYSIS
GALA is currently reacting from a key technical area highlighted on the chart.
As long as the protected support zone remains intact, the bullish market structure remains valid and higher liquidity targets may continue to attract price action.
A breakdown below the invalidation level would weaken the current bullish scenario and require a reassessment of market conditions.
📍 Entry, Stop Loss and Take Profit levels are marked directly on the chart.
━━━━━━━━━━━━━━
⚠️ DISCLAIMER
This publication is provided solely for educational and market observation purposes.
Nothing contained in this analysis should be considered financial advice, investment advice, or a recommendation to buy or sell any financial instrument.
All trading and investment decisions remain solely the responsibility of the individual trader.
Always conduct your own research and apply proper risk management before entering any position.
━━━━━━━━━━━━━━
🎯 PARALOG
▪️Crypto Market Analysis
▪️BTC Futures Signals
▪️Bitcoin & Altcoin Market Analysis
Precision • Momentum • Timing
━━━━━━━━━━━━━━
Exchange: #MEXC Futures
#bitcoin #btc #crypto #futures #technicalanalysis
Long
#GALAUSDT — Holding the Last Fortres, Recovery or Final Break#GALA
The price is moving within a descending channel on the 1-hour timeframe and has reached the lower boundary. It is now poised for a bounce and is expected to retest this boundary.
The Relative Strength Index (RSI) indicates a downward trend, which is likely to continue given the overbought conditions.
There is a key support zone in green at 0.002144. The price has bounced off this zone several times, making it a strong support level.
The price is trending towards the 100-period moving average, which we are approaching. This trend supports an upward move.
Entry Price: 0.002290
Target 1: 0.002314
Target 2: 0.002390
Target 3: 0.002485
Stop Loss: At the resistance zone in green
Remember this simple rule: Money management.
Any questions? Please leave a comment.
Thank you.
Long
#GALAUSDT — Holding the Last Fortres, Recovery or Final Break#GALA
The price is moving within a descending channel on the 1-hour timeframe and has reached the lower boundary. It is now poised for a bounce and is expected to retest this boundary.
The Relative Strength Index (RSI) indicates a downward trend, which is likely to continue given the overbought conditions.
There is a key support zone (in green) at 0.00229. The price has bounced off this zone several times, making it a strong support level.
The price is trending towards the 100-period moving average, which we are approaching. This trend supports an upward move.
Entry Price: 0.00244
Target 1: 0.00248
Target 2: 0.00257
Target 3: 0.00268
Stop Loss: At the resistance zone (in green)
Remember this simple rule: Money management.
Any questions? Please leave a comment.
Thank you.
Long
link tredingviewShort‑term trend: Bearish / under pressure
The price has been trading around 58.8Kto58.8Kto60.0K.
$60,000 is currently an important psychological level.
Main sources of pressure:
Outflows from spot Bitcoin ETFs
Risk‑off sentiment in markets and expectations of a hawkish Federal Reserve
Liquidations and deleveraging in the crypto market
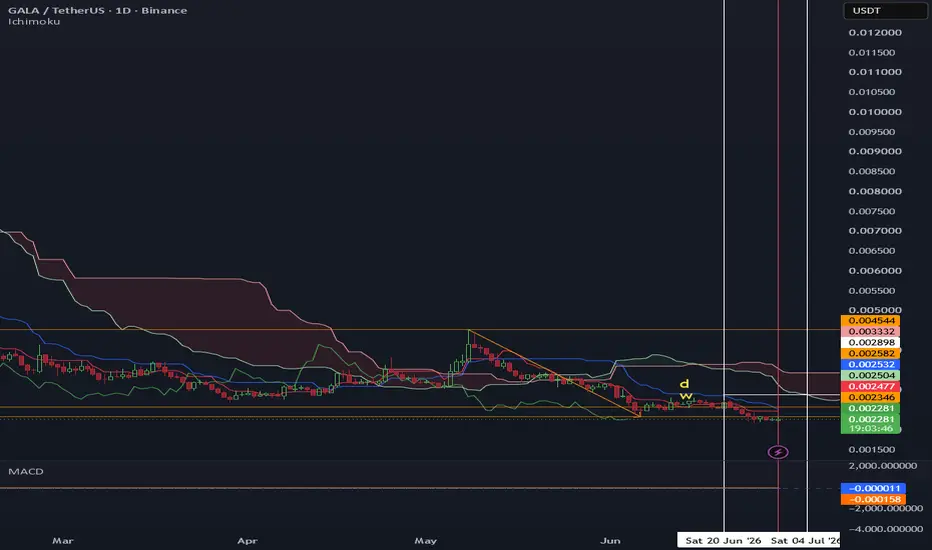
GALA Bullish Divergence Bounce ?GALA is beginning to show early signs that selling momentum may be fading, with a large bullish divergence forming on the 4-hour timeframe. While price has continued to trade near the lows of its current range, momentum indicators are failing to confirm the new lows, suggesting that bearish pressure is weakening. Bullish divergences often appear near market bottoms and can provide an early indication that a reversal or relief rally is developing.
Price is currently trading around the overall range low, making this a pivotal technical location. If buyers are able to defend this support and push price back above the range low on a closing basis, it would confirm that the recent move below support was rejected. Such a reclaim would significantly improve the probability of a rotational bounce within the broader trading range.
Should this scenario play out, the first upside objective would be the daily support level, which would become the next area of technical interest. Reaching this zone would represent a healthy recovery from current prices and could establish the foundation for further bullish continuation if momentum continues to improve.
For now, GALA remains at a key decision point. The bullish divergence suggests downside momentum is weakening, but confirmation is still required through a reclaim of the range low. If buyers can achieve this, the probability favors a short-term recovery rally, making the current region one of the most important technical areas to monitor in the sessions ahead.
Long
#GALAUSDT — Holding the Last Fortres, Recovery or Final Break#GALA
The price is moving within a descending channel on the 1-hour timeframe and has reached the lower boundary. It is now poised for a bounce and is expected to retest this boundary.
The Relative Strength Index (RSI) indicates a downward trend, which is likely to continue given the overbought conditions.
There is a key support zone (in green) at 0.00244. The price has bounced off this zone several times, making it a strong support level.
The price is trending towards the 100-period moving average, which we are approaching. This trend supports an upward move.
Entry Price: 0.00260
Target 1: 0.00263
Target 2: 0.00266
Target 3: 0.00269
Stop Loss: At the resistance zone (in green)
Remember this simple rule: Money management.
Any questions? Please leave a comment.
Thank you.
Long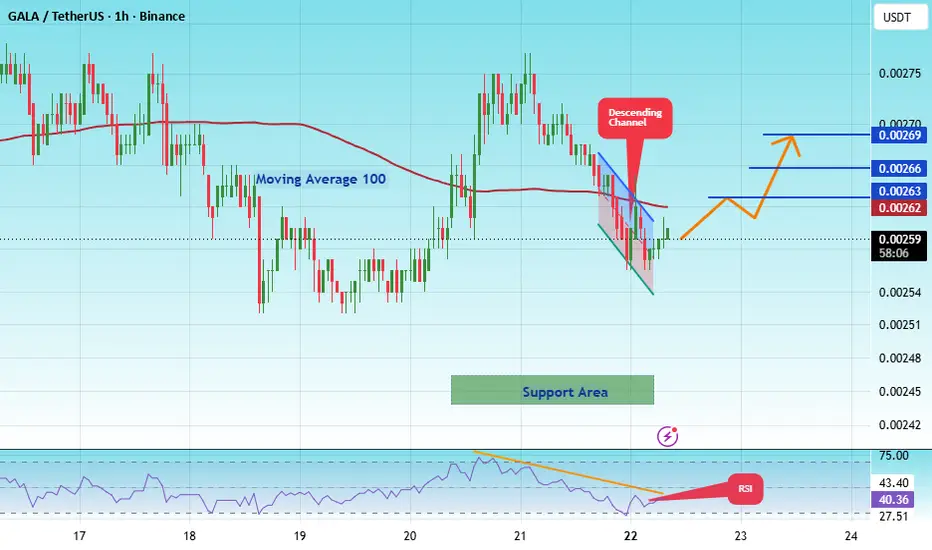
#GALAUSDT — Holding the Last Fortres, Recovery or Final Break#GALA
The price is moving within a descending channel on the 1-hour timeframe and has reached the lower boundary. It is now poised for a bounce and is expected to retest this boundary.
The Relative Strength Index (RSI) indicates a downward trend, which is likely to continue given the overbought conditions.
A key support zone (in green) has been identified at 0.7730. The price has bounced off this zone several times, making it a strong support level.
The price is trending towards the 100-period moving average, which we are approaching. This trend supports an upward move.
Entry Price: 0.00254
Target 1: 0.00259
Target 2: 0.00267
Target 3: 0.00274
You can close at the second target or wait for the third target. The choice is yours.
Stop Loss: At the resistance zone (in green).
Remember this simple rule: Money Management.
Any questions? Please leave a comment.
Thank you.
Long
GALA Still Trapped Inside the Long-Term DowntrendGALA remains inside a well-defined descending channel, and despite several recovery attempts.
After rejecting from the upper half of the recent recovery range, price has rotated back toward the lower support region around 0.0026, which is currently acting as the last major defense for bulls. This area becomes critical because losing it would likely open the door for another leg lower within the broader bearish structure.
For now, the market is attempting to stabilize at support, but the overall trend remains weak until GALA can reclaim the descending trendline and break back above the 0.618 Fibonacci resistance zone.
What I'm Watching
🟢 Support: 0.00259 → 0.00234
🔴 Resistance: 0.00319 → 0.00355 → 0.00453
📉 Trend: Bearish while below channel resistance
⚠️ A daily close above the descending trendline would be the first sign that a larger trend reversal may be developing.

#GALAUSDT — Holding the Last Fortres, Recovery or Final Break#GALA
The price is moving within a descending channel on the 1-hour timeframe and has reached the lower boundary. It is now poised for a bounce and is expected to retest this boundary.
The Relative Strength Index (RSI) indicates a downward trend, which is likely to continue given the overbought conditions.
There is a key support zone in green at 0.00238. The price has bounced off this zone several times, making it a strong support level.
The price is trending towards the 100-period moving average, which we are approaching. This trend supports an upward move.
Entry Price: 0.00260
Target 1: 0.00267
Target 2: 0.00273
Target 3: 0.00280
Stop Loss: At the resistance zone in green
Remember this simple rule: Money management.
Any questions? Please leave a comment.
Thank you.
Long
#GALAUSDT — Holding the Last Fortres, Recovery or Final Break#GALA
The price is moving within a descending channel on the 1-hour timeframe and has reached the lower boundary. It is now poised for a bounce and is expected to retest this boundary.
The Relative Strength Index (RSI) indicates a downward trend, which is likely to continue given the overbought conditions.
There is a key support zone (in green) at 0.00275. The price has bounced off this zone several times, making it a strong support level.
The price is trending towards the 100-period moving average, which we are approaching. This trend supports an upward move.
Entry Price: 0.00308
First Target: 0.00312
Second Target: 0.00319
Third Target: 0.00329
You can stop at the first and second targets and close the price, or continue towards the third target. Stop Loss: At the resistance zone (in green).
Remember this simple rule: Money Management.
Any questions? Please leave a comment.
Thank you.
Long
#GALAUSDT — Holding the Last Fortres, Recovery or Final Break#GALA
The price is moving within a descending channel on the hourly timeframe. It has reached the lower boundary and is trending towards a bounce. A retest of this boundary is expected.
The Relative Strength Index (RSI) indicates a downward trend, and this trend is likely to continue due to the overbought condition.
A key support zone (in green) has been found at 0.00300. The price has bounced off this zone several times, making it a strong support level.
The price is trending towards the 100-period moving average, which we are approaching. This trend supports an upward move.
Entry Price: 0.00330
Target 1: 0.00349
Target 2: 0.00359
Target 3: 0.00369
You can close at the second target or wait for the third target to be reached. The choice is yours.
Stop Loss: At the resistance zone (in green).
Remember this simple rule: Money management.
Any questions? Please leave a comment.
Thank you.
Long
GalaIf gala breaks the two hour resistance, their is high chance that it will likely reach the target that I annonated
Long
#GALAUSDT — Holding the Last Fortres, Recovery or Final Break#GALA
The price is moving within a descending channel on the 1-hour timeframe and has reached the lower boundary. It is now poised for a bounce and is expected to retest this boundary.
The Relative Strength Index (RSI) indicates a downward trend, which is likely to continue given the overbought conditions.
There is a key support zone (in green) at 0.00334. The price has bounced off this zone several times, making it a strong support level.
The price is trending towards the 100-period moving average, which we are approaching. This trend supports an upward move.
Entry Price: 0.00385
First Target: 0.00404
Second Target: 0.00418
Third Target: 0.00436
You can stop at the first and second targets and close the price, or continue towards the third target. Stop Loss: At the resistance zone (in green).
Remember this simple rule: Money Management.
Any questions? Please leave a comment.
Thank you.
Long
GALAUSDTThe overall structure remains bearish as the price continues to form lower highs and lower lows below the descending trendline.
However, compression near the 0.00670 dollar support suggests selling momentum is weakening and a short-term corrective bounce is possible if this level holds.
BINANCE:GALAUSDT
Long