Elliott Wave Analysis – First Green Light for Bullish ContinuatiRBOB Gasoline (RB2!) 4H Chart | Elliott Wave Analysis – First Green Light for Bullish Continuation?
Under the aggressive scenario, the market has delivered its first encouraging signal that the bullish trend may be ready to continue. The breakout above the corrective channel, the completion of a Classic Zigzag, and the development of an initial five-wave advance all support the possibility that a new impulsive sequence has begun. If this wave count is correct, the current rally could represent only the early stage of a much larger bullish trend.
Even so, no market advances in a straight line. After every impulsive move, corrective structures are both natural and necessary, allowing the market to regain balance before the next leg higher. These pauses may develop as either price corrections or time corrections, both of which are consistent with Elliott Wave guidelines.
The next correction does not necessarily have to be deep. The market may simply enter a sideways corrective phase to consume time rather than price. Structures such as a Flat, Triangle, or even a Complex Correction remain entirely possible. These patterns typically allow the market to consolidate before the primary trend resumes.
The conservative scenario, however, still suggests that the market may require a larger correction before the primary bullish trend can fully develop. If the current decline unfolds as nothing more than a three-wave corrective structure, such as a Simple Zigzag, the probability of a larger corrective phase would increase.
That said, the presence of a three-wave correction alone is not enough to confirm the bearish case. The key will be the market's behavior once the correction is complete. If buyers fail to produce a new impulsive advance and price instead breaks below the corrective structure, it would become the first warning that a short-term bearish phase may be developing.
Finally, it is important to remember that RBOB Gasoline is one of crude oil's primary refined products and maintains a strong correlation with the oil market. As long as crude oil continues to preserve its bullish structure and extend higher, the broader outlook for gasoline is also expected to remain constructive.
For now, both scenarios remain valid. The market's future price action, wave structure, and reaction around key technical levels will ultimately determine which path gains confirmation.
Patterns whisper. I listen.
— Mr. Nobody
In-depth trading ideas
NOLEADGASOLINE (4H) | Updated Elliott Wave RoadmapThe updated roadmap shows Wave I completed and Wave II still unfolding as a complex correction before the next major bullish expansion.
Aggressive Scenario
In the aggressive view, Wave II may resolve as a Triple Zigzag (W-X-Y-X-Z).
This would allow the market to complete the correction sooner and begin a fast Wave III advance.
This path becomes more credible if price breaks the Corrective Channel and the Terminal Channel, signaling that the corrective phase is losing control.
Conservative Scenario
In the conservative view, price may still develop a deeper Simple Zigzag (A-B-C).
That would mean a longer correction before the next impulsive leg begins.
So the bullish structure remains valid — but the market may need more time to finish the cleanup before it can sprint again.
Markets love drama, but they still respect structure. 😉
Key Levels
Bull Market (Aggressive): 31,512
Bull Market (Conservative): 36,868
Bear Market (Conservative): 30,107
First Invalidation: 30,525
Major Invalidation / Beginning: 16,777
Targets
42,077 — First Target Range
49,902 — Target Range
54,787 — Expanded Target
Technical Zones
Retracement Band: 38.2% – 50.0%
Deeper Retracement Band: 50.0% – 61.8% – 78.6%
Pattern Focus: Leading Diagonal, Terminal Channel, Corrective Channel
Price gives the destination,
time gives the rhythm,
subdivision confirms the truth.
Mr. Nobody
GASOLINE (4H) — The Choice: Aggressive Launch or the 11-Swing PaAnalysis Date: May 30, 2026
The gasoline market is currently at a structural crossroads. While the primary bias remains firmly bullish, the internal geometry of the current correction is offering two distinct paths.
I’m tracking the $2.8443 level as the ultimate line in the sand. Above this, the bullish thesis holds the floor.
Scenario 1: The Aggressive Launch (1.2 & 1.2 Cycle)
The market may have already completed two cycles of 1-2 sequences. If this is the case, the correction is over, and we are on the verge of a Wave 3 impulse.
The Signal: A clean breakout above the current Corrective Channel and immediate bullish momentum.
The Logic: No more time for downside; the market is ready to sprint toward the first target range of 3.85−3.85−3.88.
Scenario 2: The Conservative Path (Triple Zigzag & The 11-Swing Theory)
If the market demands more time to balance the structure, we might see a more complex Triple Zigzag (W-X-Y-X-Z).
The Wave X Move: A brief “Wave X” bounce followed by one last drop into Wave Z.
The 161.8% Factor: In a sharp zigzag, Wave C can extend toward the 161.8% projection. This doesn’t break the bullish idea; it simply deepens the correction within the Blue Box (PRZ).
The Logic: This path completes an 11-swing sequence, washing out the final weak hands before the real rally begins.
The Blue Box: Not Support, But a Decision Zone
I am watching the Blue Box closely. This is where the “aggressive idea” meets its ultimate test. If price enters this zone and shows a structural reversal, the “Z-wave” is likely finished, and the macro-cycle can resume.
Key Levels to Watch:
Invalidation: $2.8443
Primary Targets:
3.8588
(𝑇𝑎𝑟𝑔𝑒𝑡1)∣3.8588(Target1)∣4.4866 (Equal Wave 1) | $4.8732 (Expanded Target)
Trading isn’t about being right; it’s about being prepared for how the structure unfolds.
Patterns whisper. I listen.
— Mr. Nobody
“Elliott Wave Foresight: Gasoline Market’s Deep Breath and Corre May 15
“Elliott Wave Foresight: Gasoline Market’s Deep Breath and Corre“Elliott Wave Foresight: Gasoline Market’s Deep Breath and Correlation with Oil”
Analysis Date: May 15, 2026
Executive Summary:
Based on Elliott Wave Theory, Gasoline (GASOLINE), after completing a complex corrective structure (Expanded Flat and Sharp Corrective), is currently in a corrective Wave 2 (Three Waves Corrective). Given the strong correlation of gasoline with crude oil (such as UKOIL and OIL BRENT, where gasoline typically follows a stronger upward trend), a powerful impulsive Wave 3 is anticipated to begin after the completion of this correction.
Key Points of the Bullish Scenario:
End of Corrections: Completion of corrective structures A-B-C and Wave 2 (Three Waves Corrective).
Invalidation Point: $2.8439. A break below this level invalidates the bullish scenario.
Initial Price Targets: Range of
3.63
−
3.63−
3.85 (First Target Range).
Mid-term Targets: Equality with Wave 1 around $4.48 (Equal First Wave).
Long-term Targets: Extended up to approximately $4.87 (Expanded Target).
Correlation with Crude Oil:
As you mentioned, gasoline often shows a high correlation with crude oil prices and typically exhibits stronger momentum during upward trends. Analyses of UKOIL and OIL BRENT charts (available in your files) can further validate the overall market direction. If crude oil trends bullishly, gasoline is expected to follow with greater force.
Suggestion:
Considering the strong bullish scenario and its correlation with oil, this analysis indicates significant growth potential. Monitor key support and invalidation levels closely.
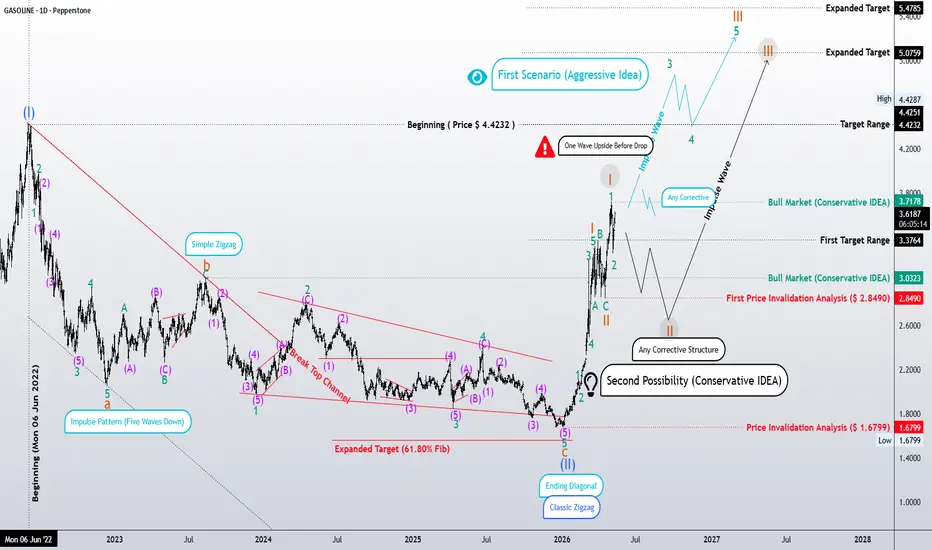
GASOLINE Daily Elliott Wave UpdateGASOLINE topped out at 4.4232 on Mon 06 Jun 2022 and then started dropping.
The decline looks like a classic three-wave corrective zigzag, and wave © formed an ending diagonal.
The structure finished around the 1.6799 invalidation level — so, based on the data from the chart, both scenarios you’re watching are now invalidated.
Pay close attention: wave © broke out of the corrective channel.
In patterns where wave (A) is sharp (impulsive-like), wave © often ends up building an ending diagonal.
And here’s the interesting part: if the final wave is diagonal (whether it’s coming from an impulse-style path or a diagonal zigzag), price sometimes does the opposite and effectively reverses/cancels the whole ending diagonal structure.
Now I’ve got two ideas for the next move:
Blue aggressive idea:
If price breaks above the previous peak (your current “blue” level) and then forms any corrective pattern, while keeping respect for the move into First invalidation at 2.8490, then the bullish setup stays fully valid with strong confirmation.
Black conservative idea:
Alternatively, the final part of wave 5 of I might still be unfolding, and then we could be entering a fresh corrective phase.
If that happens, it can also match a bullish outlook for the gas oil market overall.
I’m “Mr. Nobody” — I listen to what the patterns say, and I’m sharing what the chart is telling us.
California gasoline squeeze coming? U.S. Energy Secretary Chris Wright said on Sunday that he believes U.S. gasoline prices have peaked. But added they could remain above $3 a gallon until 2027.
That view is not shared uniformly across the administration. Treasury Secretary Scott Bessent said last week that gasoline could return to the $3 range this summer, while President Donald Trump has suggested elevated prices could persist until November.
According to AAA, the national average for a gallon of regular petrol stood at about $4.05 on April 19, 2026, up from $3.16 a year earlier.
California’s gasoline inventories have fallen to record lows, and motorists there were paying an average of $5.86 a gallon, the highest in the U.S.
California is especially vulnerable to price shocks because it is isolated from the nation’s fuel pipeline network, forcing it to rely in part on imports from Asia, where refiners process Middle Eastern crude into gasoline.
Sideway pattern? or the beginning of a bull market rallyDear analysts and traders,
I hope you are doing well and are motivated for the week ahead. I wish you all the success in your business endeavors. Remember that success in trading lies in consistently defining and sticking to your rules.
As someone interested in the Elliott Wave Principle, I find it to be an invaluable tool for market analysis. I have developed my approach by combining this principle with my personal experience and by considering different scenarios that are likely to occur in the market. It should be noted that I do not like to be surprised in the market, and that's why I have different market prospects. I follow them to be sure and recognize the structure that is forming so that I can 100% recognize it.
I will share my analysis with you, but please note that I am not providing any buy or sell signals. My perspective on idea analysis is completely unbiased, so if the idea analysis meets your standards, you can use it as a guide to make an informed decision.
I have attached my previous analysis of the same market so that you can compare and see the differences. All the details of my analysis are clearly labeled, making it easy for you to understand. However, having a basic familiarity with the Elliott Wave Principle theory will help you understand the analytical idea more easily.
I have been studying the Elliott Wave Principle for almost three years now, and over time, my understanding of this knowledge and experience has grown. What I have achieved so far is the legacy of a genius called Ralph Nelson Eliot, and I am really happy with my progress. May peace be upon him.
Thank you for your support so far. I will always remember your kindness. Please share your comments and criticisms with me.
I hope my analysis will be useful to you in your business journey, and I wish you all the best.
Sincerely,
Mr. Nobody
Continuation of the downward trendDear Friends,
I hope this message finds you well and that you're having a great start to the week. I wish you success in your business endeavors.
As someone interested in the Elliott Wave principle, I find it a valuable tool for analyzing the market. I have developed my approach by combining this principle with my personal experience and by considering various scenarios that are likely to occur in the market.
I am sharing my analysis with you, but please note that I am not providing any buy or sell signals. I aim to share my unbiased analysis with you so that you can use it as a guide to make informed decisions.
The first analysis is Litecoin
In the attachment, you will find my previous analysis of the same market, so you can compare and see the differences. All the details of my analysis are clearly labeled, making it easy for you to understand (although having a basic familiarity with the Elliott Wave Principle theory will help you understand the analytical idea more easily).
I have been studying the Elliott Wave principle for almost three years now. With time, my understanding of this knowledge and experience has increased. What I have achieved so far is a legacy of a genius named Ralph Nelson Elliott, and I am truly satisfied with my progress. May his soul rest in peace and his memory be cherished.
Thank you for your support so far. I am grateful and will always remember your kindness. Please feel free to share your thoughts and feedback with me.
I hope my analysis will be useful to you in your business journey, and I wish you all the best.
Sincerely,
Impulse pattern?? Three corrective waves and then a fallDear FRIEND,
I hope you're doing well and that the new year has started on a good note for you. I wish you success in your business endeavors and a happy new year with your loved ones.
As someone interested in the Elliott Wave principle, I find it to be a valuable tool for market analysis. I have developed my approach by combining this principle with my personal experience and by considering various scenarios that are likely to occur in the market.
I am sharing my analysis with you. However, please note that I am not providing any buy or sell signals. My goal is to share my unbiased analysis with you so that you can use it as a guide to make informed decisions.
In the attachment, I have included my previous analysis of the same market so that you can compare and see the. All the details of my analysis are clearly labeled, making it easy for you to understand (although having a basic familiarity with the Elliott Wave Principle theory will help you understand the analytical idea more easily).
I have been studying the Elliott Wave principle for almost three years now. With time, my understanding of this knowledge and experience has increased. What I have achieved so far is a legacy of a genius named Ralph Nelson Elliott, and I am truly satisfied with my progress. May his soul rest in peace and his memory be cherished.
Thank you for your support so far. I am grateful and will always remember your kindness. Please feel free to share your thoughts and feedback with me.
I hope my analysis will be useful to you in your business journey, and I wish you all the best.
Sincerely,
(Mr. Nobody)
Impulse Wave Now Three Waves CorrectiveHello there,
I hope you're having a great start to the new year. I wish you all the best in your trading ventures and a happy new year with your loved ones.
I'm a fan of the Elliott wave principle, which I find interesting and useful for market analysis. I've developed my analytical approach by combining this principle with my personal experience and considering various scenarios that are likely to occur in the market.
Although I'm going to share my analysis with you, please note that I won't be providing a buy or sell signal. My goal is to share my unbiased analysis so that you can use it as a guide to make an informed decision.
To give you confidence in my analysis, I'll always share my previous analysis from the same market so that you can compare. All the details of my analysis are clearly labeled, making it easy for you to understand.
I hope my analysis will be useful to you in your business journey, and I wish you the best.
I'm waiting to hear from you. Finally, I'd like to remind you that like-mindedness and support, comments, and likes are the most important pillars of progress, like support points in the financial markets. They give me the energy to continue and share more ideas with you.
Sincerely,
Gasoline and oil, similar corrective structureHello!
I am a big fan of the Elliott wave principle, which I find very interesting and useful for market analysis. I have developed my analytical approach by combining this principle with my personal experience and considering various scenarios that could occur in the market.
While I would like to share my analysis with you, please note that I am not providing a buy or sell signal. My primary intention is to share my unbiased analysis so that you can utilize it as a guide to make an informed decision.
To build your confidence in my analysis, I always share my previous analysis from the same market so that you can compare and see the progress. All the details of my analysis are clearly labeled, which should make it easy for you to understand.
I hope that my analysis is useful to you in your business journey, and I wish you all the best.
I am looking forward to hearing from you. Lastly, I would like to mention that like-mindedness and support, comments, and likes are the most important pillars of progress, just like support points in the financial markets. They give me the energy to continue and share more ideas with you.
Sincerely
The first analysis of Gasoline
Oil Chart Analysis Idea
Gasoline Long: Still AliveGasoline is still alive!! Trading inside of an expanding triangle, price has confirmed a "double bottom rejection" at triangle support. The actual double bottom won't be confirmed unless price breaks and closes above the neckline, which would potentially give me another trading opportunity as well. Since the reconfirmation of triangle support, I've been building a long position looking for a move back up to triangle resistance. Friday's close was a little discouraging, but didn't invalidate my trade setup. At the same time, this area continues to attract buyers. Now it's just a waiting game.
GASOLINEHi my friends if you want to buy oil now dont do that because oil is overbought and over extended but in opposite side you can long gasoline (one of the most important product of oil)
and by doing that : you have followed hedging in your positions by doing that......boost my post and send it to your friends...
to reaching my chart you should divide gasoline symbol to crude oil price.
Goooooood Luuuuuuck
Gasoline Commodity USA Sun Storm Investment Trading Desk & NexGen Wealth Management Service Present's: SSITD & NexGen Portfolio of the Week Series
Focus: Worldwide
By Sun Storm Investment Research & NexGen Wealth Management Service
A Profit & Solutions Strategy & Research
Trading | Investment | Stocks | ETF | Mutual Funds | Crypto | Bonds | Options | Dividend | Futures |
USA | Canada | UK | Germany | France | Italy | Rest of Europe | Mexico | India
Disclaimer: Sun Storm Investment and NexGen are not registered financial advisors, so please do your own research before trading & investing anything. This is information is for only research purposes not for actual trading & investing decision.
#debadipb #profitsolutions