In-depth trading ideas
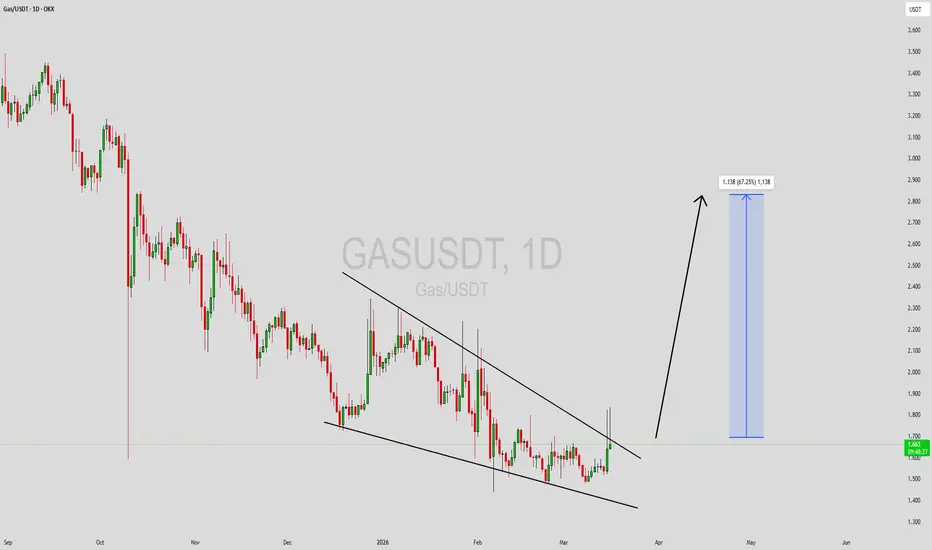
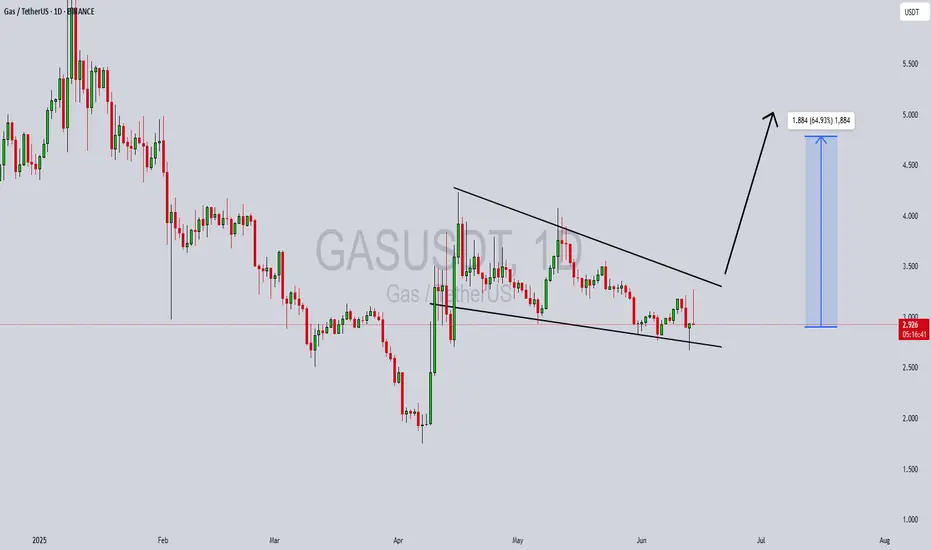
GASUSDT Forming Falling WedgeGASUSDT is forming a clear falling wedge pattern, a classic bullish reversal signal that often indicates an upcoming breakout. The price has been consolidating within a narrowing range, suggesting that selling pressure is weakening while buyers are beginning to regain control. With consistent volume confirming accumulation at lower levels, the setup hints at a potential bullish breakout soon. The projected move could lead to an impressive gain of around 50% to 60% once the price breaks above the wedge resistance.
This falling wedge pattern is typically seen at the end of downtrends or corrective phases, and it represents a potential shift in market sentiment from bearish to bullish. Traders closely watching GASUSDT are noting the strengthening momentum as it nears a breakout zone. The good trading volume adds confidence to this pattern, showing that market participants are positioning early in anticipation of a reversal.
Investors’ growing interest in GASUSDT reflects rising confidence in the project’s long-term fundamentals and current technical strength. If the breakout confirms with sustained volume, this could mark the start of a fresh bullish leg. Traders might find this a valuable setup for medium-term gains, especially as the wedge pattern completes and buying momentum accelerates.
✅ Show your support by hitting the like button and
✅ Leaving a comment below! (What is your opinion about this Coin?)
Your feedback and engagement keep me inspired to share more insightful market analysis with you!
GAS Buy/Long Signals (4H)Price is currently trading at a major key level, which is an important area to watch for a potential reaction. A strong bullish CH has formed on the chart, indicating a clear shift in market sentiment. The overall price structure is supportive of buy/long positions, and as long as this structure remains intact, our primary focus is on looking for long opportunities within this setup.
There are two well-defined entry zones marked on the chart, and positions should be built using a DCA strategy to optimize entries and manage risk effectively.
targets:2.030$ _ 2.151$_ 2.24$
Once the first target is reached, it is recommended to move the position to break-even to protect capital and secure a risk-free trade.
If you would like us to analyze a coin or altcoin for you, first like this post, then comment the name of your altcoin below.
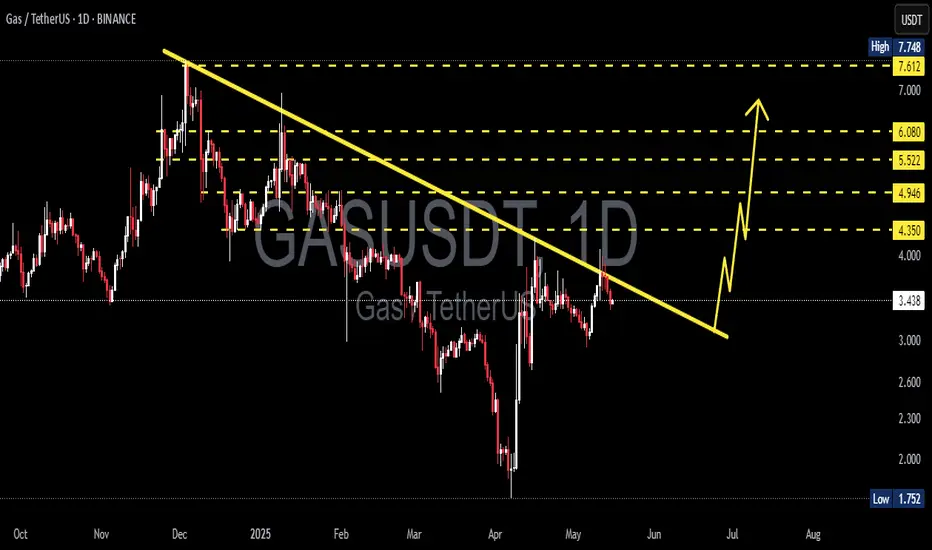
#GASUSDT #1D (ByBit) Falling broadening wedge breakout & retestNeoGas printed a golden cross on daily and a morning star at the same time, just like last year.
Also formed a triangle, seems likely to bounce on 200MA support then break bullish in the coming weeks.
⚡️⚡️ #GAS/USDT ⚡️⚡️
Exchanges: ByBit USDT
Signal Type: Regular (Long)
Leverage: Isolated (2.0X)
Amount: 5.4%
Current Price:
3.281
Entry Targets:
1) 3.201
Take-Profit Targets:
1) 4.387
Stop Targets:
1) 2.607
Published By: @Zblaba
HOSE:GAS BYBIT:GASUSDT.P #1D #NeoGas #dBFT neo.org
Risk/Reward= 1:2.0
Expected Profit= +74.1%
Possible Loss= -37.1%
Estimated Gaintime= 1-2 months
GAS - Huge Risk:Reward Trade 1:10 - Is there any Gas Left ?- Gas has finally managed to breakout from the resistance trendline and now trading just above the resistance
- I'm expecting this trend to continue along the support line shown in the chart.
Entry Price: 3.281
Stop Loss: 2.271
TP1: 3.944
TP2: 4.589
TP3: 6.775
TP4: 8.412
TP5: 13.512
Max Leverage 5x.
Don't forget to keep stoploss.
Support us by Liking and following.
Thanks and Cheers!
GreenCrypto
GASUSDT UPDATE
Pattern: Falling Wedge Breakout
Current Price: \$2.962
Target Price: \$3.70
Target % Gain: 20.27%
Technical Analysis: GAS has broken out of a falling wedge on the 4H chart, signaling bullish momentum. Price is retesting the breakout zone with a potential push towards \$3.70. Volume support and structure indicate continuation.
Time Frame: 4H
Risk Management Tip: Always use proper risk management.
GASUSDT Forming Strong Bullish ReversalGASUSDT is currently presenting a classic falling wedge pattern, a historically strong bullish reversal signal in technical analysis. This structure often precedes significant upward breakouts, especially when accompanied by increasing volume — which we’re seeing here. The price action suggests accumulation is underway, and with investor sentiment turning optimistic, a move to the upside appears increasingly likely. The expected gain ranges from 10% to 50%, with solid risk-reward potential for swing traders and mid-term holders.
Volume analysis confirms a healthy increase in interest, which often precedes momentum-driven rallies in crypto pairs like GASUSDT. The falling wedge has formed after a sustained downtrend, and now with a breakout on the horizon, the bullish case is further supported. GAS, the utility token for the NEO blockchain, remains a key asset in smart contract execution, and renewed activity on the NEO network could add fundamental strength to this technical setup.
From a macro perspective, GASUSDT is gaining traction as investors look to capitalize on undervalued altcoins with real utility and strong development backing. The project’s underlying use case — fueling transactions and resources on the NEO blockchain — continues to hold relevance in the broader smart contract ecosystem. As blockchain infrastructure plays come back into focus, GAS may benefit from both a technical breakout and a fundamental narrative shift.
In summary, GASUSDT is aligning both technically and fundamentally for a bullish phase. The falling wedge breakout potential, rising volume, and ecosystem utility create a compelling opportunity for investors looking to gain exposure to a medium-cap crypto with solid upside potential.
✅ Show your support by hitting the like button and
✅ Leaving a comment below! (What is You opinion about this Coin)
Your feedback and engagement keep me inspired to share more insightful market analysis with you!
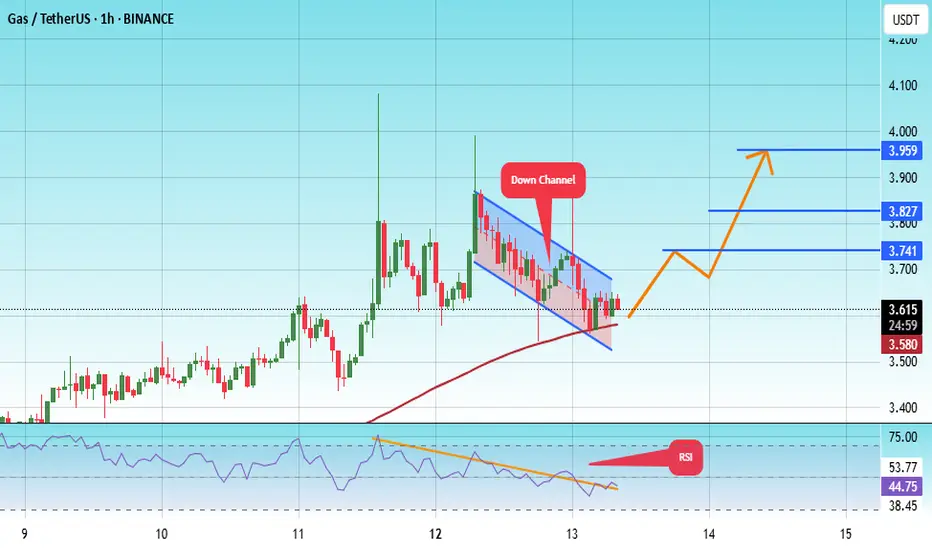
#GAS/USDT#GAS
The price is moving within a descending channel on the 1-hour frame, adhering well to it, and is heading towards a strong breakout and retest.
We are experiencing a rebound from the lower boundary of the descending channel, which is support at 3.55.
We are experiencing a downtrend on the RSI indicator that is about to break and retest, supporting the upward trend.
We are looking for stability above the 100 Moving Average.
Entry price: 3.58
First target: 3.74
Second target: 3.83
Third target: 3.96
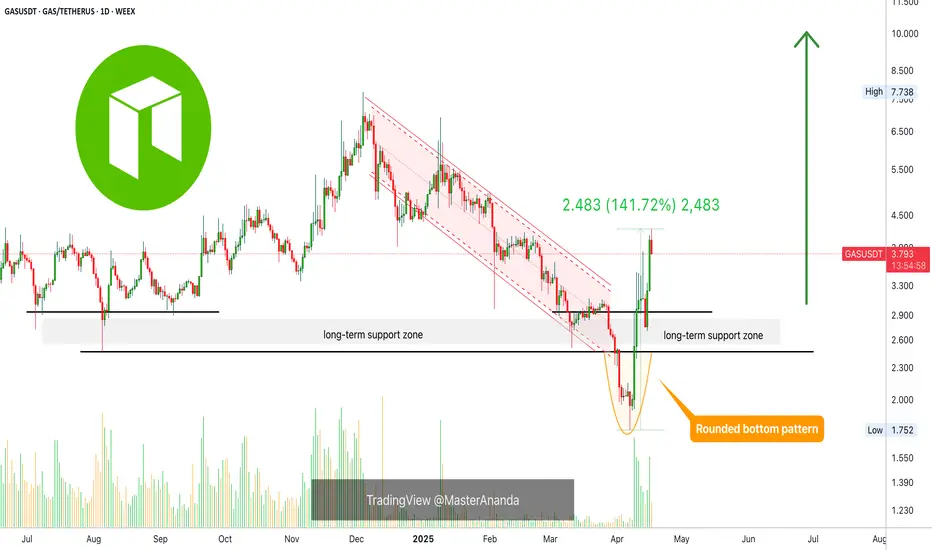
NeoGas: The Altcoins Market Bull Market Is Here Pt.2The dynamics here are the same as with STRAXUSDT. A very strong bullish bias is developing. NeoGas is growing and has grown by 142% since 7-April. The bottom is in, this means that only higher prices are possible now and long-term. This is the meaning of the bottom, it cannot go any lower.
The pattern that came up as the bottom is the classic rounded bottom, it is very easy to spot on the chart. After the bottom was established, the action quickly followed to move above long-term support, which is above the July and August 2024 lows.
Trading volume is high. Signals are bullish all across. This is only the start.
The bottom is set and a bullish breakout takes place. This bullish breakout leads to the development of an uptrend. This uptrend can least 3 months just as it can last 6 months, 12 months, 18 months or more. It can for years for all we know.
Once the bottom is in... Leave a comment and follow.
The only place left to go now is up!
» The Altcoins market Bull Market is here, it is still early though. These pairs have the potential to grow by 1,000% or more.
Namaste.
GASUSDT makes a false breakout against the trendParanormal volume growth and strong momentum amid the downtrend of cryptocurrencies and bitcoin.
Countertrend false breakout of the resistance zone. The purpose of such a structure is liquidity
Scenario: Strong growth has wasted all the potential and energy, there is no strength to continue growth. Probability of false breakout 95%
Consolidation below 2.585 will give an entry point
HiMonacci Strike | Short | GASUSDT | 4m🔹 Signal Type: HiMonacci Strike
🔹 Direction: SHORT
🔹 Symbol: GASUSDT.P (BINANCE)
🔹 Timeframe: 4m
🔹 Entry Price: AT LEAST 2.44 (above is okay in case of drawup)
🔹 Close Price: 2.232
🔹 Leverage: 4.77x (Calculated based on liquidation at 2.719)
💥 RISK MANAGEMENT NOTE:
THIS SYSTEM DOES NOT USE STOPLOSS.
CAPITAL IS DIVIDED INTO 24 PARTS.
A CALCULATED LEVERAGE IS USED TO SET A SAFE LIQUIDATION LEVEL.
YOU CAN ENTER BELOW THE ENTRY PRICE IN CASE OF DRAWDOWN.
LIQUIDATION = SIGNAL FAILURE.
📈 How to Use:
This signal is part of the HiMonacci system.
Use the leverage provided to align your liquidation near the system’s calculated risk point.
Entering below the entry price is allowed (and often better) if there's a drawdown.
📬 Want to Automate It?
We offer FULL AUTOMATION on Binance, using your own account, 100% secure.
This system can generate 40-55% monthly on average.
Let the candles work for you! 🕯️📊
#HiMonacci
Potential 755% Bullish Impulse In The Making...Rising slowly since August 2024. This can only mean one thing. The next move will be a strong move. Not strong as in everyday strong but an actual boom. Consider the action around October 2023. Left side of the chart. Something like this is what we are expecting based on the chart data and signals.
Today we have the highest volume since January 2024. And this day is green.
There is also a long-term higher low. August 2024 (higher) vs August 2023 (lower).
There you have it. You've been reminded of what is going to happen before it happens with plenty of time to take action. The rest is up to you. How you use this information to your advantage if your decision.
I am not responsible if you make tons of money trading. You are responsible for all your winnings and all your profits. We are now entering a major marketwide growth phase and this is something to keep an eye on.
I will continue to share charts for you. This is only my perspective, view and opinion. Should not be construed as financial advice but rather commentary and technical analysis. I am translating what the chart is saying to the best of my ability but I can be right just as I can be wrong.
Thanks a lot for your continue support.
You are truly appreciated.
Namaste.
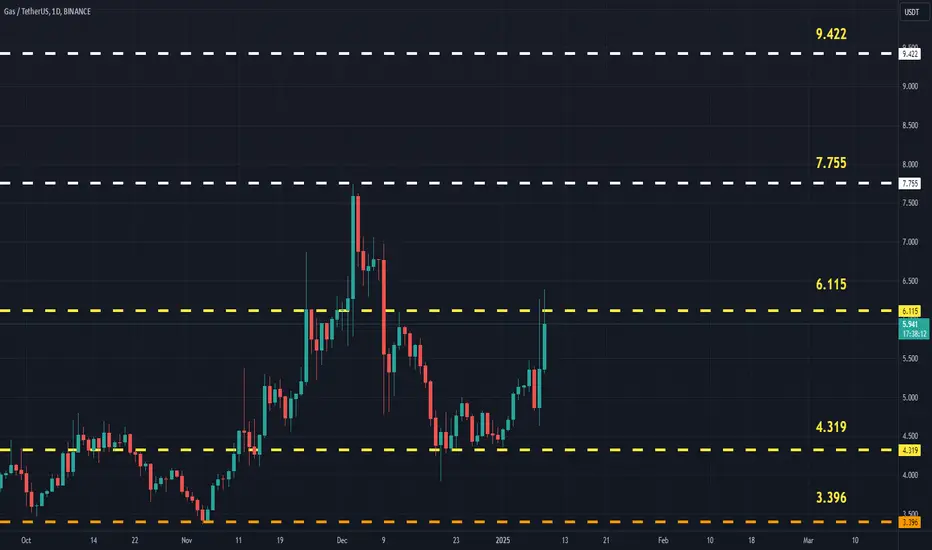
GASUSDTKey Level Zone : 6.261-6.330
HMT v1.0 detected. The setup looks promising, supported by a previous upward/downward trend with increasing volume and momentum, presenting an excellent reward-to-risk opportunity.
HMT (High Momentum Trending):
HMT is based on trend, momentum, volume, and market structure across multiple timeframes. It highlights setups with strong potential for upward movement and higher rewards.
Whenever I spot a signal for my own trading, I’ll share it. Please note that conducting a comprehensive analysis on a single timeframe chart can be quite challenging and sometimes confusing. I appreciate your understanding of the effort involved.
If you find this signal/analysis meaningful, kindly like and share it.
Thank you for your support~
Sharing this with love!
Gas: The Bull-RunSlow and steady growth is a bullish signal. GASUSDT has been growing slowly and steadily for months. It is now trading above resistance.
This chart setup is great. It is hard to convey in words what is about to happen. Because it is easy to say, "it is going up and it will happen fast and it will be huge," but it is not the same to actually see it and experience it, even less to collect the profits on our trades.
We are about to hit our first target. It used to be 410% but now it has only 217% left. This is the short-term because long-term there can be more as shown on the chart.
The charts don't lie. We have a strong long-term higher low, a higher high comes next.
The stage is set for a new bull-run.
Thank you for reading.
Namaste.