GBPUSD Daily / Weekly CLS - Model 1Hi Friends, New CLS Range has been created and Im looking for Long Model 1 trade setup. As always after the manipulation in to the Key Level, below the CLS range and reaction, we need to see a confirmation switch from the manipulation phase - CIOD (change in order flow) in the the expansion.
⏳ Stay patient and enter only after candle close.
🎯 Target: 50% of the CLS range.
‼️ During July and August I risk 1/2 then usually.
🎥 CLS Model 1 Video Explanation 📚 Bullish CLS Strategy Structure ⚠️ Risk Control is Key to Long Term Success
📍 Always place a proper stop loss
📍 Manage your risk per trade
📍 Stay disciplined & avoid emotional trading
📍Take the Trade only if you understand logic behind it
📍 Protect Capital First
🚀Boost | 🔁 Share | 💬 Comment | ✅Follow for more CLS setups
Adapt useful, Reject useless and add what is specifically yours.
David Perk
British Pound / U.S. Dollar
No trades
No trades
In-depth trading ideas
GBP/USD – Bullish Breakout & Recovery SetupGBP/USD – Bullish Breakout & Recovery Setup
🔍 Market Overview
GBP/USD is showing early signs of a bullish recovery after finding strong support near the recent demand zone. Price has broken above the descending trendline, indicating that bearish momentum is weakening. Although the pair is still trading below the Ichimoku cloud, buyers are gradually gaining control, and a confirmed breakout above the cloud would strengthen the bullish outlook.
📈 Bullish Scenario
* A sustained move above the Ichimoku cloud and short-term resistance would confirm a bullish continuation.
* The trendline breakout suggests a potential shift in market structure from bearish to bullish.
* If momentum continues, buyers could target the next resistance levels.
🎯 Target 1: 1.33280
🎯 Target 2: 1.33540
📉 Bearish Scenario
* If price fails to hold above the breakout zone and falls back below the support area, bullish momentum may weaken.
* A rejection from the cloud could trigger another bearish leg toward recent lows.
📊 Market Structure Insight
The recent trendline breakout is an encouraging sign for buyers, but confirmation above the Ichimoku cloud remains essential. Holding above the breakout level while forming higher lows would improve the probability of continued upside toward the marked target zones
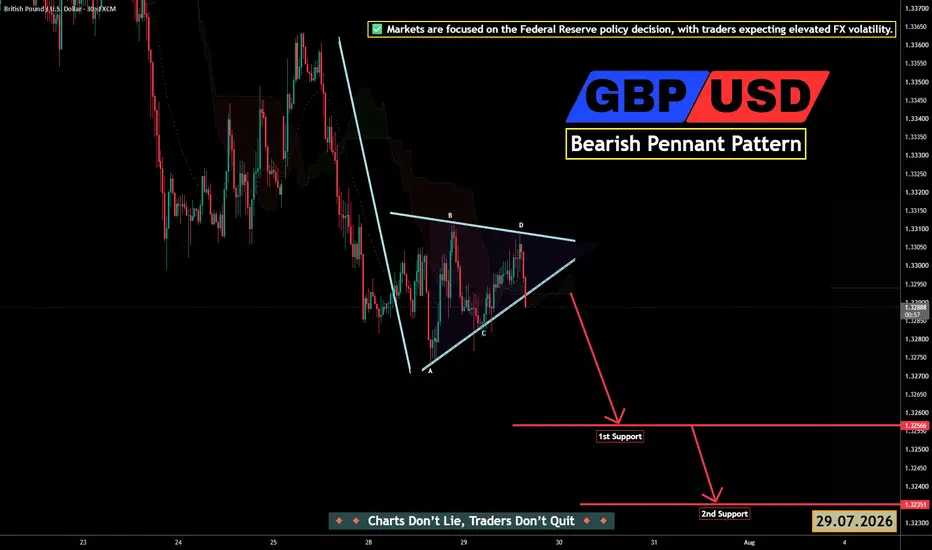
GBP/USD Under Pressure Ahead of Fed Decisions as USD StrengthDollar Holds Firm Ahead of Fed Decision – Investors remain cautious before the FOMC announcement, with policy expectations keeping the U.S. Dollar broadly supported.
FX:GBPUSD
GBP/USD is trading inside a classic Bearish Pennant, a continuation pattern that formed after a strong impulsive decline. Price has failed to break above the upper trendline and is now slipping below short-term support, suggesting sellers remain in control. A confirmed downside breakout could accelerate bearish momentum toward the marked support levels, while only a sustained move above the pennant resistance would invalidate this setup.
(SELL Setup)
🔴 1st Support: 1.32566
🔴 2nd Support: 1.32351
🟢 Resistance Zone: 1.33050 – 1.33080
⚠️ Disclaimer: This analysis is for educational purposes only.
Support the idea 🚀 Boost | 💬 Comment | 🔁 Share
🔸🔸 Charts Don't Lie, Traders Don't Quit 🔸🔸
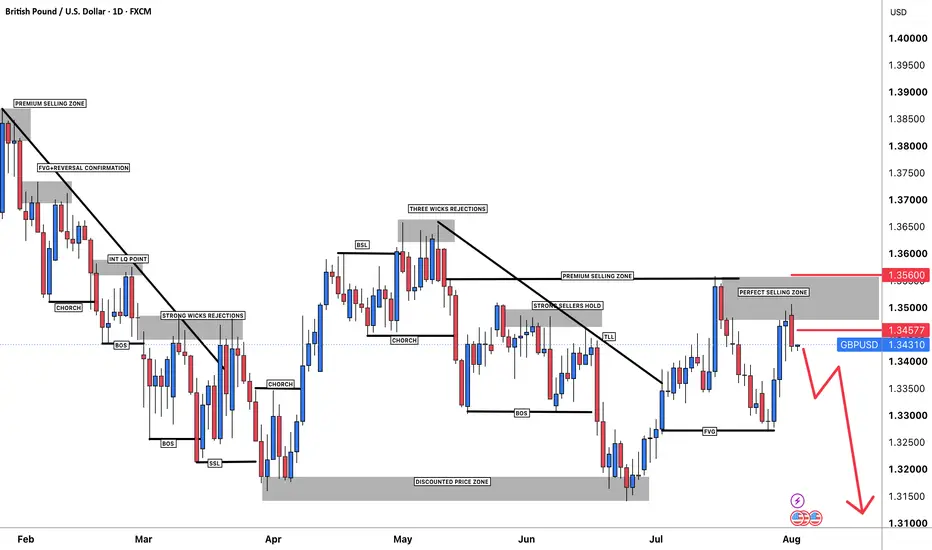
GBPUSD Price Update – Clean & Clear ExplanationGBP/USD is showing signs of exhaustion after a sharp bullish breakout, with price now pulling back into a key resistance-turned-reaction zone around 1.3450–1.3470. This area is likely to determine the next directional move.
Fundamentally, GBP/USD remains highly sensitive to upcoming U.S. economic data, Federal Reserve expectations, Bank of England policy outlook, and overall U.S. Dollar strength. Strong U.S. data or hawkish Fed comments could support the dollar and pressure the pair lower, while weaker U.S. figures or a more optimistic outlook for the UK economy could help sterling recover.
From a technical perspective, the recent rally appears to be a corrective move within the broader trend, and traders will be watching for bearish confirmation before expecting a deeper decline. However, if buyers manage to break and close above 1.3515, bullish momentum could strengthen, opening the door for a continuation toward higher resistance levels.
As long as the pair remains below the major resistance near 1.3515–1.3550, sellers could regain control and trigger another bearish leg. A rejection from this zone may push price back toward 1.3370, with further downside potential to 1.3300–1.3270 if selling pressure accelerates.
This analysis is shared for educational purposes only and should not be considered financial advice.
GBPUSD Buy Setup | Fib Confluence & Bullish Market StructureGBPUSD is showing signs of bullish continuation after respecting the Fibonacci Golden Zone (0.618–0.786), where Smart Money typically looks for discounted buying opportunities. The current price action suggests buyers are defending this demand area, increasing the probability of a move toward higher liquidity.
Key Technical Observations:
* ✅ Price reacted from the 0.618–0.786 Fibonacci retracement zone.
* ✅ Bullish market structure remains intact on the higher timeframe.
* ✅ Previous Break of Structure (BOS) and Change of Character (CHoCH) confirm a shift in momentum.
* ✅ Liquidity is resting above recent highs, making it a potential upside target.
* ✅ A sustained move above nearby resistance could trigger a strong bullish expansion.
Trading Plan:
* 📍 Wait for a confirmed bullish reaction from the Fibonacci Golden Zone.
* 📍 Enter after a Market Structure Shift (MSS) or strong bullish confirmation candle.
* 📍 Place Stop Loss below the demand/Fibonacci zone.
* 📍 Target previous highs first, followed by the daily order block and higher liquidity levels.
💡 Professional traders wait for confirmation, not predictions. Discipline, patience, and risk management are the foundation of long-term consistency.
Not Financial Advice. Trade at your own risk.
#GBPUSD: Price Is Preparing For Strong Sell, Get Ready 🔺The GBPUSD is currently trading in a critical selling zone. We require further confirmation and this can be achieved within the next few days as we are still recovering from the recent DXY sell-off. The current selling zone is likely to be a major selling zone due to the significant news expected this week.
🔺This news is critical and will shape the future trend of the GBPUSD. There is only one selling zone and one swing target, so you can set your own take-profit target. If you agree, please like and comment for further information.
GBP/USD Bearish Momentum Builds as Key Support Comes Into FocusGBP/USD remains under strong bearish pressure after failing to hold above the previous trading range. Sellers have regained control, and the pair continues to print lower highs and lower lows, confirming that the short-term trend is still bearish.
The recent decline is mainly driven by stronger U.S. Dollar demand, as traders continue to favor the USD ahead of key economic events and expectations that U.S. interest rates could remain higher for longer. At the same time, uncertainty around the UK economic outlook has reduced buying interest in the British Pound.
Technically, price has broken below the consolidation zone and is now testing an important support area. If this support fails to hold, the next downside target could be around the 1.3150 support zone. However, if buyers defend the current level, GBP/USD may see a short-term pullback toward the 1.3350–1.3400 resistance area before the next major move.
Hope you found this analysis helpful. 👍
Like, Comment & Follow for more updates. Trade safe.
GBPUSD Buy Opportunity | Smart Money ReversalGBPUSD is reacting from a key Point of Interest (POI) after a strong decline. If buyers defend this demand zone, the pair could continue higher and target the previous Break of Structure (BOS) and liquidity above.
Key Highlights:
* ✅ Price is testing a strong POI.
* ✅ Demand zone remains valid.
* ✅ Liquidity is resting above recent highs.
* ✅ Bullish confirmation could trigger the next rally.
💡 Wait for confirmation before entering. Patience and proper risk management always outperform chasing the market.
Not Financial Advice. Trade at your own risk.
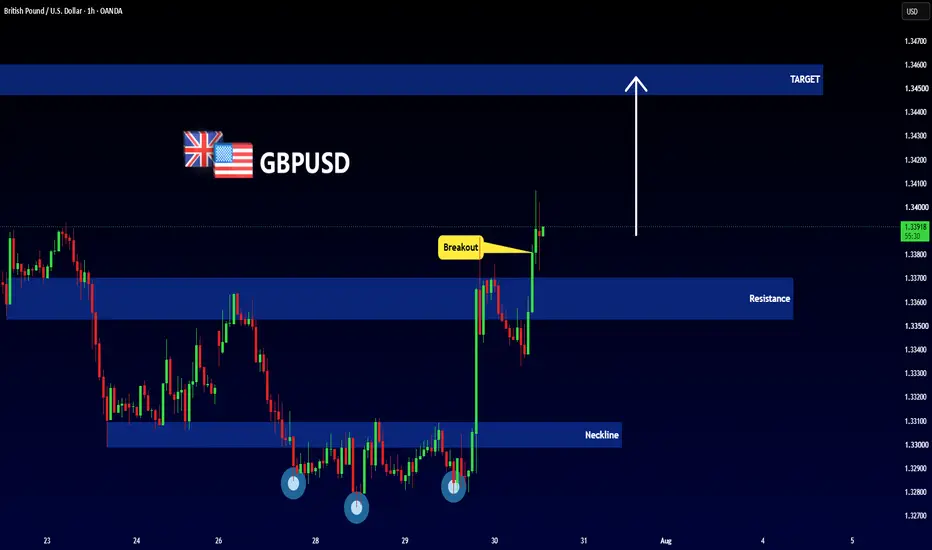
GBPUSDGBPUSD has reacted strongly from the major support zone around 1.3260–1.3300, forming a potential bullish reversal structure. Buyers defended the lower support area and pushed the price back above the short-term trendline, signaling that bullish momentum may continue.
The pair is currently trading near the mid-range resistance zone. A successful breakout above 1.3380 could open the door for further upside toward 1.3420 and 1.3490. However, if the price fails to hold above the trendline, another retest of the support area remains possible.
(BUY Setup)
🟢 1st Target: 1.3420
🟢 2nd Target: 1.3490
🔴 Support Zone: 1.3260 – 1.3300
⚠️ Resistance Zone: 1.3380 – 1.3400
✅ GBPUSD remains supported by the bullish reversal pattern, while traders are closely watching upcoming U.S. economic data and market sentiment for confirmation of the next move.
⚠️ Disclaimer: This analysis is for educational purposes only. Always use proper risk management before entering any trade.
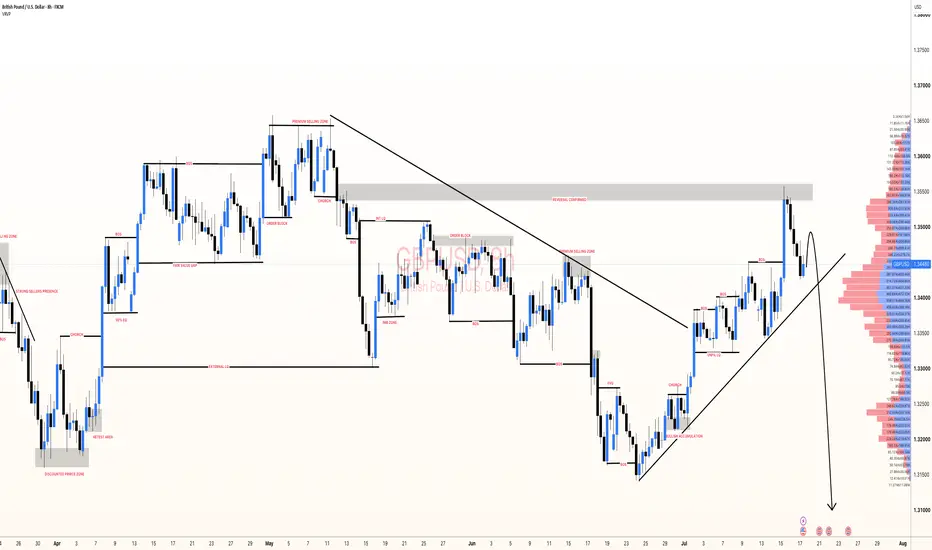
GBPUSD: Recovery rally approaching a key selling zoneGBPUSD has staged a strong rebound but is now testing the 1.3470 level, a confluence point where the upper boundary of the bearish channel meets immediate resistance. Repeated failures of previous rallies in this area indicate that sellers remain in control.
The fundamental backdrop also remains unfavorable for the Pound, as the Bank of England (BoE) maintains a cautious stance, while the US Dollar continues to be supported by US yields and a Federal Reserve policy that is not yet sufficiently dovish.
The preferred scenario is for GBPUSD to face rejection below 1.3470 and subsequently reverse lower toward the 1.3250 level at the channel's lower boundary.
Current outlook: Favor selling (short positions) if signs of weakness emerge around 1.3470, with an initial target at 1.3250.
GBPUSD - Demand Zone in FocusGBPUSD is approaching a strong support zone, marked in blue, where buyers have previously stepped in and defended price. 📊
📌 As long as this support zone continues to hold, we will be looking for trend-following long setups.
This area represents an important decision zone where the current correction could come to an end and the broader move higher may resume. However, rather than anticipating the bounce, we will wait for price action to confirm that buyers are defending the support before considering any positions.
Will buyers defend this support once again, or will sellers finally break through? 🤔
⚠️ Disclaimer: This is not financial advice. Always do your own research and manage risk properly.
📚 Stick to your trading plan regarding entries, risk, and management.
Good luck! 🍀
All Strategies Are Good; If Managed Properly!
~Richard Nasr
GBP/USD Bearish Rejection at Resistance Sellers Eye lower levelsDescription:
GBP/USD is testing a strong resistance zone after a sharp bullish move. If price gets rejected here, a pullback toward the 1.3350–1.3370 support zone becomes the likely scenario.
Sell Zone: 1.3480–1.3510
Target: 1.3350–1.3370
Wait for bearish confirmation before entering.
This is technical analysis, not financial advice.
GBP/USD Bearish Reversal From Supply Zone — Sellers Take ControlGBP/USD 2H Sell Setup — Resistance Rejection Targets 1.3385 📉
GBP/USD has delivered a powerful bullish impulse from the lower blue demand zones and is now trading near 1.3467, directly inside a major 1.3465–1.3480 resistance/supply area. This is a critical level because price has previously reacted lower from this region, and the chart projects a possible liquidity sweep above the current highs before sellers regain control. 🐻
The rally into resistance is strong, but strong rallies often attract late buyers just before price reaches an area where larger sell orders may be waiting. For that reason, the preferred view is not to sell blindly at current price; instead, wait for bearish confirmation from the resistance zone.
Resistance / Sell Zone 🚧
1.3465–1.3480: Primary sell zone. This is the key supply area marked on the chart and the area where bearish rejection is expected.
1.3480–1.3500: Possible liquidity-sweep region. Price may briefly push above the initial resistance before reversing.
Above 1.3500: A sustained 2-hour close above this area would weaken the bearish setup and suggest buyers remain in control.
Downside Target Zones 🎯
1.3420–1.3400: First intraday support and initial downside objective. Sellers may pause here, so partial profit-taking is sensible.
1.3385: Main target area shown on the chart. This is the primary bearish objective if price rejects the resistance zone.
1.3330–1.3340: First blue demand zone. If the selloff gains momentum, this becomes the next major support.
1.3280–1.3300: Deeper demand zone and extended downside target. This is only relevant if GBP/USD breaks decisively below 1.3330. 📊
Bearish Trade Plan 💡
The best short setup is a confirmed rejection from 1.3465–1.3480. Confirmation can include a long upper wick, bearish engulfing candle, lower-high formation, or a break back below local support after testing the zone.
A possible step-by-step plan:
Allow price to test or sweep 1.3465–1.3480.
Wait for clear bearish price action on the 1H or 2H chart.
Enter only after sellers show control; avoid chasing the first candle.
Target 1.3420–1.3400 first.
Secure partial profit, then hold a smaller position toward 1.3385.
If downside momentum remains strong, watch 1.3330–1.3340 as the next target. 🎯
Bullish Invalidation Scenario 🟢
If price closes and holds above 1.3500, the sell setup becomes invalid. A breakout followed by a successful retest would indicate that buyers have absorbed the supply zone, potentially opening the way toward the previous weak high near 1.3550. Do not hold a sell position simply because the level “should” reject—price confirmation is always more important than bias.
Risk Management 🧠
Place the stop-loss above the resistance zone or above the liquidity-sweep high that invalidates the setup. Position size should be calculated so that one losing trade risks only a small, fixed portion of the account—commonly 0.5–1%.
Take partial profits at the first target and consider moving the stop-loss to breakeven once the market moves in your favour. Avoid adding to a losing position, especially if GBP/USD is holding above resistance. High-impact UK or US news can also cause sharp spikes, so check the economic calendar before entering. ⚠️
Overall, GBP/USD is at a major decision area. The bearish idea remains valid while price stays below 1.3480–1.3500, with 1.3385 as the main downside target. A confirmed rejection from supply could offer a cleaner sell opportunity than entering immediately.
GBPUSD H1 Institutional Liquidity Levels Bulls/Bears1️⃣ TRADINGVIEW POST (long-form)
▪️ GBPUSD H1 SNAPSHOT — EXECUTIVE SUMMARY
▪️ Cable is trading near 1.34339, pinned directly beneath a fresh Bearish FVG and stacked supply, while a wall of institutional demand sits far below. Price is compressed at the decision point — the first rejection zone is only 9 pips away.
▪️ Primary outlook: rejection lower first, then rotation up. — 1.3436 is the trigger above; the maroon path expects a flush down into demand before the yellow recovery legs fire.
▪️ Key resistance zone: 1.3510 — a 10/10 STRONG London Bearish OB, 306 bars old, the heaviest supply on the board. Above sit two Asian Bearish FVGs at 1.3530 and 1.3550.
▪️ Major defense line: 1.3330 — an 8/10 Asian Bullish FVG and the first real demand shelf, backed by the 1.3294 London Bullish OB (10/10 STRONG), the structural floor.
▪️ Primary downside targets on a break: 1.3370 midpoint → 1.3330 Bullish FVG, where the maroon arrows terminate and liquidity pools.
▪️ Major liquidity magnet below: 1.3330–1.3294 — the pull if 1.3357 Bearish BB cracks. Magnet above: 1.3436 → 1.3510.
▪️ Bullish scenario: Reclaim 1.3436 and hold, and the yellow path opens toward 1.34677, then extended supply at 1.3510.
▪️ Bearish scenario: Reject the 1.3436 Bearish FVG → drive through the 1.3357 Bearish BB → sweep into 1.3330 / 1.3294 demand, then bull trap reversal.
▪️ KEY LEVELS
▪️ Current Price: ~1.34339
RESISTANCES
▪️ 1.3550 — ★★★ 6/10 · Bearish FVG · Asian · 125 pips away
▪️ 1.3530 — ★ 3/10 · Bearish FVG · Asian · 92 pips away
▪️ 1.3510 — ★★★★★ 10/10 STRONG · Bearish OB · London · 306 bars · 73 pips away
▪️ 1.3436 — ★ 3/10 · Bearish FVG · Asian · 9 pips away
SUPPORTS
▪️ 1.3357 — ★★★★ 8/10 · Bearish BB · 804 bars (flip zone)
▪️ 1.3330 — ★★★★ 8/10 · Bullish FVG · Asian · 107 pips away
▪️ 1.3294 — ★★★★★ 10/10 STRONG · Bullish OB · London · 88 bars · 146 pips away
▪️ ORDER FLOW / ZONE MAP
▪️ Overhead supply: 1.3436 FVG → 1.3510 London OB (10/10) → 1.3530/1.3550 FVGs — layered sell-side, the ceiling that must break for trend up.
▪️ Below demand: 1.3357 Bearish BB (8/10 flip) → 1.3330 Bullish FVG (8/10) → 1.3294 London OB (10/10) — the demand shelf and deep magnet. The 1.3294 OB is the highest-value reversal zone on the chart.
🔍 SCENARIO PATH
▪️ Maroon leg first: rejection from 1.3436 → break 1.3357 BB → drive into 1.3330 Bullish FVG.
▪️ Yellow rotation: from 1.3330 demand → recovery back through 1.3357 → target 1.34677 → 1.3510 supply.
▪️ My read: Coiled beneath supply with deep demand waiting. This is a reject-and-reverse setup — a flush into 1.3330/1.3294 that holds is the high-value long; a clean reclaim of 1.3436 flips bias early and opens 1.34677+. Edges pay, the middle chops.
🔒 Levels and paths from the zone model. No signals, no repaint — a scenario, not a promise.
▪️ ProjectSyndicate Levels Desk — weekly S/R & liquidity zones for XAUUSD, GBPUSD, NVDA, NQ, ES & GC. Subscribe to stay up to date.
#GBPUSD #Cable #Forex #Trading
GBP/USD – Bearish Pressure Building Inside Key Resistance ZoneGBP/USD has staged a strong recovery from recent lows, but the rally is now facing heavy resistance near the upper boundary of its trading range.
From a technical perspective, the pair remains below a critical resistance area. Unless buyers manage to produce a strong breakout and secure a close above this zone, the probability of a bearish correction continues to increase. A break below the immediate support around 1.3350 could expose the next downside target near 1.3270, where buyers may attempt to regain control.
From a fundamental perspective, the recent hesitation may be driven by stronger demand for the US Dollar, profit-taking after the previous GBP rally, and cautious market sentiment ahead of upcoming high-impact economic releases. Traders are also closely monitoring expectations surrounding future Bank of England and Federal Reserve interest rate decisions, as any shift in policy expectations could significantly influence GBP/USD volatility.
Resistance Zone: 1.3450 – 1.3480
Support ; 1.3350 / 1.3270
As long as GBP/USD remains below the highlighted resistance, sellers may continue to dominate the short-term trend. A confirmed rejection could trigger further downside toward the marked support levels. However, if bulls break and hold above resistance with strong momentum and volume, the bearish outlook would weaken, opening the door for a continuation of the broader recovery.
Hope you found this analysis helpful. 👍
Like, Comment & Follow for more updates. Trade safe.
GBPUSD: H4 Liquidity Trap--Dump AheadGBPUSD has rallied into a major H4 liquidity pool, but the real question is whether buyers have enough fuel to sustain the breakout.
Price is currently testing higher-timeframe liquidity while a NWOG sits below. Although NWOGs often attract price, I won't trade solely because of that. If my liquidity and market structure model confirms, I'll follow the setup regardless of the gap.
What I'm Watching
• Price is trading inside a key H4 liquidity zone.
• Multiple sell-side liquidity pools remain untouched below.
• NWOG offers additional confluence, but not the primary reason for the bias.
• Expect confirmation before committing to any directional move.
Trade Plan
🔍 Watch for liquidity sweep into the H4 highs.
📉 If bearish confirmation appears, expect price to target the stacked sell-side liquidity below.
📈 If buyers reclaim and hold above the H4 liquidity, bearish bias becomes invalid.
Remember: Liquidity creates the move. Confirmation pays the trader.
Not financial advice. Trade your own plan.
GBPUSD Price Update – Clean & Clear ExplanationGBP/USD remains under strong bearish pressure after rejecting a key supply/resistance zone around 1.3490–1.3500. The recent rally appears to have been a liquidity sweep, with sellers quickly regaining control and forcing price back below resistance. This rejection suggests that bearish momentum is still dominating the higher-timeframe structure.
From a technical perspective, the market has respected a major resistance area while failing to establish a sustained breakout above previous highs. As long as price remains below the 1.3490–1.3500 resistance zone, sellers may continue targeting lower support levels.
Target 1: 1.3350–1.3360
Target 2: 1.3300–1.3310
A confirmed break below the recent swing low would strengthen the bearish outlook and could accelerate downside momentum. However, if buyers reclaim and hold above 1.3500, the current bearish setup would weaken and a move toward higher levels could become possible a break below the recent swing low would confirm fresh bearish momentum and could trigger another wave of selling toward the next liquidity zones.
This analysis is shared for educational purposes only and should not be considered financial advice.
#GBPUSD: 400+ Pips Selling Opportunity! Get Ready! Price initially extended the bullish momentum but then dropped. Analysing the drop and closing candles suggests a potential further selling decline. A possible entry point is at a minor correction. If the rejection occurs at the target level, a selling entry can be confirmed. The potential targets are 1.30 or 1.28, both of which offer significant potential. If you agree with our idea, please like and comment for more!
Team Setupsfx_
GBP/USD Bearish Breakdown & Bearish Trend Continuation, GBP/USD Technical Analysis – Bearish Outlook
GBP/USD is testing the lower boundary of an ascending channel after failing to sustain bullish momentum. A confirmed break of structure below channel support would reinforce the bearish bias, exposing the 1.3336 demand zone and potentially extending toward the 1.3271 liquidity target. Unless buyers reclaim channel resistance, rallies are likely to be viewed as corrective within the developing bearish structure.
*Key Technical Levels*
Resistance
Ascending channel resistance 1.35000
Recent swing high (dynamic resistance) 1.35500
Support
Ascending channel support
1.3336 – First bearish target
1.3271 – Secondary liquidity target
Bearish Thesis Scenario
* Price is losing bullish momentum within the ascending channel.
* A break of structure (BOS) below channel support would confirm bearish continuation.
* Liquidity is building beneath 1.3336, making it a likely downside objective.
* A sustained move below **1.3336** could accelerate selling pressure toward 1.3271
Professional Insights
* **Market Structure:** The uptrend is weakening as price struggles to sustain higher highs, increasing the risk of a structural reversal.
* **Liquidity:** Sell-side liquidity is concentrated below **1.3336**, making it a key magnet if support gives way.
* **Order Flow:** Sellers are beginning to absorb buying pressure, while momentum favors a corrective move lower.
* **Breakout Scenario:** A confirmed **BOS** below the ascending channel would likely trigger additional bearish order flow and expand volatility.
* **Risk Management:** Until the channel support is decisively broken, traders should wait for confirmation rather than anticipate the breakdown.
Trade Invalidation
The bearish outlook will be invalidated by a **decisive breakout and sustained close above the ascending channel resistance**, indicating that buyers have regained control and increasing the probability of a continuation toward new swing highs.
GBP/USD Breakdown Imminent? Rising Channel Faces Key TestGBP/USD Technical Analysis – Bearish Outlook & Bearish Continuation
GBP/USD is testing a major resistance zone between 1.3465 and 1.3476 at the upper boundary of a rising channel. As long as price remains below this area, the current rally is likely to lose momentum, favoring a bearish reversal. A confirmed break below channel support would strengthen the downside bias and expose the 1.3287 target. The bearish outlook is invalidated by a sustained close above 1.3476.
Key Technical Levels
Resistance
1.3465 – Initial resistance
1.3476 – Major resistance and bearish reversal zone
Support
Lower boundary of the rising channel
1.3287 – Primary bearish target
Bearish Scenario
Price is testing a significant resistance zone after a strong bullish impulse.
The current advance appears to be losing momentum within the ascending channel.
A rejection below 1.3476 would favor a bearish continuation.
A confirmed break below the channel support would strengthen the bearish case and increase the probability of a decline toward 1.3287.
Bearish Trade Invalidation
The bearish outlook will be invalidated by a decisive break and sustained close above 1.3476, indicating that buyers have maintained control and increasing the probability of further upside.
professional insights;
GBP/USD is approaching a critical supply zone where technical confluence increases the probability of a bearish reaction. The combination of channel resistance and overhead supply suggests buyers may struggle to extend the rally without a confirmed breakout. Unless price establishes a sustained close above 1.3476, rallies are likely to be viewed as selling opportunities, with a break below channel support potentially accelerating the move toward 1.3287.
GBPUSD Weekly CLS Model 1Hi Friends, New CLS Range has been created and Im looking for Long Model 1 trade setup. As always after the manipulation in to the Key Level, below the CLS range and reaction, we need to see a confirmation switch from the manipulation phase - CIOD (change in order flow) in the the expansion.
⏳ Stay patient and enter only after candle close.
🎯 Target: 50% of the CLS range.
🎥 CLS Model 1 Video Explanation 📚 Bullish CLS Strategy Structure ⚠️ Risk Control is Key to Long Term Success
📍 Always place a proper stop loss
📍 Manage your risk per trade
📍 Stay disciplined & avoid emotional trading
📍Take the Trade only if you understand logic behind it
📍 Protect Capital First
🚀Boost | 🔁 Share | 💬 Comment | ✅Follow for more CLS setups
Adapt useful, Reject useless and add what is specifically yours.
David Perk
GBPUSD H4 | Bearish Reaction Off Key ResistanceMomentum: Bearish
Price is currently below the ichimoku cloud.
Sell entry: 1.34197
- Pullback resistance
- 50% Fib retracement
- 78.6% Fib projection
- Fair value gap
Stop Loss: 1.34816
- Swing high resistance
Take Profit: 1.33433
- Swing low support
High Risk Investment Warning
Stratos Markets Limited (fxcm.com/uk), Stratos Europe Ltd (fxcm.com/eu):
CFDs are complex instruments and come with a high risk of losing money rapidly due to leverage. 65% of retail investor accounts lose money when trading CFDs with this provider. You should consider whether you understand how CFDs work and whether you can afford to take the high risk of losing your money.
Stratos Global LLC (fxcm.com/en): Losses can exceed deposits.
Please be advised that the information presented on TradingView is provided to FXCM (‘Company’, ‘we’) by a third-party provider (‘TFA Global Pte Ltd’). Please be reminded that you are solely responsible for the trading decisions on your account. Any information and/or content is intended entirely for research, educational and informational purposes only and does not constitute investment or consultation advice or investment strategy. The information is not tailored to the investment needs of any specific person and therefore does not involve a consideration of any of the investment objectives, financial situation or needs of any viewer that may receive it. Past performance is not a reliable indicator of future results. Actual results may differ materially from those anticipated in forward-looking or past performance statements. We assume no liability as to the accuracy or completeness of any of the information and/or content provided herein and the Company cannot be held responsible for any omission, mistake nor for any loss or damage including without limitation to any loss of profit which may arise from reliance on any information supplied by TFA Global Pte Ltd.
Stratos Trading Pty. Limited (fxcm.com/au):
Trading FX/CFDs carries significant risks. FXCM AU (AFSL 309763), please read the Financial Services Guide, Product Disclosure Statement, Target Market Determination and Terms of Business at fxcm.com/au