$AI Air Liquide SA - Our opiumNYSE:AI — Air Liquide SA
Air Liquide remains a cornerstone holding for long-term portfolios, delivering a consistent ~11% annualized return over the past 25 years. The company's defensive profile, pricing power, and structural exposure to the energy transition and healthcare sectors make it a high-conviction position. The upcoming 2026 shareholder loyalty bonus further enhances total return for committed holders.
Technical outlook:
Price has broken out of its recent trend channel but remains
Air Liquide SA
No trades
No trades
In-depth trading ideas
Air Liquide Stock | Chart & Forecast SummaryKey Indicators on Trade Set Up in General
1. Push Set Up
2. Range Set up
3. Break & Retest Set Up
Active Sessions on Relevant Range & Elemented Probabilities;
* Asian(Ranging) - London(Upwards) - NYC(Downwards)
* Weekend Crypto Session
Trend | Time Frame Conductive | Weekly Time Frame
- General Trend
- Measurement on Session
* Support & Resistance
* Trade Area | Focus & Motion Ahead
# Position & Risk Reward | Daily Time Frame
- Measurement on Session
* Retracement | 0.5 & 0.618
* Extension |
Air Liquide has formed a bull flag!Air Liquide - 30d expiry - We look to Buy a break of 134.52 (stop at 129.88)
Posted a Double Bottom formation.
Prices have reacted from 114.44. Posted a bullish Flag formation.
A break of 134.30 is needed to confirm the outlook.
The bias is to break to the upside.
Our outlook is bullish.
The primary trend remains bullish.
Our profit targets will be 145.88 and 149.88
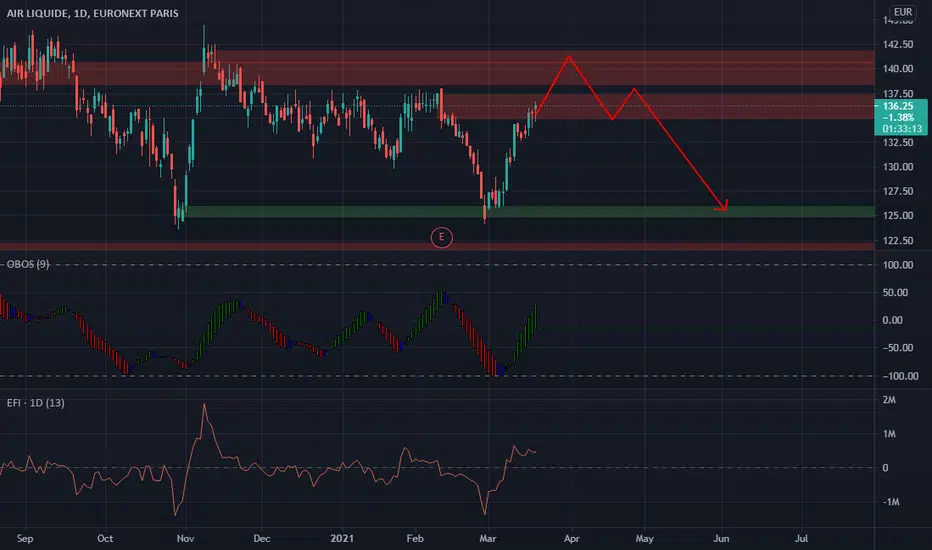
Resistance: 134.30 / 138.00 / 142.50
Support: 130.36 / 127.00 / 122.50
Disclaimer – Saxo Bank Group.
Please be reminde
Air Liquide drops should attract buyers.Air Liquide - 30d expiry - We look to Buy at 115.12 (stop at 111.78)
The primary trend remains bullish.
Intraday dips continue to attract buyers and there is no clear indication that this sequence for trading is coming to an end.
Early pessimism is likely to lead to losses although extended attempts lower are expected to fail.
Support is located at 115 and should stem dips to this area.
We are trading at oversold extremes.
Our profit targets will be 123.88 and 126.88
Resistance: 120 /
Air Liquidi FranceSSI Live Trading Series
Sun Storm Investment Trading Desk & NexGen Wealth Management Service Present's
Focus: Worldwide
By Sun Storm Investment Research & NexGen Wealth Management Service
A Profit & Solutions Strategy & Research
Trading | Investment | Stocks | ETF | Mutual Funds | Crypto | Bonds | Options | Dividend | Futures |
USA | Canada | UK | Germany | France | Italy | Rest of Europe | Mexico | India
Disclaimer: Sun Storm Investment and NexGen are not registered financial advis
#8 by Marketcap in France (Buy)$AI.PA ranked #8 in France with a 82.29B Market cap, engages in gas supply for large industry and health businesses has been ranging since late march.
1D chart is showing a bounce from the 20EMA and 0.236 Fibonacci level a possible sign of Bollinger band squeeze. The price might be taking a break at this point before continuing its upward trend.
4H chart is showing similar data, with a bounce from the 0.236 level and dipped briefly below the 20 and 50 EMA. It has now moving back to the top end
Air-Liquide (AI)The company is very attractive due to its quasi-monopoly position in Europe. It has good trading stability and this allows it to be very attractive to more conservative investors. We also recommend looking into investing directly through the company with its share purchase and dividend reinvestment program. You can find more information here: www.airliquide.com
Stock to watch: Air Liquide (EURONEXT:AI)EURONEXT:AI
An interesting asset to trade. After entering the green zone (according to Buy/Sell Zones indicator ) it showed a small pullback which gives a possible good long entry point.
I'm looking forward to picking it up in the zone from current close up to 120.
Short-term Long targets are 0,5 Fib (previous high) and 1 Fib.
Long-term target is 2 Fib.
Invalidation: the price nukes under the previous low and stays there (prints a lower low)
Disclaimer: This article should not be considered
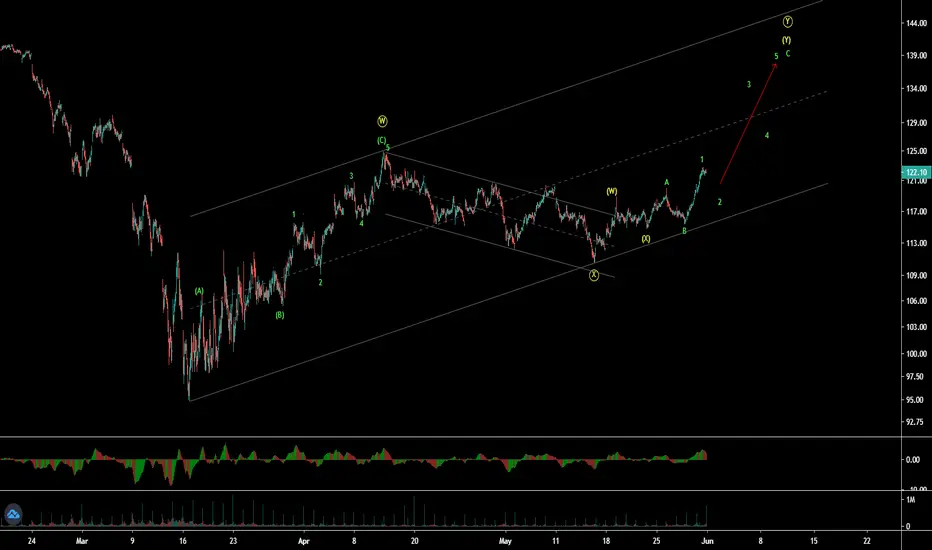
Air Liquide SA (AI - France) - WXY wave patternAir Liquide SA (AI - France) is in WXY up correction and moving up in C wave of y of Y major wave as final move up. It is the part of complex correction. In weekly time frame, from major bottom on chart it has completed WXY wave upside. From major top in 2020, it dropped in ABC zigzag and now corrected in complex WXY correction. It is very strong stock and out-performer than CAC40 index on daily time frame. So possibly it can go higher in 60 min time frame.
Air Liquide is trying something hereAir Liquide tries to break the trend channel. It seems the gas producer did not get big hits from the corona crisis. The company is paying dividends for a long time now and is bullish in the past.
The break of the trend channel comes with an buy signal from the macd. The RSI is on a normal level but just crossed the 50. If the stock ends significantly above the trend channel today it is a clear buy for me.