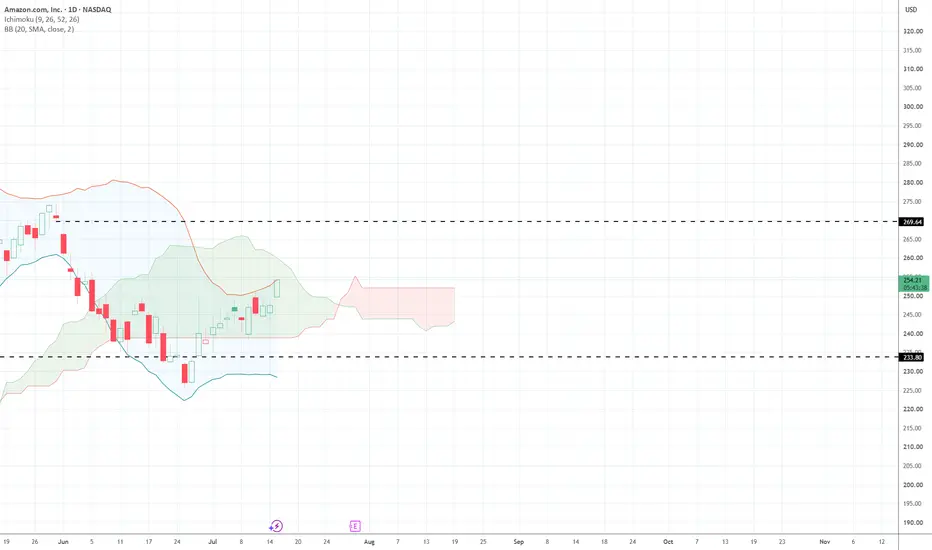
What Amazon's Chart Tells Us Ahead of Next Week's EarningsIt's been a rough go of it in 2026 for shareholders of Amazon NASDAQ:AMZN , which will report quarterly results next week. The struggling "Magnificent Seven" stock remains some 15% below its $278.56 May all-time high -- and is even roughly 10% below its $258.60 peak for 2025. Let's check out the e-commerce giant's chart and fundamentals.
Amazon's Fundamental Analysis
Amazon expects to release Q2 results after the bell next Thursday (July 30), with the Street looking for $1.82 in GAAP earnings per share on roughly $196 billion of revenue.
Such numbers would represent an 8.3% gain from the $1.68 GAAP EPS that Amazon reported in the same quarter a year ago, while revenues would have grown 16.9% from the $167.7 billion seen 12 months earlier.
Meanwhile, 28 of the 46 sell-side analysts that I know of who track this name have revised their earnings estimates higher since the period began, while just 10 analysts have cut their numbers. (Eight have made no changes.)
Amazon's Technical Analysis
Here's AMZN's year-to-date chart as of Tuesday afternoon (July 22):
This chart is beyond interesting. The most important thing to note is that technically speaking, Amazon's share price has "colored within the lines."
What I mean by that is that everything AMZN has done this year was telegraphed ahead of time by the stock's technicals.
For instance, Amazon came out of a double-bottom pattern of bullish reversal in late March and early April (shaded in green at left), then it promptly rallied into May and June.
That peak next developed into a double-top pattern of bearish reversal that's shaded in pink at the chart's center, and that produced a June/July sell-off for the stock.
And now, Amazon's sell-off seems to be giving way to support ahead of next week's earnings. In fact, the stock might be in the process of creating a cup-with-handle pattern, shaded in gray at the chart's right. That would be a bullish set-up.
After all, Amazon has already taken back its 21-day Exponential Moving Average (or "EMA," marked with a green squiggly line above at $246.30). That likely got swing-trader support back on board.
The next line for the stock to conquer would be its 50-day Simple Moving Average (or "SMA," denoted by the blue line at $251.20).
Meanwhile, Amazon's apparent pivot here would be the cup pattern's right-side apex at $258. But understanding that this is no sure thing, let's see what the other technical indicators in the above chart can tell us.
On one hand, Amazon's Relative Strength Index (the gray line marked "RSI" at the chart's top) is barely neutral and not rising at the moment.
However, the stock's daily Moving Average Convergence Divergence indicator (or "MACD," denoted by blue bars, a black line and gold line at the chart's bottom) is steadily improving.
For example, the histogram of Amazon's 9-day EMA (the blue bars) has been in positive territory since July's start. That's a short-term bullish signal.
And on top of that, the stock's 12-day EMA (the black line) is running above the 26-day EMA (the gold line) -- while both move above the zero-bound. That's a stronger, medium-term bullish signal.
(Moomoo Technologies Inc. Markets Commentator Stephen "Sarge" Guilfoyle was long AMZN at the time of writing this column.)
This article discusses technical analysis, other approaches, including fundamental analysis, may offer very different views. The examples provided are for illustrative purposes only and are not intended to be reflective of the results you can expect to achieve. Specific security charts used are for illustrative purposes only and are not a recommendation, offer to sell, or a solicitation of an offer to buy any security. Past investment performance does not indicate or guarantee future success. Returns will vary, and all investments carry risks, including loss of principal. This content is also not a research report and is not intended to serve as the basis for any investment decision. The information contained in this article does not purport to be a complete description of the securities, markets, or developments referred to in this material. Moomoo and its affiliates make no representation or warranty as to the article's adequacy, completeness, accuracy or timeliness for any particular purpose of the above content. Furthermore, there is no guarantee that any statements, estimates, price targets, opinions or forecasts provided herein will prove to be correct.
Moomoo is a financial information and trading app offered by Moomoo Technologies Inc. In the U.S., investment products and services on Moomoo are offered by Moomoo Financial Inc., Member FINRA/SIPC.
TradingView is an independent third party not affiliated with Moomoo Financial Inc., Moomoo Technologies Inc., or its affiliates. Moomoo Financial Inc. and its affiliates do not endorse, represent or warrant the completeness and accuracy of the data and information available on the TradingView platform and are not responsible for any services provided by the third-party platform.
Amazon.com, Inc.
No trades
No trades
In-depth trading ideas
AMZN | ABC Correction Done — Break The HVA And Run!
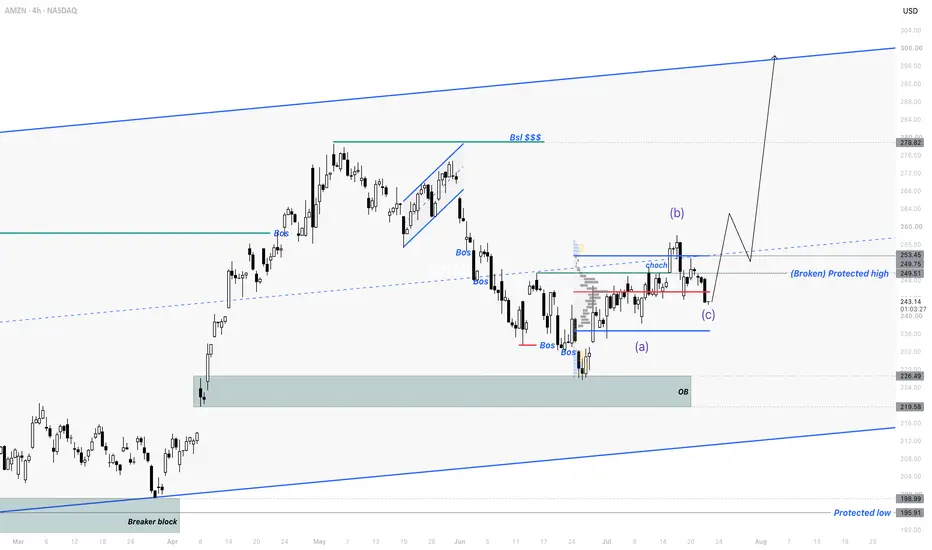
By analyzing the #AMZN (Amazon) chart on the 4H timeframe, we can see that the broader trend remains bullish, and the internal corrective phase looks to be wrapping up. Price is now compressing at a decisive volume level — and a clean break of it is the trigger for the next leg toward the liquidity above.
📊 4H Timeframe
On the 4H, the bigger picture is an uptrend riding inside its rising channel, with price holding comfortably above the Protected Low at $195.91 . Within that uptrend, price went through an internal correction: it printed a bearish internal CHoCH, followed by several bearish BOS on the way down, taking price into the demand area near the Order Block ( $219.58 – $226.49 ).
That corrective phase is now over. Price broke the Protected High of the internal downtrend at $249.51 with an impulsive wave — the structural signal that buyers reclaimed control. Since that break, price has been unwinding in a three-wave (a)-(b)-(c) correction, and it's currently trading around $242.89 , sitting right at the High Value Area (HVA) of the volume profile — the heaviest-traded level on the chart and the battleground that decides the next move.
🎯 The Bias
My base case is bullish continuation, but it needs confirmation. The trigger I want is a clear candle close above the High Value Area — that would confirm buyers have absorbed the heaviest volume on the chart and complete the corrective structure. On that break, the path opens toward the levels overhead at $249.75 and $253.45 , and then the buy-side liquidity (BSL) resting at $278.82 , with the trend continuing inside its channel. In my view, as long as AMZN holds above the Protected Low ($195.91), the uptrend stays intact and every dip remains constructive — but until that HVA gives way on a decisive close, price can keep consolidating here.
📰 Fundamental Backdrop
The technical setup lines up with a strong catalyst calendar. Amazon reports Q2 2026 results on July 30 after the US close — the key near-term event, with Wall Street modeling EPS of $1.82 (up from $1.68 a year ago) on revenue near $196 billion, and the company itself having guided to $194–199 billion. The quarter is expected to benefit from Prime Day shifting into Q2, continued AWS acceleration, and a record advertising business. Sentiment into the print is bullish: analysts carry a Strong Buy consensus, KeyBanc just raised its target to $335, and Bank of America projects around $198.8 billion in revenue with roughly 33% AWS cloud growth on enterprise AI adoption — noting that Amazon's expanding relationship with Anthropic alone could add more than $1.5 billion in sequential AWS revenue. The risk to respect is the spending: 2026 capex is tracking toward roughly $200 billion (BofA thinks the outlook could rise to ~$210 billion on higher memory costs), Amazon launched a $25 billion bond sale to fund it, and there's about $1 billion in incremental costs from the Leo satellite build ahead of a Q3 launch — all of which could pressure near-term margins. Net-net: the fundamentals support the bullish structure, but July 30 is a binary event that could easily be the catalyst that resolves this HVA battle in either direction.
This analysis will be updated as the market evolves. If this breakdown added value, drop a like 👍 and a comment 💬 to support the work — and share where you see Amazon heading next! Best Regards, BigBeluga 🐳
Amazon (AMZN) – Buy Signal AlertAMZN is pulling back into a key support zone, and I'm looking for one more move lower before buyers step in.
Entry: $205.43
Stop Loss: $192.95
🎯 Targets
• Take Half: $231.88
• Final Target: $275.68
Once price reaches $231.88, move your stop loss to breakeven and let the rest of the position run toward the final target.
This setup offers a strong risk/reward if the support zone holds.
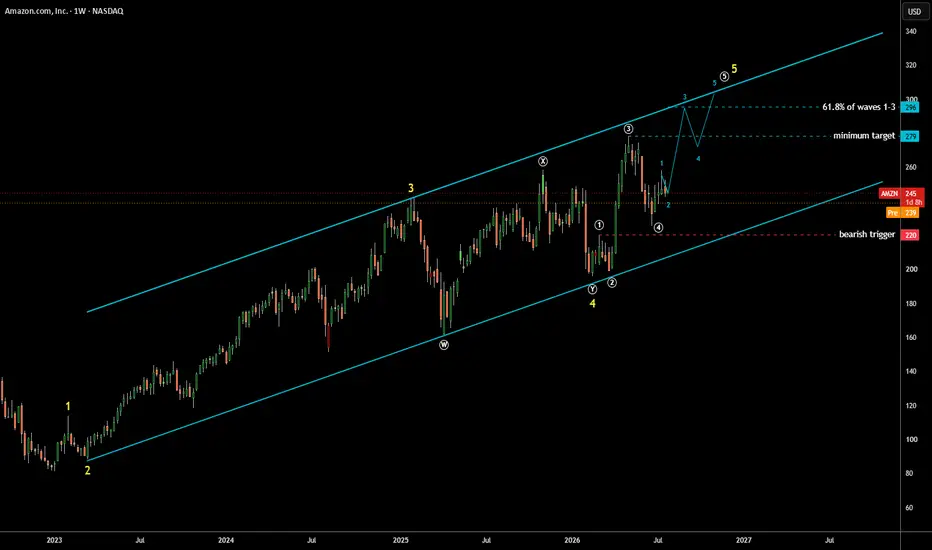
Amazon (AMZN) Has Another Spike Pending Despite Selling PressureThe stock price has built very clear bullish impulse
4 out of 5 large yellow waves are accomplished
Final wave 5 is in progress
4 out of 5 white subwaves are done
Last white wave 5 of large final yellow wave 5 kicked off last month
We've got only the first blue wave 1 completed
Blue wave 2 is about to finish soon
Blue waves 3-4-5 are expected to follow
Top of white wave 3 should be retested at $279 as the minimum target
Next is set at 61.8% of large yellow waves 1-3 in wave 5 at $296
Bearish trigger is set at $220 where white wave 1 peaked
AMAZON: Last Chance!Primary Scenario
We continue to see AMZN in a broader downtrend. In this context, the stock is likely to move below support at $220.47 in the near term.
Alternative Scenario
At this time, we are not tracking a short-term alternative scenario.
Long-Term Outlook
The ongoing broad correction is likely to bring the stock into our blue Long-Term Entry Range ($159.81–$129.30). After that, we expect another strong—though corrective—move higher before the final sell-off of the larger corrective phase begins. Ultimately, we expect the correction low to fall below our blue Long-Term Entry Range ($159.81–$129.30), but still above support at $81.43.
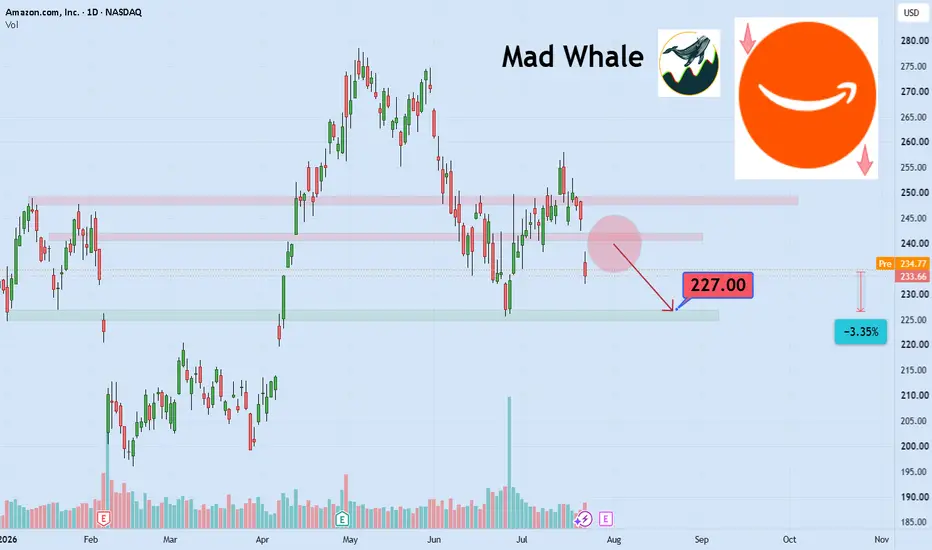
AMZN Below $235: Bounce or Another Flush?
WAIT
1 Hour
The 1 hour chart is clearly bearish. AMZN has been making lower highs and lower lows since losing the $248 area, and price remains below the descending trendline.
The recent selloff found temporary support around $231, but the bounce has been weak. AMZN needs to reclaim $235 to $236 before I would consider this a real recovery. Until then, the trend still favors sellers.
The next visible support is around $227.50. If that fails, the previous low near $223.68 becomes the next important area.
15 Minute
The 15 minute chart shows price compressing around $231 to $233 after a liquidity sweep. There are signs of accumulation near the lows, but buyers have not produced a strong reversal candle or broken the recent lower high.
The chart remains bearish and the current signal still says wait. A move above $234.77 would be the first sign that buyers are gaining control. A stronger confirmation would require price to hold above $235.
If AMZN loses $231, the small accumulation structure likely fails and sellers could push toward $230 and $227.50.
GEX
The GEX positioning supports a cautious outlook. Price is sitting between the $232.50 level and the larger $230 put level.
The $230 area is the most important near term support. A clean break below it could increase volatility and open the move toward $227.50 and $225.
Above price, $235 is the first resistance. The heavier option levels begin around $237.50, followed by $240, $242.50 and $245. These levels could slow any recovery.
Call positioning is only about 36 percent, which shows options positioning is still defensive rather than strongly bullish.
Trading Suggestion
For calls, I would wait for AMZN to reclaim $234.77 and hold above $235. The first upside target would be $237.50, followed by $240.
For puts, I would watch for a rejection near $234 to $235 or a clean break below $230. The downside targets would be $227.50 and $225.
My opinion is that AMZN is trying to build a base, but the chart has not confirmed a reversal. Below $235, sellers still have the advantage.
Does this look like quiet accumulation near $230, or is AMZN preparing for another leg lower?
Amazon Com, Inc.(AMZN): Price Approaching Trend SupportAmazon (NASDAQ: AMZN) shares are currently hovering around $246.74. Investor attention is focused on AWS's massive AI infrastructure rollout, fueled by recent $25 billion bond issuance and massive compute commitments with heavyweights like OpenAI, Anthropic, and Meta.
Technical Insight:
AMZN is making a bullish progress, stock have been ranging up slowly for a couple of days, in respect to the structure. Price is currently retesting, after breaking above the bottom resistance at $250. We are anticipating a long retracement, within $233-$238, levels.
Key Points:
A clear pullback at this levels, triggers a buy position, eyeing $270, as next possible high.
Thanks for reading.
AMAZON New round of selling expected next.Amazon Inc. (AMZN) has been trading within a 2-year Channel Up and since the May 05 2026 High, it has started its new Bearish Leg. The late June rebound on its 1W MA50 (blue trend-line) gave way to three straight green 1W candles but this may technically be the end of this dead-cat-bounce.
All three Bearish Legs of this pattern declined by at least -24.12% and the current one has many similarities with the February - March 2025 correction, which marginally breached below its 1W MA100 (green trend-line) and the 0.786 Fibonacci retracement level, before bottoming.
Given also the huge 1W RSI Lower Highs Bearish Divergence since February 2024 (against the Higher Highs of the Channel Up), such a 'smaller' correction is further justified.
Expect to see at least $210 (just below the 0.786 Fib) towards the end of the year.
---
** Please LIKE 👍, FOLLOW ✅, SHARE 🙌 and COMMENT ✍ if you enjoy this idea! Also share your ideas and charts in the comments section below! This is best way to keep it relevant, support us, keep the content here free and allow the idea to reach as many people as possible. **
---
💸💸💸💸💸💸
👇 👇 👇 👇 👇 👇
AMZN long — 3-week base breakout, targets 264/271/278Amazon spent ~3 weeks coiling in a tight base (~240-251) and has broken out to new local highs on the broad mega-cap tech rally. Classic rectangle-base breakout — buy the breakout/retest.
Setup (daily swing):
• Entry: 250-256 (live at market ~255)
• Stop: 244 (below the base's swing low; a daily close back into the range invalidates)
• TP1 264 / TP2 271 / TP3 278 (measured move → the prior 3-month high)
• R:R ≈ 1.2 / 2.0 / 2.8 — first target is modest on a tight base; the edge is in the runners toward 278.
Context: broad tech strength lifted AMZN out of its base to local highs. Heads-up: earnings are ~2 weeks out, so this is a pre-earnings swing — aim to be done before the report or step aside. Invalidation: a daily close back below the base under 244.
Not financial advice — do your own research and manage risk. Follow @Nambou_Signals for daily setups.
AMZN: Resistance Broken, Draw to C?The NASDAQ:AMZN 4h chart is showing a really clean breakout here. For a while, price was hitting a wall at that grey S&R zone around the $248–$250 area, but this latest push has finally cleared it. It's key to notice that we’re currently operating inside a monthly FVG, which acts as our Internal Range Liquidity (IRL).
Since we've tapped this IRL, the logical delivery for price is to seek out External Range Liquidity (ERL) as the primary draw. Structurally, everything is aligning nicely with this A-B-C framework. We've established a solid Wave B low, found support at the minor 'BC' block, and are now breaking upward toward the blue 'ABC Target' box between $270 and $278.
Ultimately, the big magnet sits up at the previous highs around $280, representing the major ERL and our main draw on liquidity. With that old S&R ceiling now acting as a floor underneath, the direction of travel is incredibly clear. We're in the middle of a classic IRL to ERL expansion, and all signs point to completing this Wave C leg.
AMZN | Continued stock growth- Timeframe: Weekly
- Trade type: Buy stop order
- Price: 242.42
- Take Profit: Open
- Stop Loss: 225.55 (-7.00 %)
Idea: Long on a breakout above last week's high - bullish momentum continuation.
Entry: Buy stop above last week’s high.
Stop-loss: Below the low of the same candle.
If the weekly candle closes below this level, the trade is invalidated.
Take Profit: Trailing stop following the lows of new weekly candles.
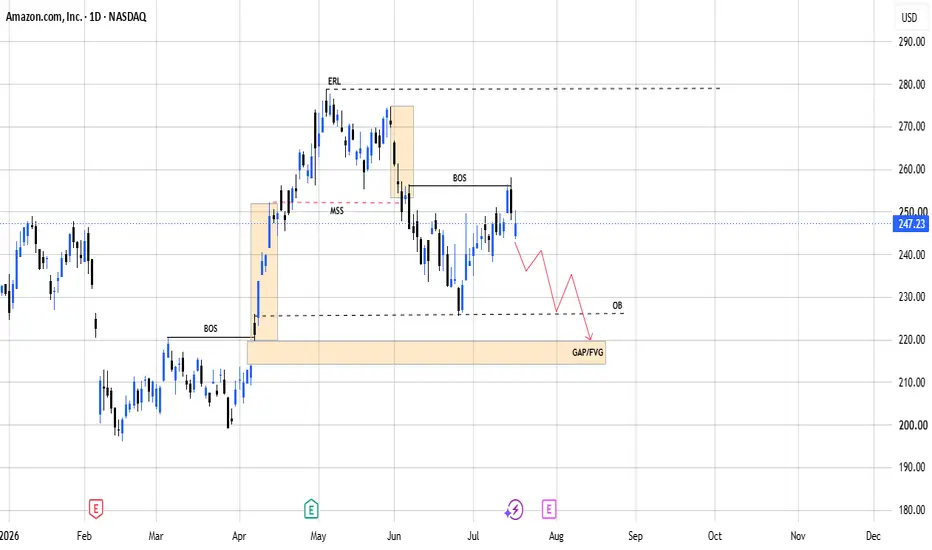
AMZNTechnical Note: From a technical perspective, AMZN closed below the BOS(Break of Structure) candle on the Daily timeframe, further strengthening the current bearish trend. This confirms this confluence as a key institutional supply zone. Meanwhile, the price remains above short-term support around 226-214 Price range.
Let the market come to your zones and show its hand. Trade safe and manage your risk! Always wait for your own confirmations before entering the market. Classic trading strategy where you lock in profits during market rallies and purchase assets at a discount when their prices pull back. The goal is to accumulate fundamentally strong assets at lower prices, anticipating they will rebound to new highs.
Risk Disclaimer: This analysis is for educational purposes only and does not constitute financial advice. Always practice proper risk and position sizing. Stop Loss Must if you want to be a profitable Trader.
MARKET VIEW:-
Current Bias: Bearish
Preferred Strategy: Sell the Rise – Wait for Confirmation
Amazon (AMZN): news flow leaning bullish — the net read
The wire has been busy on Amazon (AMZN). Weighing the stories from the last 24h against each other — new against old, and tracking which ones have already faded:
+++ Andy Jassy Says This Could Be a $50 Billion Business for Amazon
++ I Keep Backing Up the Truck and Buying Amazon Because Of This Silicon Secret
−− Data center news: Warren weighs data center moratorium after storm exposes grid strain - Planet Detroit
++ Massive $5.1B data center proposed for Salem draws praise and pushback
++ Breakingviews - ASML helps keep the AI capex snowball rolling
Net read: +++ leaning bullish — top of our scale.
What this is: a measure of which way the *news* is leaning right now — not a promise about price. Strong reads fade as the market digests them, and a fresh headline can flip the whole picture. That's exactly what we track.
The rule of this account: every read gets a public update once the market has had time to speak — the ones that landed and the ones that didn't. No deleted calls. Watch for the update on this idea.
(Informational only — not financial advice, not a signal.)
AMZN - No Longer Range Bound?I've been suffering through Amazon's mediocre performance over the last year. I am now hopeful it is breaking its range boundedness (is that a word?) in a bold move up toward the mid 300's over the next six months. It appears to have bottomed in the circle 2 wave and is now pivoting up toward circle 3. The waves align really well. I'm finally optimistic about this stock.
AMZN – Silver Zone Reclaim Into Continuation Setup | CSE CapitalAmazon is currently one of the most important focus cases inside my CSE Capital — Option Decision OS, also known as the Continuation Swing Engine.
In earlier AMZN models, I treated the stock as a high-quality continuation candidate, but not as a random buy. The key idea was to wait for the right technical location: a reclaim, a support hold, or a controlled entry zone where the risk/reward for an option strategy would become more attractive. Within my model, the Silver entry zone became the most important area to monitor.
That Silver zone is now the focus.
For me, this changes the decision structure. Amazon is no longer just a broad watchlist name. It is now a daily focus case because the stock is moving around a predefined CSE entry region where continuation can develop if buyers remain in control. The setup is especially relevant because I already have exposure through the AMZN Jun 2027 235 Call, which means the goal is not to chase or randomly add risk, but to evaluate whether the original thesis is still strengthening.
This is exactly why I built the CSE Capital Option Decision OS. The software is not designed to create blind buy signals. It is designed to bring structure into the full decision process: where is the stock relative to its Fibonacci zones, where is the trend improving, where has price reclaimed an important area, and whether the option contract itself is actually feasible.
Amazon is interesting because it sits in a very important category inside my option universe. It has the quality, scale and growth profile of a major US technology leader, but the option structure can sometimes be more workable than some of the extremely high-priced megacap names. That makes AMZN a potential portfolio growth engine when the technical structure and option feasibility align.
From a technical perspective, the current focus is the Silver zone. If AMZN continues to hold this region, rebuilds momentum and starts moving toward the next higher resistance or expansion area, the bullish continuation scenario improves. The reclaim or support hold around this zone becomes a reference point for the thesis. If price fails the zone, the model prevents me from forcing a trade just because the company is strong.
For an options strategy, this remains very important: an entry zone is not a buy signal. A Silver zone, a reclaim or a strong-looking chart only tells me that the stock deserves focus. Every option idea still needs to pass the Option Feasibility + Risk Gate inside the CSE model.
That means checking premium size, bid/ask spread, liquidity, delta, expiry, time value, portfolio exposure and risk/reward before taking any action. With AMZN, this is especially important because I already have a long-dated position. The question is not only whether the chart looks attractive, but whether additional exposure would improve the portfolio or simply increase concentration risk.
The current AMZN case is therefore about process, not hype. First the model identified Amazon as a high-quality continuation candidate. Then it marked the relevant Silver entry region. Now the stock is being monitored as a daily focus case because the technical location is becoming important again.
My view: AMZN remains one of the cleaner large-cap continuation candidates inside the CSE Capital Option Decision OS. The bullish structure improves as long as the Silver zone holds and momentum continues to build. If the stock confirms strength from this area, the existing Jun 2027 235C thesis remains supported.
Structure first.
Confirmation second.
Option feasibility third.
No chase, no emotion, only process.
AMAZON Pullback Expected! Sell!
Hello,Traders!
AMAZON is reacting beneath a horizontal supply area after failing to reclaim it. SMC suggests the zone may flip,favoring a bearish continuation toward the marked target. Time Frame 9H.
Sell!
Comment and subscribe to help us grow!
Check out other forecasts below too!
AMZN Pre-EarningsEarnings scheduled for 7-30. Historically, AMZN rises 55% of the the time over the last 8 quarters 6.51%. Multi time period confluence with Daily ema9 above the ema21 and in a squeeze with increasing momentum, 1 hr ema9 above the ema32, 15 min also in a squeeze with increasing momentum and on the 15 min chart ema9 above the ema21 the squeeze has fired long with increasing momentum.
Watch for a breakout or rejection at key resistance Amazon is currently trading in a tight range after a sharp intraday move. Price attempted to push higher but has been rejected multiple times around 245.90–246.10, making this the key resistance zone to watch.
📈 Bullish Scenario
If buyers reclaim 246.10 with strong volume and the candle closes above resistance, I will look for continuation toward:
* 246.50
* 247.00
* 248.00 if momentum accelerates.
Confirmation:
* Price above VWAP
* 9 EMA above 20 EMA
* Increasing volume
📉 Bearish Scenario
If price continues rejecting this level and volume begins favoring sellers, I expect a pullback toward:
* 245.00
* 244.60 (support)
* 244.00 if selling pressure increases.
Trading Plan
I’m waiting for confirmation rather than predicting direction. A breakout with volume favors longs, while another rejection at resistance could provide a short opportunity. Patience is key—I’ll let price show its hand before entering.