ManpowerGroup Inc.
No trades
No trades
Compare with ManpowerGroup Inc.
1.96 EUR
−11.32 M EUR
15.29 B EUR
45.69 M
Last report date
Jul 16, 2026
Report period
Q2 2026
EPS
0.87 EUR
Revenue
4.26 B EUR
Earnings call summary
Q2 saw 6% constant currency revenue growth to $4.9B, with strong performance in the U.S. and key verticals. Transformation initiatives and AI partnerships are driving operational efficiency and new revenue streams. Guidance anticipates continued growth and stable margins in Q3.
Details
Sector
Industry
CEO
Jonas Prising
Website
Headquarters
Milwaukee
Founded
1948
IPO date
May 3, 1988
ISIN
US56418H1005
CUSIP
56418H100
FIGI
BBG00FZMHMN7
Identifiers
ISIN US56418H1005
ManpowerGroup, Inc. engages in the provision of workforce solutions and services. It operates through the following geographical segments: Americas, Southern Europe, Northern Europe, Asia Pacific Middle East (APME), and Corporate. The Americas segment offers services as Manpower, Experis, and ManpowerGroup solutions through both branch and franchise offices. The Southern Europe segment provides permanent, temporary and contract recruitment, assessment and selection, training and outsourcing services. The Northern Europe segment includes a comprehensive suite of workforce solutions and services through Manpower, Experis, ManpowerGroup Solutions in the United Kingdom, the Nordics, Germany, and the Netherlands. The APME segment operates in Japan, Australia, Korea, China, and India. The company was founded by Elmer Winter and Aaron Scheinfeld in 1948 and is headquartered in Milwaukee, WI.
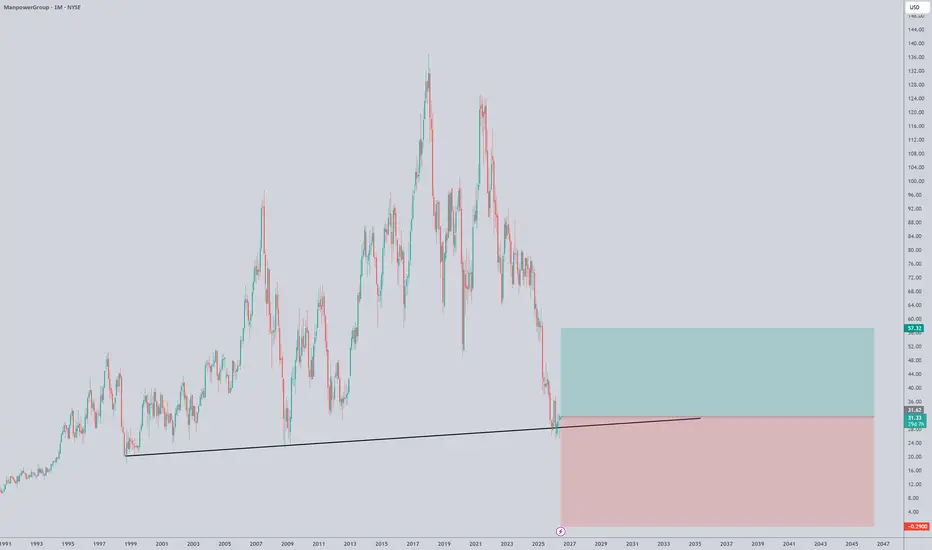
$MAN to the moon! Monthly RSI hit 30; will hit $65-75 in 60 daysNYSE:MAN has repeatedly gone up in huge ways every single time the monthly RSI has crossed below 30. We have now seen back to back months dipping below and now it’s on its way up already!
Check its history and you’ll see that typically within 2-3 months after it breaks the 30RSI it goes up 50-150%
The unknown obvious: what chart types to use for each taskFirst of all, price charts are not price charts, at least, not exactly. There are always 2 prices: the price to buy (ask) and the price to sell (bid). Real price charts are actually the history of where BBO was located. If for some reason you'll wanna check that and you don't have the real data, the
See all ideas
Summarizing what the indicators are suggesting.
Neutral
SellBuy
Strong sellStrong buy
Strong sellSellNeutralBuyStrong buy
Neutral
SellBuy
Strong sellStrong buy
Strong sellSellNeutralBuyStrong buy
Neutral
SellBuy
Strong sellStrong buy
Strong sellSellNeutralBuyStrong buy
An aggregate view of professional's ratings.
Neutral
SellBuy
Strong sellStrong buy
Strong sellSellNeutralBuyStrong buy
Neutral
SellBuy
Strong sellStrong buy
Strong sellSellNeutralBuyStrong buy
Neutral
SellBuy
Strong sellStrong buy
Strong sellSellNeutralBuyStrong buy
Displays a symbol's price movements over previous years to identify recurring trends.
3.951% YTM
Maturity dateDec 13, 2030
Coupon3.75% (Fixed)
3.206% YTM
Maturity dateJun 30, 2027
Coupon3.50% (Fixed)
See all MPW bonds
Weight0.13%
Market value145.81 M
Weight0.08%
Market value61.03 M
Weight1.80%
Market value36.76 M
Weight0.03%
Market value22.82 M
Weight0.13%
Market value22.65 M
Weight0.16%
Market value22.42 M
Weight0.26%
Market value21.15 M
Weight1.50%
Market value14.73 M
Weight0.05%
Market value14.29 M
Weight0.26%
Market value12.84 M
Weight0.05%
Market value11.34 M
Explore more ETFs
Frequently asked questions
The current price of MPW is 46.49 EUR — it has increased by 3.52% in the past 24 hours. Watch ManpowerGroup Inc. stock price performance more closely on the chart.
Depending on the exchange, the stock ticker may vary. For instance, on GETTEX exchange ManpowerGroup Inc. stocks are traded under the ticker MPW.
MPW stock has fallen by −0.07% compared to the previous week, the month change is a 61.09% rise, over the last year ManpowerGroup Inc. has showed a 22.99% increase.
We've gathered analysts' opinions on ManpowerGroup Inc. future price: according to them, MPW price has a max estimate of 62.93 EUR and a min estimate of 41.08 EUR. Watch MPW chart and read a more detailed ManpowerGroup Inc. stock forecast: see what analysts think of ManpowerGroup Inc. and suggest that you do with its stocks.
MPW stock is 2.76% volatile and has beta coefficient of 0.64. Track ManpowerGroup Inc. stock price on the chart and check out the list of the most volatile stocks — is ManpowerGroup Inc. there?
Today ManpowerGroup Inc. has the market capitalization of 2.10 B, it has increased by 28.17% over the last week.
Yes, you can track ManpowerGroup Inc. financials in yearly and quarterly reports right on TradingView.
ManpowerGroup Inc. is going to release the next earnings report on Oct 15, 2026. Keep track of upcoming events with our Earnings Calendar.
MPW earnings for the last quarter are 0.87 EUR per share, whereas the estimation was 0.83 EUR resulting in a 4.09% surprise. The estimated earnings for the next quarter are 0.89 EUR per share. See more details about ManpowerGroup Inc. earnings.
ManpowerGroup Inc. revenue for the last quarter amounts to 4.26 B EUR, despite the estimated figure of 4.13 B EUR. In the next quarter, revenue is expected to reach 4.27 B EUR.
MPW net income for the last quarter is 46.85 M EUR, while the quarter before that showed 2.16 M EUR of net income which accounts for 0.00% change. Track more ManpowerGroup Inc. financial stats to get the full picture.
Yes, MPW dividends are paid semi-annually. The last dividend per share was 0.62 EUR. As of today, Dividend Yield (TTM)% is 2.81%. Tracking ManpowerGroup Inc. dividends might help you take more informed decisions.
As of Jul 27, 2026, the company has 25.4 K employees. See our rating of the largest employees — is ManpowerGroup Inc. on this list?
EBITDA measures a company's operating performance, its growth signifies an improvement in the efficiency of a company. ManpowerGroup Inc. EBITDA is 424.23 M EUR, and current EBITDA margin is 2.18%. See more stats in ManpowerGroup Inc. financial statements.
Like other stocks, MPW shares are traded on stock exchanges, e.g. Nasdaq, Nyse, Euronext, and the easiest way to buy them is through an online stock broker. To do this, you need to open an account and follow a broker's procedures, then start trading. You can trade ManpowerGroup Inc. stock right from TradingView charts — choose your broker and connect to your account.
Investing in stocks requires a comprehensive research: you should carefully study all the available data, e.g. company's financials, related news, and its technical analysis. So ManpowerGroup Inc. technincal analysis shows the strong buy rating today, and its 1 week rating is buy. Since market conditions are prone to changes, it's worth looking a bit further into the future — according to the 1 month rating ManpowerGroup Inc. stock shows the buy signal. See more of ManpowerGroup Inc. technicals for a more comprehensive analysis.
If you're still not sure, try looking for inspiration in our curated watchlists.