Tyler Technologies, Inc. TYLTyler Technologies, Inc. is a leading software company providing cloud-based solutions and digital platforms for government agencies across North America. Its business benefits from long-term demand for public sector digital transformation, recurring software revenue, and mission-critical services.
The long-term technical structure remains constructive, with the higher timeframe continuing to support a positive market outlook. However, the lower timeframe has not yet delivered the level of confirmation that would strengthen confidence in the broader trend.
Key technical observations:
• The higher-timeframe trend remains intact.
• Lower-timeframe buyer participation has yet to become clearly established.
• Waiting for bullish price structure and objective entry signals may provide higher-quality confirmation.
• The 200-period moving average remains one of the simplest tools for monitoring whether buyers are beginning to regain control.
• Short-term volatility, including the possibility of another **Lower Low (LL)**, would not necessarily invalidate the long-term bullish structure if the higher-timeframe trend continues to hold.
Technical analysis helps identify market structure and improve timing, while fundamental analysis—using tools such as DCF, FCFF, FCFE, and intrinsic value assessment—offers deeper insight into the quality and valuation of the business. Combining both approaches can lead to more informed long-term investment decisions.
Many experienced market participants prefer to let the market confirm its direction before committing capital, focusing on owning fundamentally strong businesses over time rather than reacting to every short-term price movement.
This publication reflects a personal interpretation of market structure and publicly available information. It is intended solely for educational and informational purposes and should not be considered financial advice or a recommendation to buy, sell, or hold any financial instrument. Independent research, prudent risk management, and personal due diligence should always precede any investment decision.
Tyler Technologies, Inc.
No trades
No trades
In-depth trading ideas
Tyler Technologies | TYL | Long at $288.00Technical Analysis
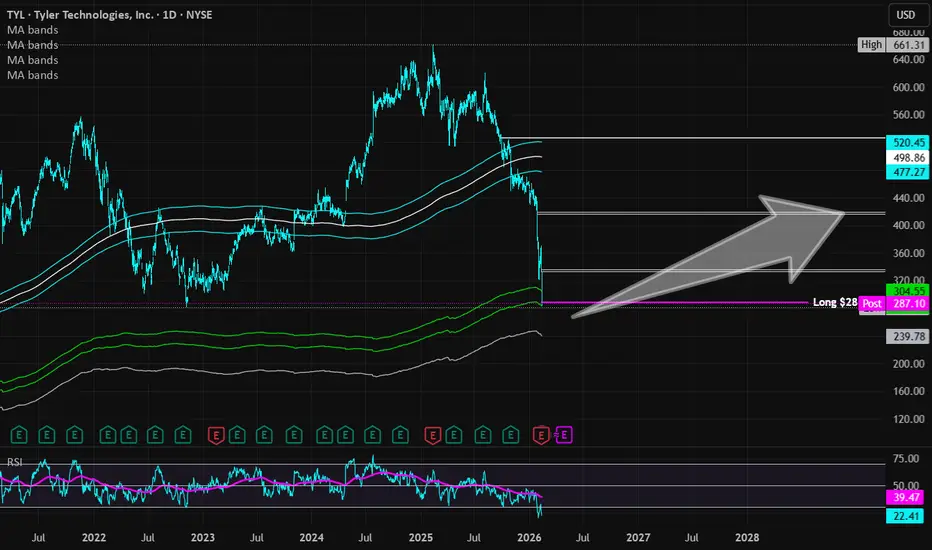
The stock price for Tyler Technologies NYSE:TYL entered the bottom of my "crash" simple moving average zone (green lines). This is often an area of algorithmic share accumulation and can signal a bottom - but not guaranteed. There is a risk of a continued fall into the low $200s in the near-term, but given the potential earnings and revenue growth, there is a high chance of a rebound in the long-term.
Earnings-Per-Share and Revenue Growth Between 2025 & 2028
Projected Earnings-Per-Share Growth : +25.5% (from $12.55 in 2025 to $15.75 in 2028)
Projected Revenue Growth : +43.0% (from $2.0 billion in 2025 to $2.86 billion in 2028)
Health
Debt-to-Equity: 0.2x (healthy)
Altman's Z-Score/Bankruptcy Risk: 8.5 (excellent / low risk)
Quick Ratio/Ability to pay current bills: 1 (okay, ideally between 1.5 and 3)
Insiders
Major selling (**warning**) and no buying
Action
Tyler Technologies NYSE:TYL provides integrated software, technology services, and digital solutions exclusively for the public sector, including federal, state, and local governments, as well as schools. They specialize in automating processes for departments like courts, public safety, property appraisal, and tax collection to improve efficiency and resident services. It's not going anywhere. While there may be some continued near-term weakness, its market niche is strong as demand picks up for data and AI analytics. Thus, at $288.00, NYSE:TYL is in a personal buy zone.
Targets in 2028
$336.00 (+16.7%)
$415.00 (+44.1%)
Tyler Technologies (TYL) – Long Setup Technical AnalysisTyler Technologies (TYL) – Long Setup Technical Analysis
TYL is currently trading at a technically high-quality inflection zone, where a bullish harmonic pattern has completed its PRZ exactly at the Anchored VWAP (main). This precise alignment marks a structurally important value-based reaction level, often defended by institutional order flow.
Adding further confluence, a large Fair Value Gap (FVG) is located directly below the VWAP, providing an additional layer of structural support. This stacked support configuration significantly reduces downside risk and reinforces the probability of a bullish reaction and continuation move.
From a market-structure perspective, this setup represents a controlled pullback into value within an intact bullish context, rather than a distribution phase. The combination of harmonic completion, VWAP equilibrium, and underlying inefficiency support creates a high-quality asymmetric long environment.
Bias: Long on bullish reaction at the Anchored VWAP
Target: Rotation toward prior highs / upper value area
Invalidation: Sustained acceptance below the VWAP and into the FVG
Context: Bullish harmonic PRZ + VWAP main + supportive FVG = high-confidence long setup
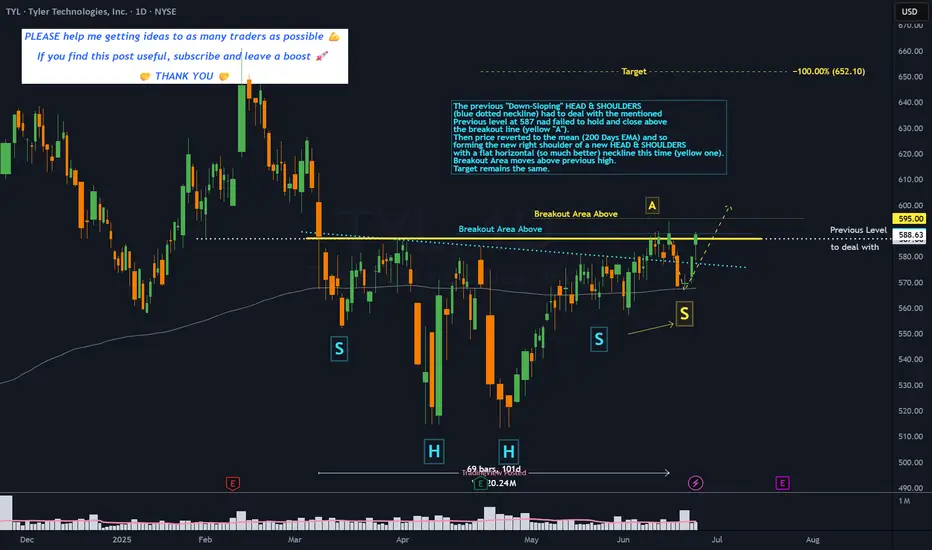
TYL - 3 months HEAD & SHOULDERS══════════════════════════════
Since 2014, my markets approach is to spot
trading opportunities based solely on the
development of
CLASSICAL CHART PATTERNS
🤝Let’s learn and grow together 🤝
══════════════════════════════
Hello Traders ✌
After a careful consideration I came to the conclusion that:
- it is crucial to be quick in alerting you with all the opportunities I spot and often I don't post a good pattern because I don't have the opportunity to write down a proper didactical comment;
- since my parameters to identify a Classical Pattern and its scenario are very well defined, many of my comments were and would be redundant;
- the information that I think is important is very simple and can easily be understood just by looking at charts;
For these reasons and hoping to give you a better help, I decided to write comments only when something very specific or interesting shows up, otherwise all the information is shown on the chart.
Thank you all for your support
🔎🔎🔎 ALWAYS REMEMBER
"A pattern IS NOT a Pattern until the breakout is completed. Before that moment it is just a bunch of colorful candlesticks on a chart of your watchlist"
═════════════════════════════
⚠ DISCLAIMER ⚠
Breakout Area, Target, Levels, each line drawn on this chart and any other content represent just The Art Of Charting’s personal opinion and it is posted purely for educational purposes. Therefore it must not be taken as a direct or indirect investing recommendations or advices. Entry Point, Initial Stop Loss and Targets depend on your personal and unique Trading Plan Tactics and Money Management rules, Any action taken upon these information is at your own risk.
═════════════════════════════
TYL set for a recoveryAlthough $TYL missed EPS and REV in the latest report, it happened by a small margin and the company recorded +16% in revenues in 2022 and +18% on the Operating Income. $TYL has a good business growth history and the stock price have some perspectives to improve.
I post these ideas for my journal. Do your homework and size your position accordingly.
$TYLStrong support on the trendline & 200dMA(blue). 20dMA (green) crossing upwards through the 50dMA(red) which is medium term bullish signal. Our STOCH is hanging around in oversold territory currently & just recently has a nice hammer candle.
Some DD - Tyler Technologies just recently acquired ReadyStub, which makes scheduling software for school districts. ReadyStub works with approx. 1k school districts across the United States & TYL already has 2k school districts as clients.
Some would say TYL is significantly overvalued, but the long term return of this company I love. Its projected to grow 10.78% annually over the next five years. They have strong financial strength with a good cash to debt ratio and interest coverage. They are at 30.47 which is better than 75% of the companies in the software industry. $TYL has been profitable 10 times over the last 10 years. Over the past 12 months the company has had a revenue of $1.1 billion dollars. Its operating margin is 15.49% which ranks them better than 82% of the companies in software industry.
This is not financial advice, I am not a financial advisor. This is solely my opinion.
Why I Often Look at Panics as OpportunityPanic selling and panic buying usually show up at the end of a move. Here I us a simple "indicator" I made to help identify if a move is particularly special.
First, I have always like ATR (Average True Range) as a useful reminder of what to expect and at one time I even used it to calculate my position size for risk purposes. I wrote two little hybrids of this just for one bar extremes from the previous close. One is for the buying climax and the other for the selling climax.
As I explained in the video, I worked for many years as a "specialist" - or market maker on a stock exchange floor. In this job, I regularly had to buy if nobody else would and take the sell side if nobody else would sell. This typically had me short near the short term highs and long near the bottoms - often not on purpose! But it does explain how the pros are often on the right side at market extremes. Pros do tend to "fade" extreme moves meaning they take the opposite side of panic moves out of experience.
As Mr. Buffett says, "be fearful when others are greedy and be greedy when others are fearful"
Happy trading,
Rob
Here is the code for my scripts
// This source code is subject to the terms of the Mozilla Public License 2.0 at mozilla.org
// © rbarnesy
//@version=4
study("LR from Prev close")
plot((close -low)/close *100)
// This source code is subject to the terms of the Mozilla Public License 2.0 at mozilla.org
// © rbarnesy
//@version=4
study("HR from Prev close")
plot((high-close )/close *100)
People about to have Sharp Buy Signals for this one: $385 TargetFirst off, please don't take anything I say seriously or as financial advice. As always, this is on an opinion based basis. That being said, I believe TYL given its bullish momentum right now is soon going to pass the $380 threshold, and if the market is looking bullish may also pass that $385 threshold for a new high. As a short target, it looks like the market analyst are calling a strong buy on this one. Risk is medium.
$TYL:NYSE - TYLER TECHNOLOGIES - Holding up well.Tyler is another stock that has been holding up pretty well so far throughout the current downturn. A 12% Trail would have kept you in for the year for a 74%+ gain. Could be worth a watch.
Tyler Technologies, Inc. engages in the provision of integrated technology and management solutions and services for public sector with a focus on local governments. It operates through the Enterprise Software, and Appraisal and Tax segments. The Enterprise Software segment provides municipal and county governments and schools with software systems to meet their information technology and automation needs for mission-critical back-office functions such as financial management, courts, and justice processes. The Appraisal and Tax segment provides systems and software that automate the appraisal and assessment of real and personal property, as well as property appraisal outsourcing services for local governments and taxing authorities. The company was founded in 1966 and is headquartered in Plano, TX.