VTR Acceptance Signals Continuation PhaseAcceptance confirmed above the Value Triangle (VT). Structure remains valid above the Boundary Line (BL), with consistent VT behaviour supporting the trend. T1 projected from VT; structure fails on a close below BL.
Sector context:
Healthcare REITs have shown steady relative strength over the past
Ventas, Inc.
No trades
No trades
Compare with Ventas, Inc.
Key facts today
Ventas (VTR) set to report Q2 2026 results for period ending June 30: analysts expect revenue ~$1.68B (up 18.2% Y/Y) and EPS about $0.13 per share. 1
0.49 EUR
214.03 M EUR
4.97 B EUR
483.43 M
Next report date
—
Report period
—
EPS estimate
—
Revenue estimate
—
Details
Sector
Industry
CEO
Debra A. Cafaro
Website
Headquarters
Chicago
Founded
1983
IPO date
Apr 2, 1992
ISIN
US92276F1003
CUSIP
92276F100
FIGI
BBG00RC6RQ79
Identifiers
ISIN US92276F1003
Ventas, Inc. engages in the acquisition and ownership of seniors housing and healthcare properties. It operates through the following segments: Senior Housing Operating Portfolio (SHOP), Outpatient Medical and Research Portfolio (OM&R), and Triple-net Leased Properties (NNN). The SHOP segment is involved in owning and investing in senior housing communities throughout the United States and Canada. The OM&R segment refers to acquiring, owning, development, leasing and managing outpatient medical buildings and research centers throughout the United States. The NNN segment focuses on investing and owning senior housing communities, skilled nursing facilities, long-term acute care facilities, freestanding inpatient rehabilitation facilities, and other healthcare facilities throughout the United States and the United Kingdom. The company was founded in 1983 and is headquartered in Chicago, IL.
Ventas, Inc. (VTR) – Short Setup Technical AnalysisVentas, Inc. (VTR) – Short Setup Technical Analysis
VTR is currently trading above the Anchored VWAP, with price positioned between the 2nd and 3rd VWAP deviation bands, signaling a clear overextension away from fair value. At these levels, upside continuation typically becomes increasingly ineffic
Watchlist: VTRVTR came up on my stock scanner, so I'm adding it to my watchlist. I got a setup signal(1) and with above average volume(2). Looking to enter long near the close of the day if the stock can manage to close above the last candle highs(3) with a stop-loss below (4) and a price target above(5).
"Wor
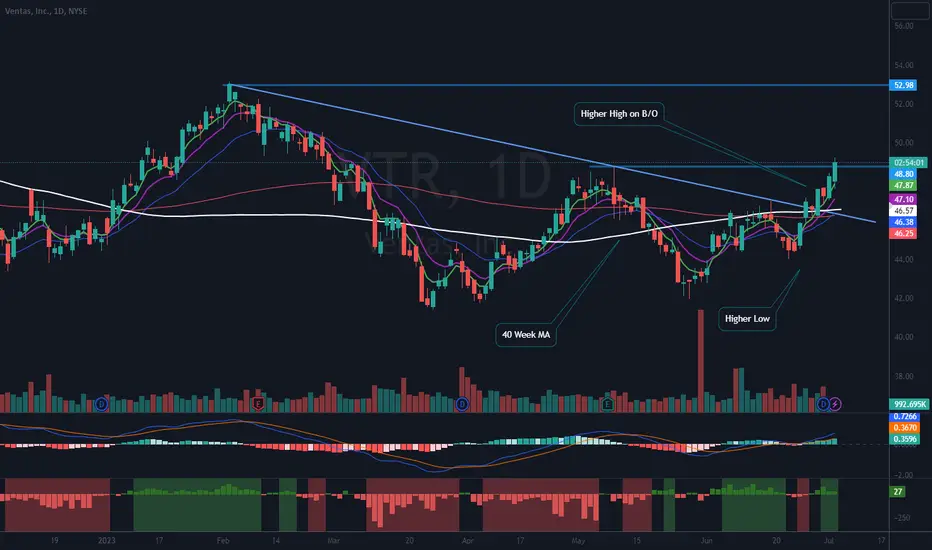
$VTR Broke Out June 29thNYSE:VTR broke out with a bullish engulfing candle on June 29. I like that breakout because of the engulfing candle, it took back the 40-week MA (White), it broke the downtrend line. NYSE:VTR was on my radar, but I missed the breakout on the 29th. I did start a ¼ sized position on the 30th on the
See all ideas
Summarizing what the indicators are suggesting.
Neutral
SellBuy
Strong sellStrong buy
Strong sellSellNeutralBuyStrong buy
Neutral
SellBuy
Strong sellStrong buy
Strong sellSellNeutralBuyStrong buy
Neutral
SellBuy
Strong sellStrong buy
Strong sellSellNeutralBuyStrong buy
An aggregate view of professional's ratings.
Neutral
SellBuy
Strong sellStrong buy
Strong sellSellNeutralBuyStrong buy
Neutral
SellBuy
Strong sellStrong buy
Strong sellSellNeutralBuyStrong buy
Neutral
SellBuy
Strong sellStrong buy
Strong sellSellNeutralBuyStrong buy
Displays a symbol's price movements over previous years to identify recurring trends.
6.106% YTM
Maturity dateApr 15, 2049
Coupon4.88% (Fixed)
6.056% YTM
Maturity dateSep 30, 2043
Coupon5.70% (Fixed)
6.006% YTM
Maturity dateFeb 1, 2045
Coupon4.38% (Fixed)
5.485% YTM
Maturity dateFeb 15, 2036
Coupon5.00% (Fixed)
5.454% YTM
Maturity dateJan 15, 2035
Coupon5.00% (Fixed)
5.448% YTM
Maturity dateJul 1, 2034
Coupon5.63% (Fixed)
5.192% YTM
Maturity dateJul 15, 2032
Coupon5.10% (Fixed)
5.167% YTM
Maturity dateSep 1, 2031
Coupon2.50% (Fixed)
5.009% YTM
Maturity dateJan 15, 2029
Coupon4.40% (Fixed)
4.998% YTM
Maturity dateNov 15, 2030
Coupon4.75% (Fixed)
4.970% YTM
Maturity dateJan 15, 2030
Coupon3.00% (Fixed)
See all VEN bonds
Weight2.61%
Market value1.88 B
Weight0.06%
Market value1.37 B
Weight0.07%
Market value1.12 B
Weight0.42%
Market value935.54 M
Weight0.08%
Market value660.75 M
Weight0.08%
Market value600.70 M
Weight4.85%
Market value424.87 M
Weight0.16%
Market value410.18 M
Weight3.26%
Market value382.68 M
Weight0.95%
Market value370.07 M
Weight0.95%
Market value330.74 M
Explore more ETFs
Frequently asked questions
The current price of VEN is 88.27 EUR — it has decreased by −0.23% in the past 24 hours. Watch Ventas, Inc. stock price performance more closely on the chart.
Depending on the exchange, the stock ticker may vary. For instance, on GETTEX exchange Ventas, Inc. stocks are traded under the ticker VEN.
VEN stock has risen by 4.90% compared to the previous week, the month change is a 14.51% rise, over the last year Ventas, Inc. has showed a 54.81% increase.
We've gathered analysts' opinions on Ventas, Inc. future price: according to them, VEN price has a max estimate of 100.21 EUR and a min estimate of 79.12 EUR. Watch VEN chart and read a more detailed Ventas, Inc. stock forecast: see what analysts think of Ventas, Inc. and suggest that you do with its stocks.
VEN stock is 0.75% volatile and has beta coefficient of 0.04. Track Ventas, Inc. stock price on the chart and check out the list of the most volatile stocks — is Ventas, Inc. there?
Today Ventas, Inc. has the market capitalization of 43.00 B, it has increased by 3.84% over the last week.
Yes, you can track Ventas, Inc. financials in yearly and quarterly reports right on TradingView.
Ventas, Inc. is going to release the next earnings report on Jul 29, 2026. Keep track of upcoming events with our Earnings Calendar.
VEN earnings for the last quarter are 0.10 EUR per share, whereas the estimation was 0.11 EUR resulting in a −10.47% surprise. The estimated earnings for the next quarter are 0.12 EUR per share. See more details about Ventas, Inc. earnings.
Ventas, Inc. revenue for the last quarter amounts to 1.43 B EUR, despite the estimated figure of 1.37 B EUR. In the next quarter, revenue is expected to reach 1.47 B EUR.
VEN net income for the last quarter is 48.39 M EUR, while the quarter before that showed 59.77 M EUR of net income which accounts for 0.00% change. Track more Ventas, Inc. financial stats to get the full picture.
Yes, VEN dividends are paid quarterly. The last dividend per share was 0.46 EUR. As of today, Dividend Yield (TTM)% is 1.99%. Tracking Ventas, Inc. dividends might help you take more informed decisions.
Ventas, Inc. dividend yield was 2.48% in 2025, and payout ratio reached 353.33%. The year before the numbers were 3.06% and 923.55% correspondingly. See high-dividend stocks and find more opportunities for your portfolio.
As of Jul 28, 2026, the company has 542 employees. See our rating of the largest employees — is Ventas, Inc. on this list?
EBITDA measures a company's operating performance, its growth signifies an improvement in the efficiency of a company. Ventas, Inc. EBITDA is 1.96 B EUR, and current EBITDA margin is 37.29%. See more stats in Ventas, Inc. financial statements.
Like other stocks, VEN shares are traded on stock exchanges, e.g. Nasdaq, Nyse, Euronext, and the easiest way to buy them is through an online stock broker. To do this, you need to open an account and follow a broker's procedures, then start trading. You can trade Ventas, Inc. stock right from TradingView charts — choose your broker and connect to your account.
Investing in stocks requires a comprehensive research: you should carefully study all the available data, e.g. company's financials, related news, and its technical analysis. So Ventas, Inc. technincal analysis shows the buy rating today, and its 1 week rating is buy. Since market conditions are prone to changes, it's worth looking a bit further into the future — according to the 1 month rating Ventas, Inc. stock shows the strong buy signal. See more of Ventas, Inc. technicals for a more comprehensive analysis.
If you're still not sure, try looking for inspiration in our curated watchlists.