GIGGLE PERPETUAL TRADE SELL SETUP Short from $50.30GIGGLE PERPETUAL TRADE
SELL SETUP
Short from $50.30
Currently $50.30
Targeting $42.30 or Down
(Trading plan IF GIGGLE
go up to $60 will add more shorts)
Follow the notes for updates
In the event of an early exit,
this analysis will be updated.
Its not a Financial advice
In-depth trading ideas
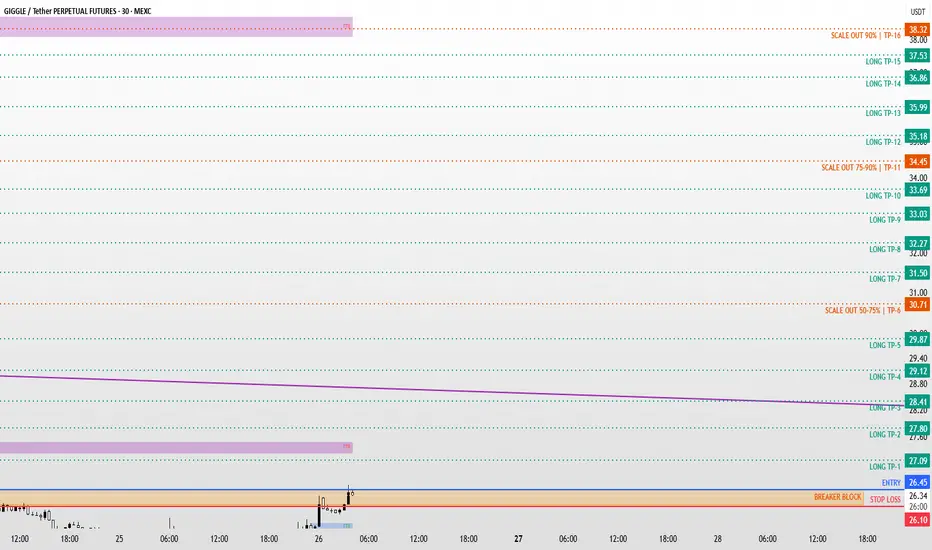
GIGGLE / GIGGLEUSDT Long Setup | Breaker Block ReclaimMARKET ANALYSIS
GIGGLE is currently reacting from a key technical area highlighted on the chart.
As long as the protected support zone remains intact, the bullish market structure remains valid and higher liquidity targets may continue to attract price action.
A breakdown below the invalidation level would weaken the current bullish scenario and require a reassessment of market conditions.
📍 Entry, Stop Loss and Take Profit levels are marked directly on the chart.
━━━━━━━━━━━━━━
⚠️ DISCLAIMER
This publication is provided solely for educational and market observation purposes.
Nothing contained in this analysis should be considered financial advice, investment advice, or a recommendation to buy or sell any financial instrument.
All trading and investment decisions remain solely the responsibility of the individual trader.
Always conduct your own research and apply proper risk management before entering any position.
━━━━━━━━━━━━━━
🎯 PARALOG
▪️Crypto Market Analysis
▪️BTC Futures Signals
▪️Bitcoin & Altcoin Market Analysis
Precision • Momentum • Timing
━━━━━━━━━━━━━━
Exchange: #MEXC Futures
#bitcoin #btc #crypto #futures #technicalanalysis
CAN GIGGLE NARRATIVE SUSTAIN MOMENTUM?On 31 July 2026, amid a mixed broader market, Giggle Fund (GIGGLE) was the session's top gainer. The rally occurred as Bitcoin slipped below $64,000, indicating a rotation of capital into high-risk, smaller-cap assets. The token's 24-hour trading volume spiked to $67.73 million, reflecting heightened speculative activity. This is bullish for GIGGLE in the short term as it demonstrates strong trader appetite and momentum, potentially driven by its unique charity narrative. However, such extreme volatility also signals high risk, as prices can reverse quickly if sentiment shifts. Binance founder Changpeng "CZ" Zhao publicly stated that the $GIGGLE meme coin was not an official project launched by his educational charity, Giggle Academy. This clarification came after the token's price had surged on speculation of his endorsement, leading to a subsequent sharp decline. This was bearish for GIGGLE at the time, as it removed a key narrative driver and raised questions about transparency. The event underscores the inherent risks in meme coins driven by celebrity associations, though Binance's subsequent pledge to donate trading fees provided a partial counterbalance. Giggle Fund's trajectory is currently defined by volatile price surges and steady exchange adoption, all underpinned by its charitable mission. The key question now is whether its utility-driven narrative can sustain momentum beyond speculative cycles.
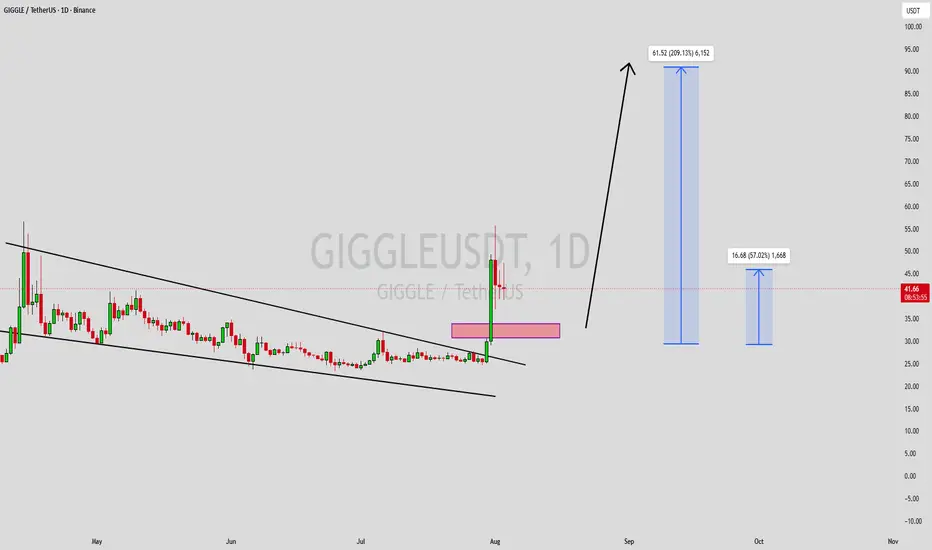
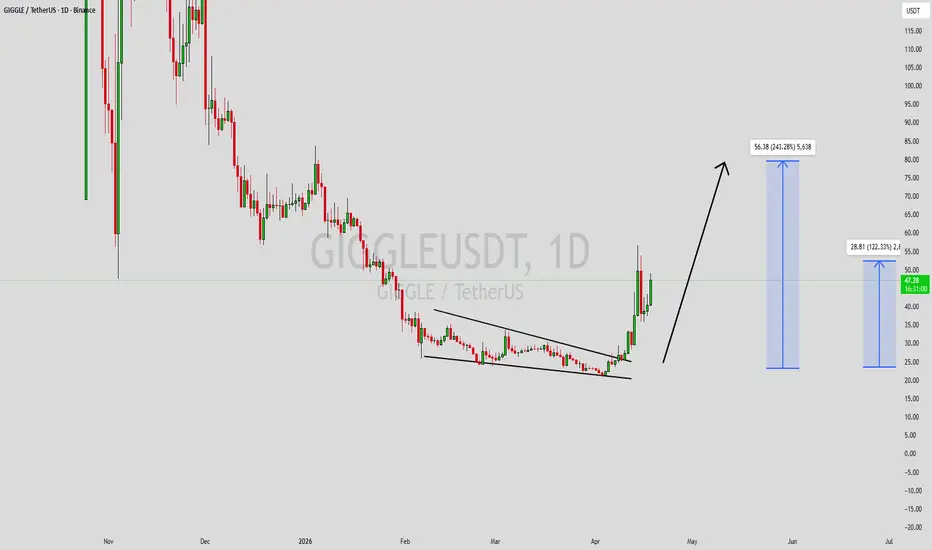
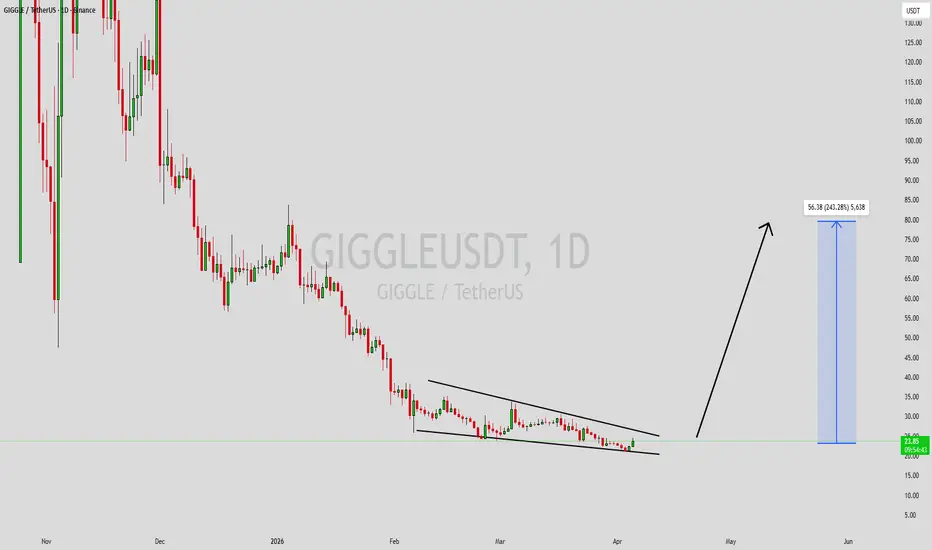
GIGGLEUSDT Forming Falling WedgeGIGGLEUSDT is forming a clear falling wedge pattern, a classic bullish wave signal that often indicates an upcoming breakout. The price has been consolidating within a narrowing range, suggesting that selling pressure is weakening while buyers are beginning to regain control. With consistent volume confirming accumulation at lower levels, the setup hints at a potential bullish breakout soon. The projected move could lead to an impressive gain of around 190% to 200% once the price breaks above the wedge resistance.
This falling wedge pattern is typically seen at the end of downtrends or corrective phases, and it represents a potential shift in market sentiment from bearish to bullish. Traders closely watching GIGGLEUSDT are noting the strengthening momentum as it nears a breakout zone. The healthy trading volume adds confidence to this pattern, showing that market participants are positioning early in anticipation of a reversal.
Investors’ growing interest in GIGGLEUSDT reflects rising confidence in the project’s long-term fundamentals and current technical strength. If the breakout confirms with sustained buying volume, this could mark the start of a fresh bullish leg. Traders might find this a valuable setup for medium-term gains, especially as the falling wedge pattern completes and buying momentum continues to accelerate.
✅ Show your support by hitting the like button and
✅ Leaving a comment below! (What is You opinion about this Coin)
Your feedback and engagement keep me inspired to share more insightful market analysis with you!
GIGGLEUSDT Forming Bullish MomentumGIGGLEUSDT is forming a clear bullish momentum pattern, a classic bullish wave signal that often indicates an upcoming breakout. The price has been consolidating within a narrowing range, suggesting that selling pressure is weakening while buyers are gradually regaining control. With consistent trading volume confirming accumulation at lower levels, the current setup hints at a potential bullish breakout in the near future. If the breakout is confirmed, the projected move could lead to an impressive gain of around 190% to 200%.
This bullish momentum pattern is commonly seen at the end of downtrends or corrective phases, signaling a potential shift in market sentiment from bearish to bullish. Traders closely watching GIGGLEUSDT are noticing strengthening momentum as the price approaches a key breakout zone. Healthy trading volume further reinforces this setup, showing that market participants may already be positioning themselves ahead of a possible upward move.
Growing investor interest in GIGGLEUSDT reflects increasing confidence in the project's long-term potential and its current technical structure. If buyers manage to break above the resistance level with sustained volume, it could trigger the beginning of a powerful bullish rally. The ongoing consolidation suggests that accumulation is taking place, creating favorable conditions for a strong continuation move once resistance is cleared.
Traders may find this an attractive medium-term opportunity, especially as the bullish momentum pattern nears completion and buying pressure continues to build. A confirmed breakout could attract additional market participation and potentially accelerate the move toward the projected upside target.
✅ Show your support by hitting the like button.
✅ Leaving a comment below! (What is You opinion about this Coin)
Your feedback and engagement keep me inspired to share more insightful market analysis with you!
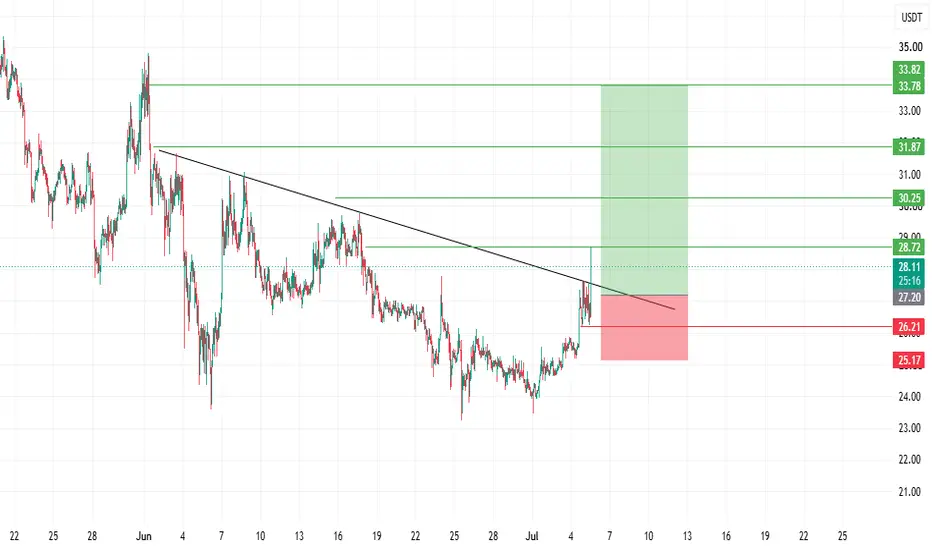
GIGG USDT LONG SIGNAL#15 GIGG/USDT – Trade Setup (LONG)
📈 Position Type: LONG
🕒 Timeframe: 1 H
📊 Market: Futures
💰 Entry Zone:
27.20
26.20
🛑 Stop-Loss:
25.10
🎯 Take-Profit Targets:
• TP1: 28.70
• TP2: 30.25
• TP3: 31.87
• TP4: 33.78
TP5:
TP6:
⚙️ Leverage:
5- 3
⚠️ After reaching TP1, move Stop-Loss to Entry Price.
📌 Risk Management:
Risk only 1–2% of your capital per trade.
Always confirm the setup on your chart before entry
GIGGLE / GIGGLEUSDT Long Setup | Breaker Block ReclaimMARKET ANALYSIS
GIGGLE is currently reacting from a key technical area highlighted on the chart.
As long as the protected support zone remains intact, the bullish market structure remains valid and higher liquidity targets may continue to attract price action.
A breakdown below the invalidation level would weaken the current bullish scenario and require a reassessment of market conditions.
📍 Entry, Stop Loss and Take Profit levels are marked directly on the chart.
━━━━━━━━━━━━━━
⚠️ DISCLAIMER
This publication is provided solely for educational and market observation purposes.
Nothing contained in this analysis should be considered financial advice, investment advice, or a recommendation to buy or sell any financial instrument.
All trading and investment decisions remain solely the responsibility of the individual trader.
Always conduct your own research and apply proper risk management before entering any position.
━━━━━━━━━━━━━━
🎯 PARALOG
▪️Crypto Market Analysis
▪️BTC Futures Signals
▪️Bitcoin & Altcoin Market Analysis
Precision • Momentum • Timing
━━━━━━━━━━━━━━
Exchange: #MEXC Futures
#bitcoin #btc #crypto #futures #technicalanalysis
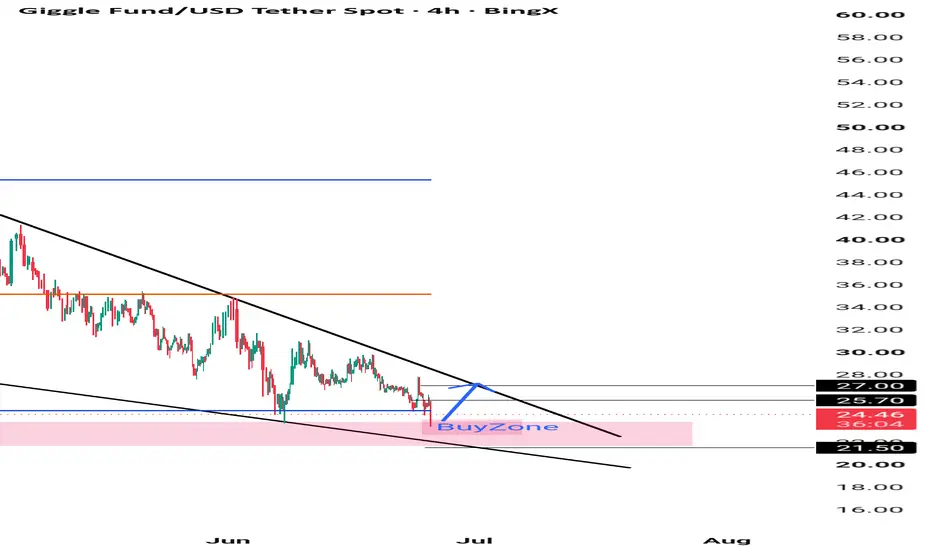
Swing Trade for #GIGGLE/USDT | 4H TFSwing Trade for #GIGGLE/USDT | 4H TF
GIGGLE/USDT is testing a major demand zone while approaching the lower boundary of a long-term falling channel. The current area has acted as strong support in the past, and sellers are losing momentum near this region. A bounce from this zone could lead to a relief rally toward key resistance levels.
Fundamental:
Giggle is a Web3 social platform that combines blockchain technology with community engagement, aiming to build a decentralized ecosystem for creators and users.
Entry: $24.40 – $23.15
Target 1: $24.78
Target 2: $25.00
Target 3: $25.38
Target 4: $25.63
Long-Term Holding: $27.00
Risk Management:
• Book partial profits at each target.
• After TP1, move SL to Entry.
• After TP2, move SL to TP1.
• Trail your SL higher if momentum continues.
SL: $21.50 (4H candle close below support)
WAIT FOR THE ENTRY ⏳
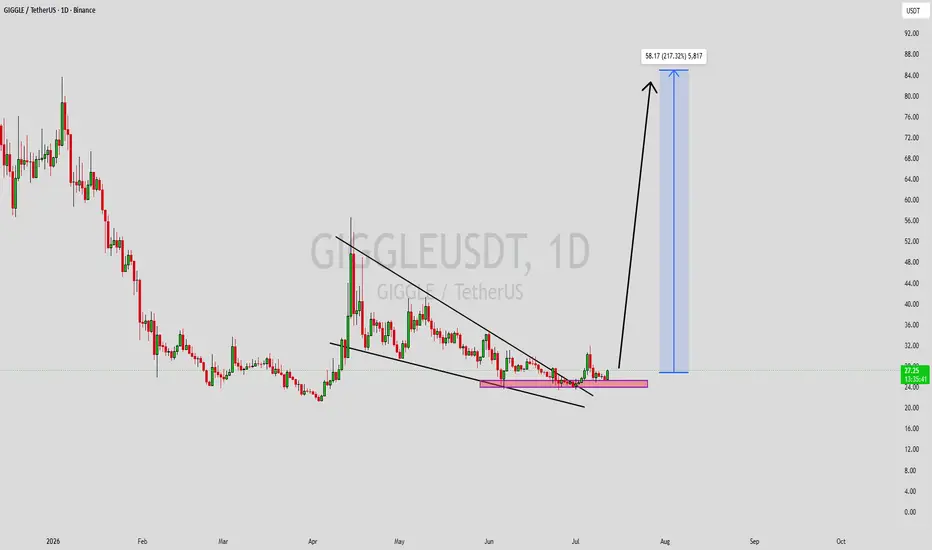
GIGGLEUSDT Forming Falling WedgeGIGGLEUSDT is forming a clear falling wedge pattern, a classic bullish wave signal that often indicates an upcoming breakout. The price has been consolidating within a tightening range, suggesting that bearish pressure is gradually fading while buyers are beginning to regain strength. With steady volume supporting accumulation at lower levels, the setup points toward a potential bullish breakout in the near term. The projected move could lead to an impressive gain of around 190% to 200% once the price breaks above the wedge resistance.
This falling wedge pattern is commonly observed near the end of extended downtrends or corrective phases, signaling a possible shift in market sentiment from bearish to bullish. Traders closely watching GIGGLEUSDT are noticing strengthening momentum as the price approaches a critical breakout zone. Healthy trading volume adds further confidence to this setup, indicating that market participants may be positioning themselves ahead of a potential trend reversal.
Investor interest in GIGGLEUSDT continues to grow as confidence builds around its technical structure and future potential. If the breakout is confirmed with sustained buying volume, it could trigger the beginning of a strong new bullish leg. For traders seeking medium-term opportunities, this setup may offer an attractive risk-to-reward profile as the falling wedge nears completion and bullish momentum starts to accelerate.
✅ Show your support by hitting the like button!
✅ Leave a comment below! (What is your opinion about this coin?)
Your feedback and engagement keep me inspired to share more insightful market analysis with you! 📈🚀
GIGGLE/USDT – Descending Trendline, Major Breakout?GIGGLE is currently at a very interesting stage after experiencing a prolonged downtrend from its peak around 260–280 USDT. It is clearly visible that the price has been trading below a Descending Trendline, which has acted as the primary dynamic resistance for several months.
📍 At the moment, the price is sitting right at the intersection of the descending trendline and a horizontal support area, making this a potential decision point for the next major move.
💡 This structure suggests that selling pressure is gradually weakening, while buyers are beginning to regain momentum.
---
🔍 Pattern Formation
📉 Descending Trendline Breakout Setup
The primary pattern on this chart is a Descending Trendline connecting a series of Lower Highs since November 2025.
Pattern Characteristics:
✅ The medium-term downtrend remains valid.
✅ The more times the trendline is tested, the more significant the breakout level becomes.
✅ Price is consolidating directly beneath the trendline resistance.
✅ Volatility is decreasing, which often precedes a major directional move.
🔥 If this trendline is successfully broken, the bearish structure that has dominated for months could come to an end.
---
🟢 Bullish Scenario
A bullish confirmation would occur if the price can:
✔️ Break out and achieve a daily close above the Descending Trendline.
✔️ Turn the trendline into new support through a successful retest.
✔️ Show increasing trading volume during the breakout.
🎯 Bullish Targets:
🎯 Target 1: 40.60 USDT
🎯 Target 2: 49.60 USDT
🎯 Target 3: 58.50 USDT
🎯 Target 4: 78.70 USDT
🚀 If market momentum remains strong, the 78.70 USDT area could become the next major price magnet, as it represents a strong horizontal resistance zone and a previous distribution area.
---
🔴 Bearish Scenario
The bearish trend will remain dominant if:
❌ Price fails to break above the trendline.
❌ Strong rejection occurs at the current resistance zone.
❌ Buying volume is insufficient to support a breakout.
⚠️ Key Support Levels:
🛡️ First Support: 28.00 – 30.00 USDT
🛡️ Major Support: 23.00 USDT
🛡️ Previous Low: 21.18 USDT
📉 If the 21.18 USDT support level breaks, the downtrend could continue and create a new Lower Low.
---
📈 Conclusion
GIGGLE is currently at a critical point after spending months trading beneath its long-term Descending Trendline.
📊 The current structure suggests a possible accumulation phase, while selling pressure appears to be weakening.
🚀 A confirmed breakout above the trendline could trigger a market structure shift from Bearish ➜ Bullish, with potential upside targets at:
🎯 40.60 USDT
🎯 49.60 USDT
🎯 58.50 USDT
🎯 78.70 USDT
⚠️ However, as long as the price remains below the trendline, traders should remain cautious of possible rejection and a continuation of the downtrend.
---
⚠️ Disclaimer
📚 This analysis is for educational purposes only and should not be considered financial advice.
💰 Always conduct your own research, apply proper risk management, and size your positions according to your personal risk tolerance.
#GIGGLE #GIGGLEUSDT #Crypto 🚀 #Cryptocurrency 💎 #Altcoin #TechnicalAnalysis #ChartAnalysis #PriceAction #Trendline #DescendingTrendline #Breakout #BullishSetup #BearishScenario #SupportAndResistance #CryptoTrading #Binance #Altseason #Trading #Investing 📈
Giggle Undergoes Higher Timeframe Correction (4H)Before anything else, you should know that this coin is a highly volatile and risky asset.
From the point where the red arrow was placed, the GIGGLE asset appears to have entered a complex and time consuming higher-degree corrective phase.
We are observing an expanding pattern, and price action currently seems to be in wave C of this structure. Wave C itself appears to be forming a diametric pattern, and at this stage we are likely in wave E of this formation.
We are looking for supply zones to enter and to participate in the final wave E of C.
Targets are marked on the chart; once TP1 is reached, move the position to breakeven.
A daily candle closing above the invalidation level would invalidate this analysis.
If you have a symbole or altcoin you want analyzed, first hit the like button and then comment its name so I can review it for you.
What do you think? Is GIGGLE bullish?
GIGGLEUSDT Forming Bullish MomentumGIGGLEUSDT is forming a clear bullish momentum pattern, a classic bullish wave signal that often indicates an upcoming breakout. The price has been consolidating within a narrowing range, suggesting that selling pressure is weakening while buyers are beginning to regain control. With consistent volume confirming accumulation at lower levels, the setup hints at a potential bullish breakout soon. The projected move could lead to an impressive gain of around 90% to 100% once the price breaks above the wedge resistance.
This bullish momentum pattern is typically seen at the end of downtrends or corrective phases, and it represents a potential shift in market sentiment from bearish to bullish. Traders closely watching GIGGLEUSDT are noting the strengthening momentum as it nears a breakout zone. The strong trading volume adds confidence to this pattern, showing that market participants may already be positioning early in anticipation of a reversal.
Investors’ growing interest in GIGGLEUSDT reflects rising confidence in the project’s long-term fundamentals and current technical strength. If the breakout confirms with sustained volume, this could mark the start of a fresh bullish leg. Traders might find this a valuable setup for medium-term gains, especially as the momentum pattern completes and buying pressure accelerates.
✅ Show your support by hitting the like button and
✅ Leaving a comment below! (What is your opinion about this coin?)
Your feedback and engagement keep me inspired to share more insightful market analysis with you!
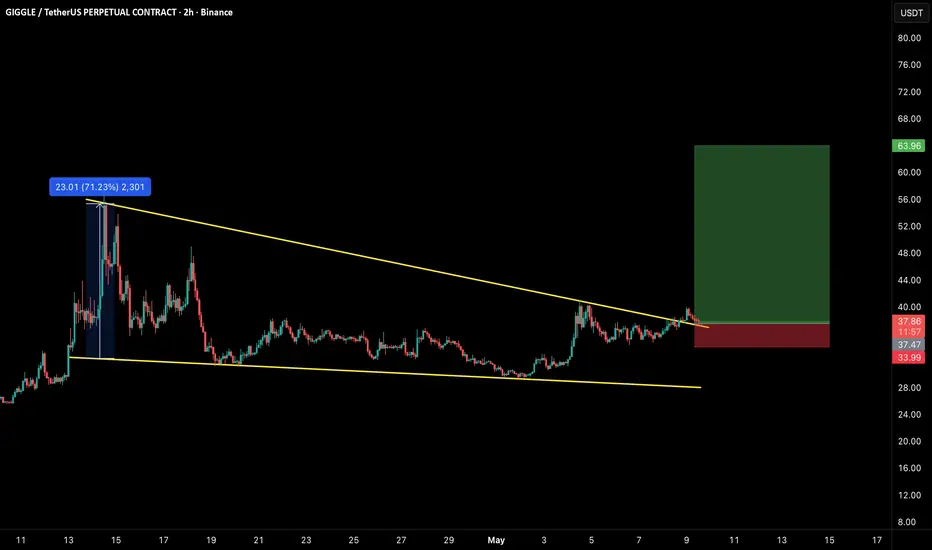
GIGGLE/USDT Long Setup!Hey Traders! 👋
If you’re enjoying this analysis, smash that 👍 and hit Follow for high-accuracy trade setups that actually deliver! 💹🔥
lean falling wedge breakout with momentum building 📈
📊 Setup:
• Bullish structure after consolidation
• Breakout above resistance trendline
• Buyers stepping in
🎯 Targets:
→ $45
→ $60+
🛑 Invalidation:
Break below $34 support
⚠️ Looks strong — keep this on watch
💬 What’s Your Take?
Drop your analysis and predictions below—let’s navigate this together and secure those gains! 💰
GIGGLEUSDT Forming Falling WedgeGIGGLEUSDT is forming a clear falling wedge pattern, a classic bullish reversal signal that often indicates an upcoming breakout. The price has been consolidating within a narrowing range, suggesting that selling pressure is weakening while buyers are beginning to regain control. With consistent volume confirming accumulation at lower levels, the setup hints at a potential bullish breakout soon. The projected move could lead to an impressive gain of around 190% to 200% once the price breaks above the wedge resistance.
This falling wedge pattern is typically seen at the end of downtrends or corrective phases, and it represents a potential shift in market sentiment from bearish to bullish. Traders closely watching GIGGLEUSDT are noting the strengthening momentum as it nears a breakout zone. The good trading volume adds confidence to this pattern, showing that market participants are positioning early in anticipation of a reversal.
Investors’ growing interest in GIGGLEUSDT reflects rising confidence in the project’s long-term fundamentals and current technical strength. If the breakout confirms with sustained volume, this could mark the start of a fresh bullish leg. Traders might find this a valuable setup for medium-term gains, especially as the wedge pattern completes and buying momentum accelerates.
✅ Show your support by hitting the like button and
✅ Leaving a comment below! (What is your opinion about this Coin?)
Your feedback and engagement keep me inspired to share more insightful market analysis with you!
GIGGLEUSDT Forming Falling WedgeGIGGLEUSDT is forming a clear falling wedge pattern, a classic bullish reversal signal that often indicates an upcoming breakout. The price has been consolidating within a narrowing range, suggesting that selling pressure is weakening while buyers are beginning to regain control. With consistent volume confirming accumulation at lower levels, the setup hints at a potential bullish breakout soon. The projected move could lead to an impressive gain of around 190% to 200% once the price breaks above the wedge resistance.
This falling wedge pattern is typically seen at the end of downtrends or corrective phases, and it represents a potential shift in market sentiment from bearish to bullish. Traders closely watching GIGGLEUSDT are noting the strengthening momentum as it nears a breakout zone. The good trading volume adds confidence to this pattern, showing that market participants are positioning early in anticipation of a reversal.
Investors’ growing interest in GIGGLEUSDT reflects rising confidence in the project’s long-term fundamentals and current technical strength. If the breakout confirms with sustained volume, this could mark the start of a fresh bullish leg. Traders might find this a valuable setup for medium-term gains, especially as the wedge pattern completes and buying momentum accelerates.
✅ Show your support by hitting the like button and
✅ Leaving a comment below! (What is your opinion about this Coin?)
Your feedback and engagement keep me inspired to share more insightful market analysis with you!
GIGGLEUSDT 1D#GIGGLE has broken above the falling wedge resistance on the daily chart and is now approaching the daily SMA50. The MACD and RSI indicators suggest a potential bullish continuation. Consider accumulating a small position at current levels and near support zones. The potential upside targets are:
🎯 $31.64
🎯 $38.09
🎯 $43.31
🎯 $48.52
🎯 $55.94
🎯 $65.39
⚠️ Always remember to use a tight stop-loss and maintain proper risk management.
GIGGLEUSDT Forming Falling WedgeGIGGLEUSDT is forming a clear falling wedge pattern, a classic bullish reversal signal that often indicates an upcoming breakout. The price has been consolidating within a narrowing range, suggesting that selling pressure is weakening while buyers are beginning to regain control. With consistent volume confirming accumulation at lower levels, the setup hints at a potential bullish breakout soon. The projected move could lead to an impressive gain of around 90% to 100% once the price breaks above the wedge resistance.
This falling wedge pattern is typically seen at the end of downtrends or corrective phases, and it represents a potential shift in market sentiment from bearish to bullish. Traders closely watching GIGGLEUSDT are noting the strengthening momentum as it nears a breakout zone. The good trading volume adds confidence to this pattern, showing that market participants are positioning early in anticipation of a reversal.
Investors’ growing interest in GIGGLEUSDT reflects rising confidence in the project’s long-term fundamentals and current technical strength. If the breakout confirms with sustained volume, this could mark the start of a fresh bullish leg. Traders might find this a valuable setup for medium-term gains, especially as the wedge pattern completes and buying momentum accelerates.
✅ Show your support by hitting the like button and
✅ Leaving a comment below! (What is your opinion about this Coin?)
Your feedback and engagement keep me inspired to share more insightful market analysis with you!
GIGGLEUSDT Forming Bullish MomentumGIGGLEUSDT is forming a clear bullish momentum pattern, a classic bullish reversal signal that often indicates an upcoming breakout. The price has been consolidating within a narrowing range, suggesting that selling pressure is weakening while buyers are beginning to regain control. With consistent volume confirming accumulation at lower levels, the setup hints at a potential bullish breakout soon. The projected move could lead to an impressive gain of around 290% to 300% once the price breaks above the wedge resistance.
This bullish momentum pattern is typically seen at the end of downtrends or corrective phases, and it represents a potential shift in market sentiment from bearish to bullish. Traders closely watching GIGGLEUSDT are noting the strengthening momentum as it nears a breakout zone. The good trading volume adds confidence to this pattern, showing that market participants are positioning early in anticipation of a reversal.
Investors’ growing interest in GIGGLEUSDT reflects rising confidence in the project’s long-term fundamentals and current technical strength. If the breakout confirms with sustained volume, this could mark the start of a fresh bullish leg. Traders might find this a valuable setup for medium-term gains, especially as the pattern completes and buying momentum accelerates.
✅ Show your support by hitting the like button and
✅ Leaving a comment below! (What is your opinion about this Coin?)
Your feedback and engagement keep me inspired to share more insightful market analysis with you!