GLMRUSDT Forming Bullish ContinuationGLMRUSDT has bounced cleanly off its key demand zone on the daily chart. After sliding lower over the past few weeks, buyers stepped back in to defend the floor, sparking a strong recovery move of over 9% and putting momentum back in favor of the bulls.
With this support base holding firm once again, the chart sets up a solid continuation run. The current setup points toward a potential upside expansion of roughly 104%, leaving plenty of room for the rally to run as long as the floor stays inta
GLMR / TetherUS
No trades
No trades
In-depth trading ideas
#GLMRUSDT A Potential Bullish Reversal – Is a New Rally Ahead ?#GLMR
On the 12-hour timeframe, GLMR looks technically interesting, particularly after the price successfully rebounded from the support zone at $0.005370. This is the same level from which the price previously staged a rebound, reinforcing its importance as a key support area.
Looking at previous price action, we can see that GLMR was trading within a descending price channel. Previously, breaking above this channel triggered a strong bullish rally.
Currently, we are witnessing another attem
GLMR/USDT (1h) Testing a Falling Wedge BreakoutGLMR/USDT is trading inside a falling wedge on the 1H chart, with both trendlines sloping lower while gradually converging. The structure has developed after the sharp spike toward the $0.0140+ area, followed by a sustained sequence of lower highs and lower lows.
Price is now testing the upper wedge resistance around $0.0102–$0.0104. A confirmed 1H breakout and hold above this trendline could validate the bullish reversal setup and open the way toward the $0.0124–$0.0126 target area.
A rejection
GLMR Critical Descending Trendline — Breakout or Rejection?💵 Coin: CRYPTOCAP:GLMR / USDT
🏦 Exchange: Binance
⏳ Time Frame: 4D
📐 Pattern: Descending Trendline
📍 Current Price Area: Around $0.0089
🎯 Key Resistance Levels: $0.01033 → $0.01425 → $0.01777 → $0.02279 → $0.03116
---
📉 🔻 DESCENDING TRENDLINE
The chart shows GLMR continuing to trade below a long-term descending trendline that has been pressuring price for an extended period.
🔻 The yellow trendline connects a series of lower highs, indicating that previous recovery attempts have continued t
GLMRUSDT 1D#GLMR is trading within a falling wedge pattern on the daily timeframe. It has bounced from the wedge support and is now heading toward the wedge resistance. In case of a breakout above the wedge resistance and the daily SMA100, the potential upside targets are:
🎯 $0.009299
🎯 $0.011153
🎯 $0.012652
🎯 $0.014150
🎯 $0.016283
🎯 $0.019000
⚠️ Always use a tight stop-loss and maintain proper risk management.
Glimmer (GLMR): 2,600% in 2027, Up to 7,000% Long-TermApril 2026 saw the highest buy-volume ever after a long-term all-time low double-bottom. More recently, GLMRUSDT pierced support and is now looking to recover. This project is trading within the extreme opportunity buy-zone.
The bear market trend here lasted two years, March 2024 through March 2026. This same time window is also present on many projects.
After the confirmation of the October 2025 atl in March, the market produced one more flush and went below support, a stop-loss hunt event. T
GLMR ( SPOT - investment)GLMR/ USDT
The coin on the way to achieve big targets
Entry range (0.025- 0.030)
SL 1D close below 0.02 ( stop loss is very big so collect slowly or make stop loss smaller but with small time frames)
T1 0.050
T2 0.060
T3 0.080
T4 0.013
T5 0.016
3 optional extra targets on the chart
_______________________________________________________
Golden Advices.
********************
* collect the coin slowly in the entry range.
* Please calculate your losses before the entry.
* Do not enter any tra
GLMR: A Full-Cycle Capitulation Setup With Asymmetric 8,000% UpsGLMR: A Full-Cycle Capitulation Setup With Asymmetric 8,000% Upside
The long-term technical structure of GLMR (Moonbeam) presents a textbook example of a full market cycle: euphoric launch, prolonged distribution, multi-year capitulation, and the early signals of structural reversal. This type of structure is rare—and historically, it is where the largest percentage moves originate.
1. Macro Downtrend Completion and Capitulation
After its initial listing, GLMR experienced an aggressive markdo
Moonbeam , an update Now I admit Idk what the hell is wrong with some projects, one of them is moonbeam which is headed down without stop ( price wise, don’t know much about the actual work ) it reacts nicely to the pitch fork with some adjustments , I really hope it starts to bounce from this point ngl if it doesn’t it’ll be nasty and worse than what is it now , it has a small market while it’s a pioneer in Polkadot ecosystem which should be the reason for not being delisted yet , with all the background work from
GLMRUSDT Macro Downtrend Intact, Key Levels DefinedGLMRUSDT remains in a firm macro downtrend. The key Main Sell-off zone ($2-$2.61) is the primary resistance to watch for any short to mid-term rallies. Until that area is broken, the path of least resistance is down. The Area of Interest for a potential long-term bottom lies between $0.0.0219 to $0.039 watch for a confirmed bullish reversal there. A break below $0.0185 signals a continuation of the downtrend.
Moonbeam All-Time Low & Bullish Reversal—Trading 101 (PP: 1250%)GLMR (Moonbeam) has been trading at bottom prices and you know once we hit bottom, there is no other place left to go but up.
The all-time low happened in April 2025 and then we have a reversal pattern. The pattern is composed of lower highs and higher lows, the action converging and becoming compressed until finally a strong breakout happens.
We know the breakout will be bullish because of marketwide action. Ethereum (Ether) is trading at its highest price since December 2021. Bitcoin and XRP
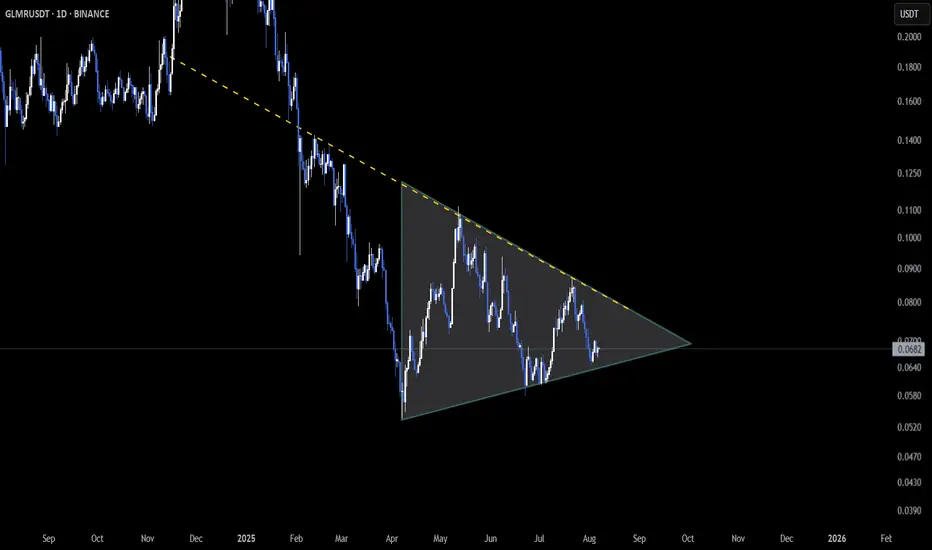
GLMR – Coiling Up for a Move!
📆 On the Daily timeframe, SEED_DONKEYDAN_MARKET_CAP:GLMR is trading inside a symmetrical triangle, with price compressing toward the apex 🔺
This kind of structure often leads to strong breakouts once momentum builds.
👀 Breakout or breakdown ahead? Stay sharp — big move incoming!
Not financial advice.
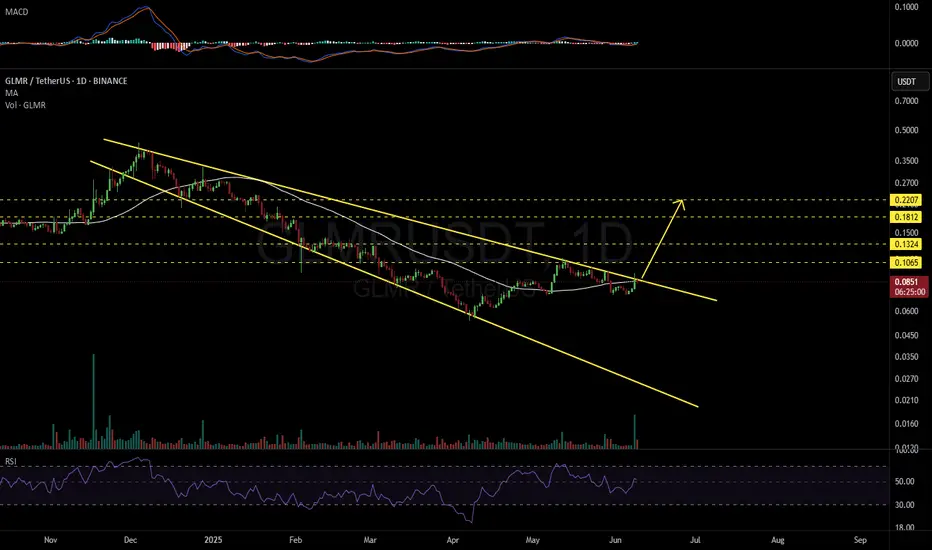
GLMRUSDT 1D#GLMR — Breakout Loading? 🚀
#GLMR is moving inside a Descending Broadening Wedge on the daily chart and is now on the verge of breaking above the wedge resistance and the daily MA50.
If a breakout confirms, watch for these bullish targets:
🎯 $0.1065
🎯 $0.1324
🎯 $0.1812
🎯 $0.2207
⚠️ Always use a tight stop-loss to manage risk and protect your capital.
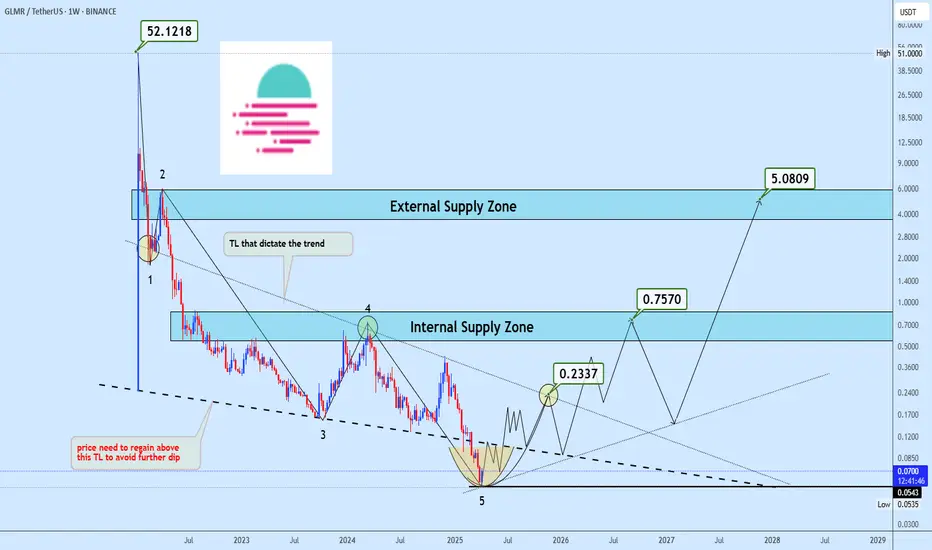
GLMR Bottomed? Watch This Key Trendline ReclaimGLMR has likely completed a full 5-wave impulsive decline, with the final leg extending after a clean deviation below the key trendline, printing a low at 0.0543. This marks a potential medium-term bottom. A corrective upside move is expected from this zone, though the broken trendline remains unreclaimed and now acts as resistance. The internal supply trendline around 0.2337 is critical — price may face strong rejection here. However, a confirmed breakout above it could open the door toward 0.7
GLMRUSDT - Buyers Are Here!Observing GLMRUSDT, one identifies a notable blue box on the chart. This area, in the estimation of a discerning investor, appears to function as a significant support level.
The principle here is straightforward: when an asset's price descends to a particular zone and consistently finds buying interest, preventing further decline, that zone establishes itself as a support. This blue box suggests a concentration of demand, where those who value the asset are prepared to acquire it.
While techn
GLMR Short wait for good entryLike & Follow me for more details
GLMR Short,
BTC will break upward trend soon.
Will reach 103k
G
GLMR/USDT: Riding the Bull, Waiting for the Dip!🐂📉 I'm analyzing GLMR paired with USDT. 📈 While it's been in a strong bullish trend 💪, it's currently trading at a premium and looks overextended. 😬 Looking at the recent price swing, it's clear we haven't seen a significant pullback. I'm seeking a buy opportunity 💰, but not at these current levels.. I'm waiting for a retracement down to the Fibonacci 61.8% level (equilibrium) 🧘, and then looking for a bullish break in structure (BoS) after the pullback to signal a good entry point. 🎯 Everything
GLMR Explosion or Final Trap? Yello Paradisers — are you truly ready for one of the cleanest, most deceptive setups we’ve seen on GLMR in weeks? If you’ve been following our latest insights, you already know — this is not the moment to get distracted. A decisive move is on the horizon… but the trap is also well set. The only question is: will you be the one who catches it or gets caught?
💎#GLMRUSDT has just completed a clear 5 wave rising wedge, a classic structure that often signals the end of a move and it has now pushed
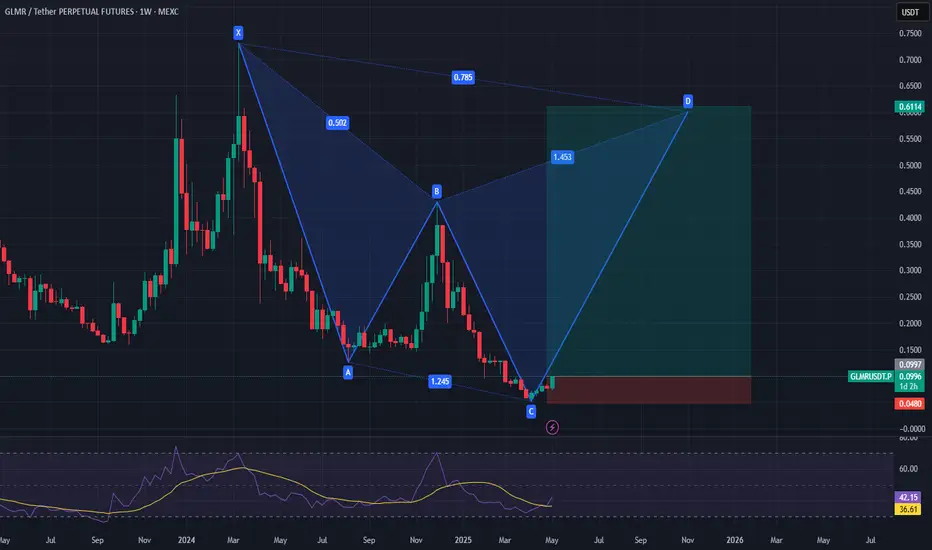
GLMRUSDT BullishGLMRUSDT – Bullish Cypher Pattern Forming | Reversal Setup 🔄🚀
Hey pattern traders 👋
GLMR (Moonbeam) is forming what looks like a textbook bullish Cypher pattern — and if this completes properly, we could be looking at a solid reversal play off key Fibonacci levels. This is the kind of setup where precision and patience pay off.
🔺 Cypher Pattern Breakdown
Let’s decode it real quick:
XA: The initial impulse leg
AB: Retraces 38.2–61.8% of XA
BC: Extends to 113–141.4% of AB
CD: Completes near 7
GLong