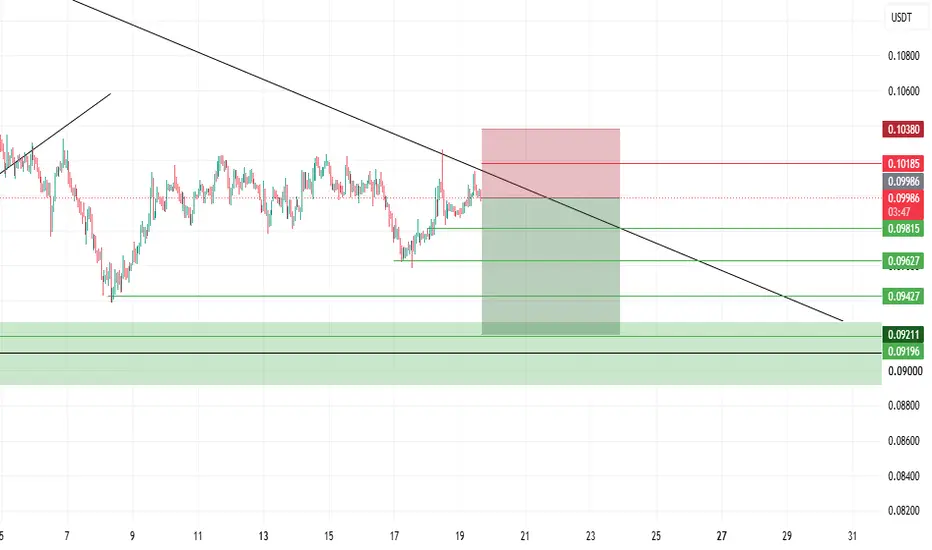
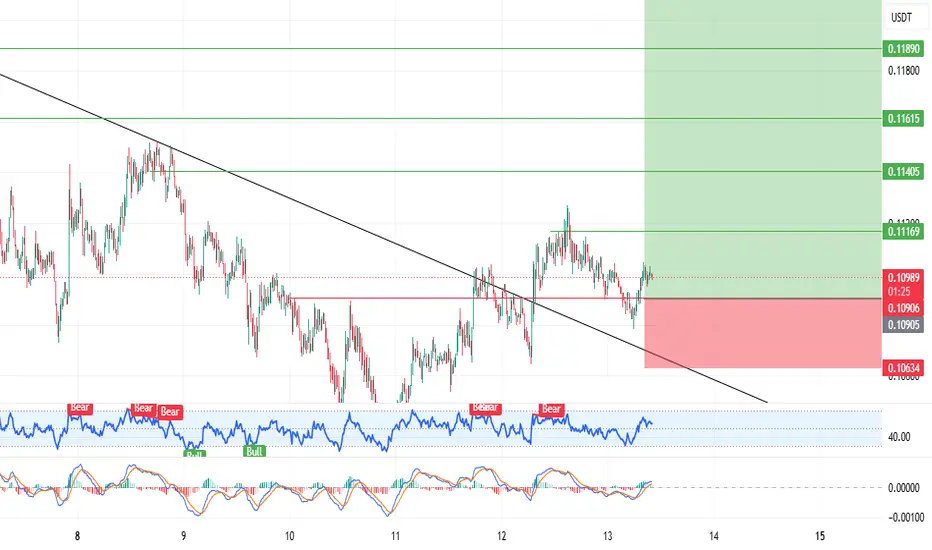
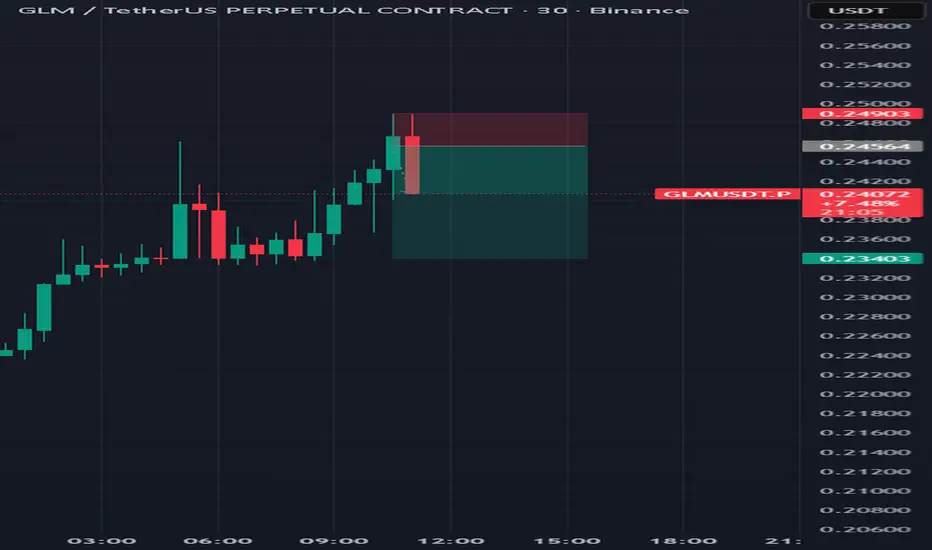
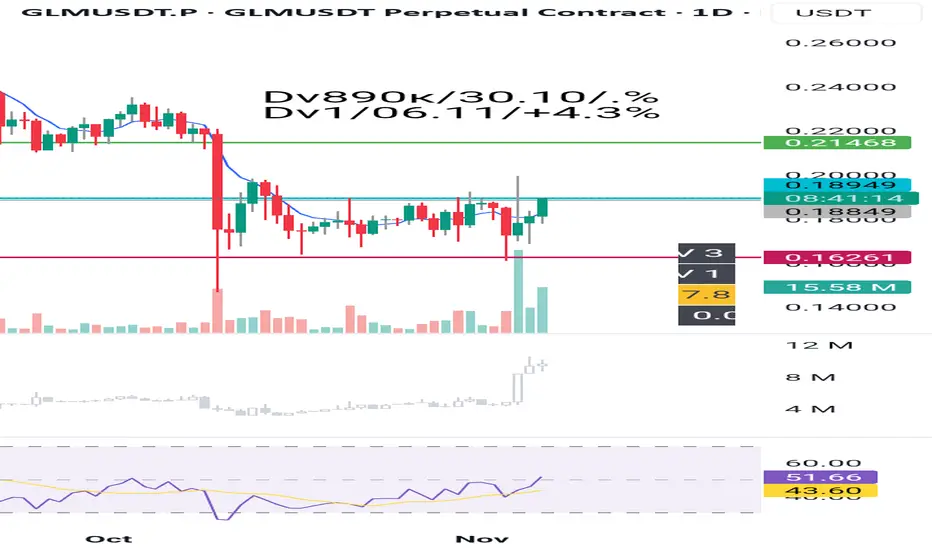
GLM USDT SHORT SIGNAL#92 GLM /USDT – Trade Setup (SHORT)
📈 Position Type: SHORT
🕒 Timeframe: 1H
📊 Market: Futures
💰 Entry Zone:
0.09985
0.10185
🛑 Stop-Loss:
0.10370
🎯 Take-Profit Targets:
• TP1: 0.09815
• TP2: 0.09627
• TP3: 0.09427
• TP4: 0.09197
⚙️ Leverage:
5 *10
▫️ After TP1, move SL to Entry + 0.2%.
▪️ Exit Plan:
• 40% at TP1
• 20% at TP2
• 20% at TP3
20% at. TP4
📌 Risk Management:
Risk only 1–2% of your capital per trade.
⚠️ Always check and confirm the setup on your chart before entering the trade.
In-depth trading ideas
May 6, 2026 GLM. The time to go long has come.- Exchange: Bitget
- Instrument: BITGET:GLMUSDT
- Timeframe: Weekly
- Trade type: Buy stop order
- Price: 0.1432
- Take Profit: Open
- Stop Loss: 0.1321 (-7.70 %)
Idea: Long on a breakout above last week's high — bullish momentum continuation.
Entry: Buy stop above last week’s high.
Stop-loss: Below the low of the same candle. A pullback below this level invalidates the trade.
Take Profit: Trailing stop following the lows of new weekly candles.
This is not an individual investment recommendation.
GLMUSDT Forming Bullish MomentumGLMUSDT is forming a clear bullish momentum pattern, a classic bullish continuation signal that often suggests a strong breakout may be approaching soon. The price has been consolidating within a tightening range, indicating that selling pressure is gradually weakening while buyers continue to regain control around important support levels. This type of setup is commonly seen before major bullish expansions as momentum slowly shifts back in favor of the bulls.
The projected breakout from this bullish momentum structure could lead to an impressive gain of around 90% to 100% if the price confirms above the resistance zone with strong volume support. This pattern is frequently observed after corrective phases and may signal the beginning of a fresh bullish trend.
Traders closely watching GLMUSDT are noticing strengthening momentum as the price approaches a key breakout area. The stable trading volume adds confidence to the setup, showing that buyers may already be positioning early in anticipation of a bullish continuation move.
Growing investor interest in GLMUSDT reflects increasing confidence in both its technical outlook and long-term upside potential. If the breakout confirms with sustained buying pressure and strong follow-through momentum, this could mark the beginning of a powerful bullish wave.
✅ Show your support by hitting the like button and
✅ Leaving a comment below! (What is your opinion about this coin?)
Your feedback and engagement keep me inspired to share more insightful market analysis with you!
GLM/USDT: Liquidity Sweep Long (SL Below Invalidation)On the OKX:GLMUSDT.P 15-minute chart, price has been trending down and then printed a clear liquidity sweep at the marked $$ level. That sweep took out the prior swing low and immediately reclaimed, which often signals trapped sellers and a potential short-term reversal.
My plan is to enter long at the $$ level (liquidity level) once price shows it can hold above that reclaimed level. The trade is invalid if price breaks the lower low — my stop is placed below the marked Invalidation line (below the lowest swing / lower low). Upside target is the next liquidity pool / mean reversion toward the larger grey target zone.
Trade Plan (as shown):
Entry: At $$ (liquidity sweep level) after reclaim / hold
Stop-loss: Below the lower low (the Invalidation line)
Target: Reversion upward toward the grey objective zone (first resistance area, then extension)
What I Expect Next:
Ideally, GLM holds above $$, forms a higher low, and pushes into the upper range. If we lose $$ and break below the invalidation low, the setup is invalid and I’m out.
GLMUSDT UPDATE#GLM
UPDATE
GLM Technical Setup
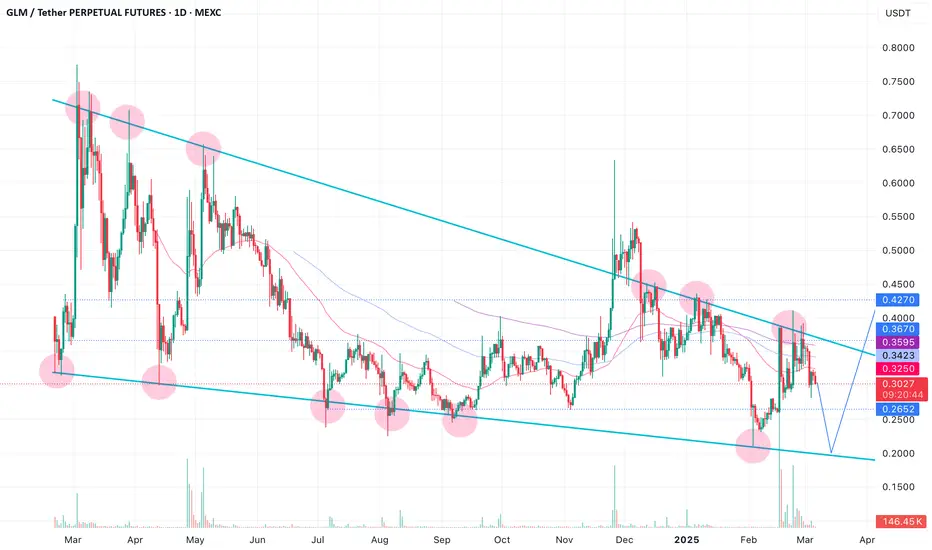
Pattern: Falling Wedge Pattern
Current Price: 0.2652$
Target Price: 0.4340$
Target % Gain: 71.16%
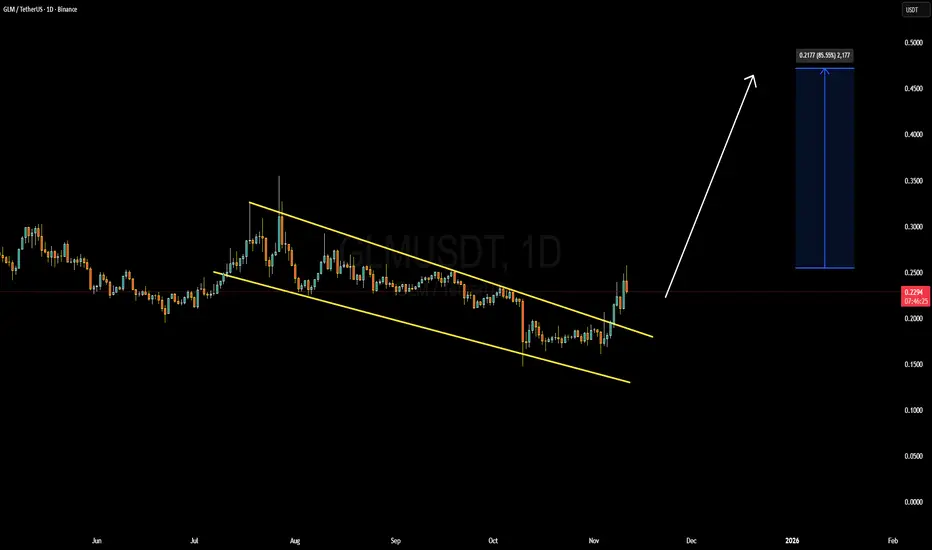
Technical Analysis: GLM is breaking out of a falling wedge pattern on the 1D chart, signaling bullish continuation. Price has reclaimed the descending resistance trendline with improving momentum, confirming the breakout structure. The measured move from the wedge projects a upside target near the 0.43–0.44$ zone, which also aligns with previous resistance levels. Holding above the breakout area keeps the bullish setup intact.
Time Frame: 1D
Risk Management Tip: Always use proper risk management.
GLMUSDT UPDATE#GLM
UPDATE
GLM Technical Setup
Pattern: Falling Wedge Pattern
Current Price: 0.2652$
Target Price: 0.4340$
Target % Gain: 71.16%
Technical Analysis: GLM is breaking out of a falling wedge pattern on the 1D chart, signaling bullish continuation. Price has reclaimed the descending resistance trendline with improving momentum, confirming the breakout structure. The measured move from the wedge projects a upside target near the 0.43–0.44$ zone, which also aligns with previous resistance levels. Holding above the breakout area keeps the bullish setup intact.
Time Frame: 1D
Risk Management Tip: Always use proper risk management.
GLM USDT SHORT SIGNAL---
📢 Official Trade Signal – GLM/USDT
📉 Position Type: SHORT
💰 Entry Price: 0.26146
---
🎯 Take-Profit Targets (Partial Exits):
• TP1: 0.25573
• TP2: 0.24441
• TP3: 0.22835
• TP4: 0.21220
• TP5: —
• TP6: —
---
🛑 Stop-Loss: 0.26870
📊 Timeframe: 15m
⚖️ Risk/Reward Ratio: 7.15
💥 Suggested Leverage: 3× – 5×
---
🧠 Technical Analysis Summary
GLM is showing clear rejection from the 0.2650–0.2700 supply zone, aligning with strong bearish momentum.
Price structure on the 15m chart is forming lower-highs and lower-lows, confirming a downward trend.
Key liquidity zones match our TP levels:
0.25573 → 0.24441 → 0.22835 → 0.21220
A breakdown below TP1 increases momentum toward deeper volatility pockets.
---
⚙️ Trade Management Rules
✔ Secure partial profit at TP1
✔ Move SL to Break-Even after TP1 hits
✔ Trail SL toward lower targets
✔ Avoid re-entry if SL gets triggered
✔ Confirm bearish structure before entry
---
📌 TradingView Hashtags
#GLMUSDT #GLM #ShortSignal #CryptoSignal
#TradingView #FuturesTrading #TechnicalAnalysis
---
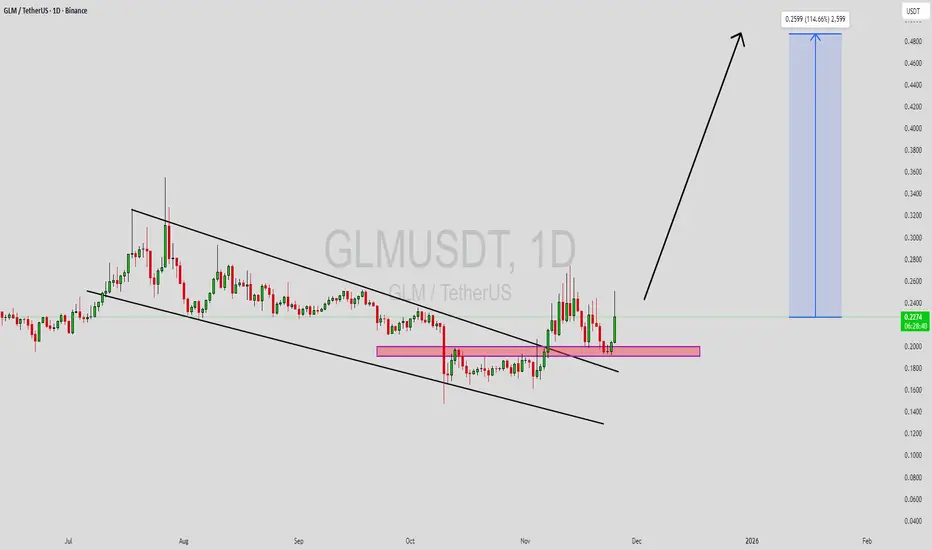
GLMUSDT Forming Falling WedgeGLMUSDT is forming a clear falling wedge pattern, a classic bullish reversal signal that often indicates an upcoming breakout. The price has been consolidating within a narrowing range, suggesting that selling pressure is weakening while buyers are beginning to regain control. With consistent volume confirming accumulation at lower levels, the setup hints at a potential bullish breakout soon. The projected move could lead to an impressive gain of around 90% to 100% once the price breaks above the wedge resistance.
This falling wedge pattern is typically seen at the end of downtrends or corrective phases, and it represents a potential shift in market sentiment from bearish to bullish. Traders closely watching GLMUSDT are noting the strengthening momentum as it nears a breakout zone. The good trading volume adds confidence to this pattern, showing that market participants are positioning early in anticipation of a reversal.
Investors’ growing interest in GLMUSDT reflects rising confidence in the project’s long-term fundamentals and current technical strength. If the breakout confirms with sustained volume, this could mark the start of a fresh bullish leg. Traders might find this a valuable setup for medium-term gains, especially as the wedge pattern completes and buying momentum accelerates.
✅ Show your support by hitting the like button and
✅ Leaving a comment below! (What is your opinion about this Coin?)
Your feedback and engagement keep me inspired to share more insightful market analysis with you!
GLMUSDT Forming Falling WedgeGLMUSDT is forming a clear falling wedge pattern, a classic bullish reversal signal that often indicates an upcoming breakout. The price has been consolidating within a narrowing range, suggesting that selling pressure is weakening while buyers are beginning to regain control. With consistent volume confirming accumulation at lower levels, the setup hints at a potential bullish breakout soon. The projected move could lead to an impressive gain of around 90% to 100% once the price breaks above the wedge resistance.
This falling wedge pattern is typically seen at the end of downtrends or corrective phases, and it represents a potential shift in market sentiment from bearish to bullish. Traders closely watching GLMUSDT are noting the strengthening momentum as it nears a breakout zone. The good trading volume adds confidence to this pattern, showing that market participants are positioning early in anticipation of a reversal.
Investors’ growing interest in GLMUSDT reflects rising confidence in the project’s long-term fundamentals and current technical strength. If the breakout confirms with sustained volume, this could mark the start of a fresh bullish leg. Traders might find this a valuable setup for medium-term gains, especially as the wedge pattern completes and buying momentum accelerates.
✅ Show your support by hitting the like button and
✅ Leaving a comment below! (What is your opinion about this Coin?)
Your feedback and engagement keep me inspired to share more insightful market analysis with you!
Golem goes lunaticThere is currently a sine formation visible on GOLEM. In today’s market conditions, only God knows what will happen in cryptocurrencies, but the chart seems to be signaling that it is heading toward a formation.
Additionally, I believe GOLEM has been heavily suppressed and is approaching the end of its accumulation zone. If we start seeing monthly closes above the neckline, the upside potential could be significant.
GLMUSDT 1D#GLM is moving inside a falling wedge pattern on the daily chart, with the price trading near the resistance. Consider buying a small bag here and near the support levels at:
$0.2166
$0.1968
If the price breaks out above the wedge resistance, the potential upside targets are:
🎯 $0.2790
🎯 $0.3117
🎯 $0.3444
🎯 $0.3910
🎯 $0.4504
⚠️ Always remember to use a tight stop-loss and maintain proper risk management.
GLMUSDT UPDAT#GLM
UPDATE
GLM Technical Setup
Pattern: Falling Wedge Pattern
Current Price: $0.235
Target Price: $0.400
Target % Gain: 100.02%
Technical Analysis: GLM has broken out of a falling wedge pattern on the 1D chart, signaling a potential bullish reversal. The breakout is confirmed by strong upward momentum and volume increase, indicating renewed buyer interest. If the momentum sustains, price could move toward the $0.400 level, which aligns with the projected target zone.
Time Frame: 1D
Risk Management Tip: Always use proper risk management.
GLMUSDT Forming Falling WedgeGLM/USDT is showing a compelling technical setup as it appears to be forming a clear falling wedge pattern, which historically signals a potential bullish reversal once breakout occurs. The constricting price action within the wedge, combined with increasing volume, suggests accumulation and a shift in sentiment might be underway. Given this structure, a breakout above the upper trendline could provide a launchpad for gains in the 70% to 80%+ range if momentum aligns.
From a fundamental perspective, the token behind this pair, GLM (Golem), offers a decentralized computing marketplace that enables users to rent out idle computing power and request it for complex tasks. With a circulating supply near 1 billion tokens and a market cap hovering around US$200-250 million, the project still carries significant upside potential if adoption picks up. Recent on-chain data suggest improving network activity, while trading volume has started to rise, indicating renewed investor interest.
Strategically, traders might consider waiting for a confirmed breakout above the wedge’s upper boundary with strong volume confirmation before entering. A pullback toward the breakout level could serve as a secondary entry opportunity for those looking to improve risk/reward. Placement of a stop-loss just below the recent swing low or lower trendline of the wedge would help contain risk. If the breakout holds, the target range mentioned aligns reasonably with the pattern’s measured move and fundamentals backing the asset.
In summary, GLM/USDT is offering a well-defined falling wedge pattern, strong underlying fundamentals via its decentralized compute use-case, and increased interest from the market—factors that together create a high-potential trade setup. Show your support by hitting the like button and
Leaving a comment below! (What is You opinion about this Coin)
Your feedback and engagement keep me inspired to share more insightful market analysis with you!
Golem (GLM): Possible Huge Pump Incoming!Golem coin has a similar pattern of touching the 200EMA mark before entering the weekend markets and then forming a huge CME gap; we might see just another one here.
Now if we see any confidence breakdowns lower than 200EMA, this idea will be invalid but the pattern seems to repeat itself so we might see yet another push and then a dump!
Swallow Team
GLM / USDT : Breaking out from Trendline resistance GLM/USDT: Breaking Out from Trendline Resistance – A Bullish Move Incoming?
GLM/USDT is making a strong move 📈 as it successfully breaks above a key trendline resistance zone 📊. After a period of tight consolidation, the breakout signals a potential bullish rally 💥. If the momentum sustains, we could see further upside in the coming days 🚀. Keep an eye on this pair and watch for confirmation signals before entering a trade.
Key Insights:
1️⃣ Trendline Breakout: GLM/USDT has finally broken above a long-standing trendline resistance, a key bullish signal. If this breakout holds, it could lead to a strong upward trend.
2️⃣ Volume Surge: A noticeable increase in trading volume is supporting this breakout, confirming strong buyer interest 🔥.
3️⃣ Bullish Indicators: RSI and MACD are showing strength ⚡, indicating bullish momentum could continue.
How to Confirm the Breakout:
✅ Look for a 4H or daily candle closing above the trendline for confirmation.
✅ A spike in volume during the breakout can signal strong buying pressure 📊.
✅ A successful retest of the broken resistance as new support adds further confidence.
⚠️ Be cautious of fake breakouts—watch for sharp reversals or wicks above the trendline.
Risk Management Strategies:
🔒 Use stop-loss orders to manage risk.
🎯 Ensure proper position sizing to align with your overall strategy.
This analysis is for educational purposes only and not financial advice. Always DYOR before making any trading decisions 🔍.
GLM/USDT THE BEST COIN FOR 270% POWER ATH INCREASEGLM/USDT IS THE BEST COIN FOR 270% POWER ATH INCREASE
There are more coins on the coinmarketcap, GLM l looks depending on our study the best coin for 270% BREAK And new ATH listing 2025
There is a high volume from KRW, and already 2 whales first entries made.
Let's see what the time can bring.