GMT at macro floor: base recovery toward $0.0091The Macro Picture 🗺️
GMT unwound from the $0.0135 May high down to the $0.00691 macro floor and has stopped falling right on it. The heavy selling has flattened into a base, with price holding just above support rather than continuing to break down.
The Setup ⚙️
The Accumulation Zone 🟢
$0.00691–0.00741 is where the selling has dried up. The macro floor has held on every retest, and this is the demand shelf a recovery would build from.
The Decision Point 🔴
$0.01288 (Local High) is the bigger structural gate. Before that, the first objective is the $0.00911 measured-move target — reclaiming it proves buyers are back in control.
The Roadmap 🛣️
Hold the $0.00691 floor → recover toward $0.00911 → then challenge the $0.01288 decision level. Invalidation is a clean daily close below $0.00691 — that voids the accumulation thesis.
This is a textbook DCA Accumulation Zone setup: scale in across the $0.00691–0.00741 band and let the base do the work.
More setups in profile.
#GMT #STEPN #crypto #trading #TA #3Commas #DCA
In-depth trading ideas
GMT/USDT [SPOT]: Accumulation at Range Low & 4H Magnet ImbalanceToday, I am sharing a high-probability, mid-term setup for GMT on the spot market. On the 4-hour (4H) timeframe, we have a textbook market maker price delivery model unfolding.
Here is the complete breakdown of the logic behind this move.
1. Key Imbalance (4H FVG) — The Ultimate Magnet
During the sharp impulse downward, the asset left a massive area of inefficient pricing (marked by the pink block in the 0.01000 – 0.01030 region).
The Logic: Institutional price delivery algorithms naturally seek to mitigate these "voids" (Imbalances / Fair Value Gaps) to restore balance between buy and sell liquidity. This block acts as a massive magnet for the price over the medium term.
2. Tedious Accumulation Range (The Launchpad)
Following the sell-off, GMT compressed into a prolonged, choppy accumulation range (highlighted in beige).
What's Happening Inside: The smart money is systematically building a long position here, shaking out impatient retail traders.
Current State: Notice that we are currently trading right at the very bottom boundary of this accumulation. The local sell-side liquidity has already been cleanly swept (with clear deviations/sweeps below the lows). Buying at these levels offers an exceptionally safe entry with an asymmetrical risk-to-reward ratio.
3. Why SPOT is King Here
Under current market conditions, trading with high leverage on futures carries elevated risks due to sudden whipsaws and stop-hunts within the accumulation range. Trading on SPOT allows us to completely ignore short-term market maker manipulations and patiently wait for the true bullish expansion.
🎯 The Trade Plan:
Buy Zone: Current market price (~0.00736) — Range Low / Accumulation Bottom.
Take Profit: A test of the lower boundary of the Key Imbalance (~0.01019).
Potential: A clean +38.47% move in spot price with zero leverage.
Summary: Accumulating GMT at these current levels is highly mathematically sound. Patience on the spot market in setups like this is almost always rewarded with solid, stress-free profits.
Disclaimer: Not financial advice. Always perform your own analysis before entering any trade.
Do you agree with this bias? Support this idea with a boost 🚀 and let me know your thoughts on GMT in the comments below!
GMT Ready to Explode? Breakout Setup Forming (12H)A key trendline has been decisively broken, signaling a potential shift in market structure. In addition to that, we are now seeing a bullish Change of Character (CH) on the chart, which further supports the idea that momentum is starting to favor the buyers.
At the moment, GMT is trading around an important flip zone a level that previously acted as resistance and is now attempting to act as support. If price manages to hold above this area, it increases the probability of continuation to the upside, as larger participants may begin to step in and build positions.
The targets are clearly marked on the chart based on the current structure. As price approaches the first target, it is recommended to manage risk by moving your position to breakeven. This helps protect capital while allowing the trade to continue if momentum persists.
However, it is important to remain disciplined. A daily candle close below the defined invalidation level would signal that this setup is no longer valid and the bullish scenario has failed. In that case, the analysis should be reconsidered based on the new structure.
As always, wait for confirmation, manage your risk properly, and trade according to your plan.
If you have a symbole or altcoin you want analyzed, first hit the like button and then comment its name so I can review it for you.
What do you think? Is GMT bullish?
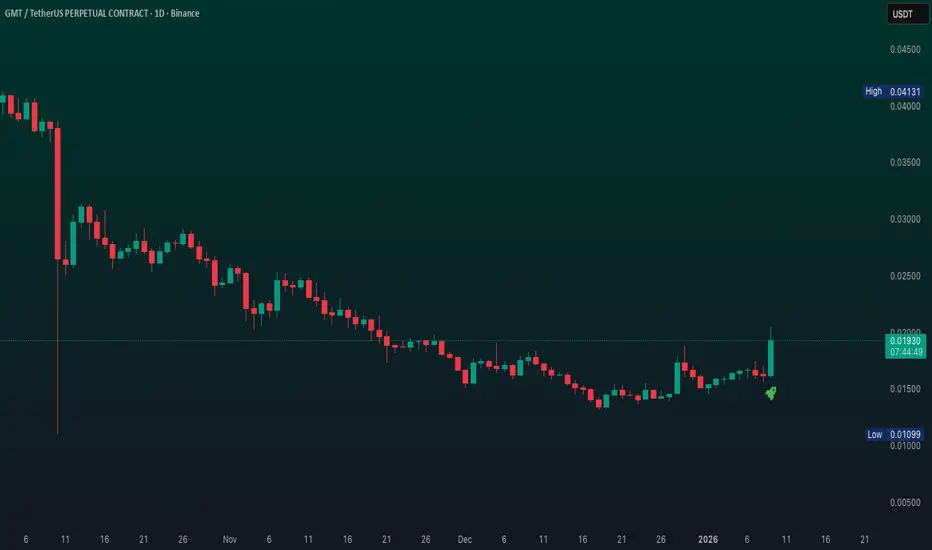
GMTUSDT.P GMTUSDT | REVERSAL SETUP 📉 GMTUSDT.P — 1Y Downtrend Exhaustion | High R:R Reversal Setup
GMT has been in a **persistent downtrend for nearly a year**, respecting a clean descending structure (trendline shown). Price is now compressing at **historical lows**, indicating potential **seller exhaustion** and a possible **base formation phase**.
This type of structure often precedes a **relief rally or trend reversal**, especially when volatility contracts after a prolonged decline.
🔍 **Key Observations:**
* Strong macro downtrend → lower highs & lower lows
* Price stabilizing near demand zone
* Momentum slowing → potential accumulation
* Break of descending trendline could trigger upside expansion
🎯 **Trade Plan (Spot / Perp Long Idea):**
* **Entry:** Current range / accumulation zone
* **TP1:** 0.023
* **TP2:** 0.040
* **TP3:** 0.058
* **TP4:** 0.070
🛑 **Invalidation:**
* Sustained breakdown below current base → continuation of downtrend
⚠️ This is a **high risk / high reward setup**, relying on reversal from extreme downside. Position sizing and patience are critical.
—
💡 If price reclaims structure + volume increases, this could turn into a **multi-leg recovery move** rather than just a bounce.
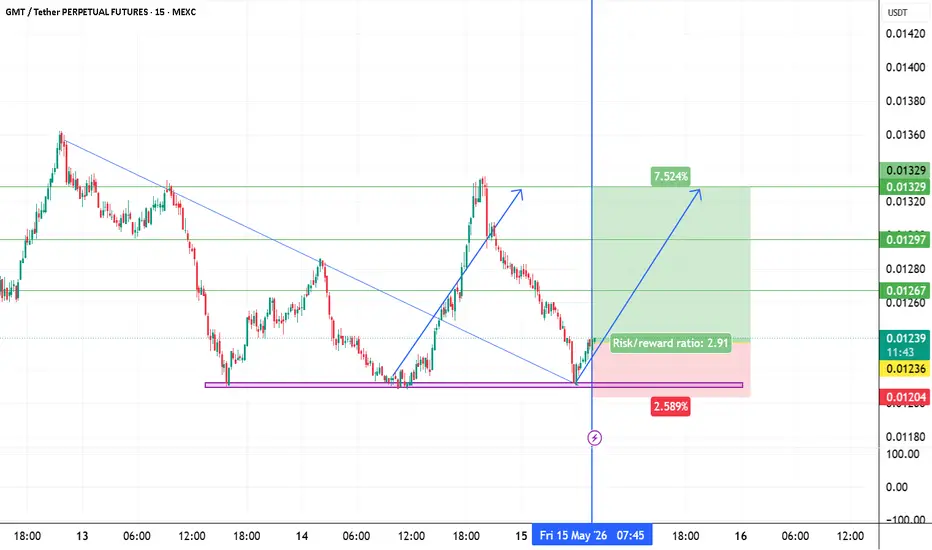
gmtusdt longInstructions:
Entry point: yellow
Stop loss: red
Take profit: green
👉Leverage x 5-10-20 for crypto
👉Leverage x 20-50-100 for commodities, stocks, indices, and forex
👉Margin 1-5% max.
Always practice risk and money management.
Invest a maximum of 5% on any trade or across all your trades.
Invest only what you can afford to lose, as no one is in control of the market.
👉Our analyses are primarily based on:
breakouts: two trend lines (ascending and descending) and a line indicating a horizontal breakout.
chart patterns: shoulders and head, triangle parttern, elliott impulse, etc etc.
We don't always have the time to track them at all times or to represent them visibly, given the numerous signals, the number of channels to manage, and especially because of the often rapid pace of market movements.
indicators: We associate at least two indicators with this technique.
👉Depending on the circumstances, we use specific indicators, often setting 3 or more take profit levels.
👉Indeed, there are good days in trading and also bad days. No one can promise to win every trade, and like all traders worldwide, we also experience stop-loss orders. However, we win more than we lose and remain positive.
👉You can close the position before or after the take profit orders indicated by the green lines if you are personally satisfied; the same applies to stop loss orders.
👉We must stay positive, clear-headed, and humble.
we cannot provide all instructions or all trades here on this channel.
Good luck to us all, and may God guide us. Amen.
GMTUSDT Forming Bullish MomentumGMTUSDT is forming a clear bullish momentum pattern, a classic bullish wave signal that often indicates an upcoming breakout. The price has been consolidating within a narrowing range, suggesting that selling pressure is weakening while buyers are beginning to regain control. With consistent volume confirming accumulation at lower levels, the setup hints at a potential bullish breakout soon. The projected move could lead to an impressive gain of around 70% to 80% once the price breaks above the wedge resistance.
This bullish momentum pattern is typically seen at the end of downtrends or corrective phases, and it represents a potential shift in market sentiment from bearish to bullish. Traders closely watching GMTUSDT are noting the strengthening momentum as it nears a breakout zone. The strong trading volume adds confidence to this pattern, showing that market participants may already be positioning early in anticipation of a reversal.
Investors’ growing interest in GMTUSDT reflects rising confidence in the project’s long-term fundamentals and current technical strength. If the breakout confirms with sustained volume, this could mark the start of a fresh bullish leg. Traders might find this a valuable setup for medium-term gains, especially as the momentum pattern completes and buying pressure accelerates.
✅ Show your support by hitting the like button and
✅ Leaving a comment below! (What is your opinion about this coin?)
Your feedback and engagement keep me inspired to share more insightful market analysis with you!
GMT/USDT — Massive Breakout or Another Rejection?The GMT/USDT chart on the 2D timeframe is currently showing a very interesting phase 👀 after spending months under medium-term bearish pressure 📉. Price is now approaching a major descending resistance trendline that has been holding the market down since mid-2025 🔻
If this resistance is successfully broken 💥, GMT could potentially start a much larger trend reversal 🚀. However, if the breakout fails ❌, bearish pressure may continue to dominate the market 🐻
━━━━━━━━━━━━━━━━━━
📊 GMT/USDT Chart Structure Analysis
Structurally, GMT is still moving within a Descending Trendline / Falling Resistance pattern 🔻, consistently forming lower highs since the previous peak area.
The chart also shows:
✅ A base accumulation forming at the bottom area
✅ Early signs of small higher lows
✅ Price approaching a key breakout resistance zone
This type of movement often becomes an early signal before major volatility occurs ⚡
━━━━━━━━━━━━━━━━━━
📉 Pattern Formation
🔻 Descending Resistance Trendline
The yellow trendline represents a major dynamic resistance that has continuously pressured price action for several months ⏳
Characteristics of this pattern:
📌 Indicates seller dominance is starting to weaken
📌 The more frequently resistance gets tested → the higher the breakout probability
📌 Usually produces a strong impulsive move once a valid breakout occurs 🚀
━━━━━━━━━━━━━━━━━━
🟢 Bullish Scenario 🚀
The bullish scenario will be confirmed if price manages to:
✅ Break above the resistance trendline
✅ Close strongly above the 0.01335 area
✅ Be supported by increasing volume 📊
If the breakout succeeds 💥, the next upside targets could be:
🎯 Bullish Targets:
🚀 0.01510
🚀 0.01610
🚀 0.01730
🚀 0.01910
🚀 0.02200
The 0.02200 area becomes a major resistance and an important psychological target if bullish momentum continues 🔥
📌 Additional bullish confirmations:
✅ Large breakout candle
✅ Successful retest holding above resistance
✅ Formation of higher highs 📈
━━━━━━━━━━━━━━━━━━
🔴 Bearish Scenario 🐻
The bearish scenario remains valid if:
❌ Price fails to break the trendline
❌ Strong rejection occurs at resistance
❌ Buying volume weakens 📉
If rejection happens ⚠️, GMT could potentially drop back toward:
🎯 Bearish Targets:
🔻 0.01290
🔻 0.01150
🔻 Previous low area around 0.01000
If lower support breaks again 💣, the larger downtrend may continue.
━━━━━━━━━━━━━━━━━━
⚡ Conclusion
GMT is currently sitting at a crucial area that could determine the next major market direction 🎯
A breakout from the descending trendline could become the first signal of a momentum shift from bearish to bullish reversal 🚀📈
However, until the breakout is fully confirmed ⚠️, traders should remain cautious of potential fakeouts and rejections.
📌 Main market focus right now:
👀 Price reaction around the resistance trendline
📊 Breakout volume
📈 Price ability to hold above 0.01335
━━━━━━━━━━━━━━━━━━
#GMT #GMTUSDT #Crypto 🚀 #Altcoin #TradingView #CryptoTrading #TechnicalAnalysis 📊 #Bullish #Bearish #Breakout 💥 #Altseason #Binance #PriceAction #SupportResistance #Trendline #CryptoMarket #Trader #ChartAnalysis #SwingTrading #CryptoSignal
Gmtusdt shortInstructions:
Entry point: yellow
Stop loss: red
Take profit: green
👉Leverage x 5-10-20 for crypto
👉Leverage x 20-50-100 for commodities, stocks, indices, and forex
👉Margin 1-5% max.
Always practice risk and money management.
Invest a maximum of 5% on any trade or across all your trades.
Invest only what you can afford to lose, as no one is in control of the market.
👉Our analyses are primarily based on:
breakouts: two trend lines (ascending and descending) and a line indicating a horizontal breakout.
chart patterns: shoulders and head, triangle parttern, elliott impulse, etc etc.
We don't always have the time to track them at all times or to represent them visibly, given the numerous signals, the number of channels to manage, and especially because of the often rapid pace of market movements.
indicators: We associate at least two indicators with this technique.
👉Depending on the circumstances, we use specific indicators, often setting 3 or more take profit levels.
👉Indeed, there are good days in trading and also bad days. No one can promise to win every trade, and like all traders worldwide, we also experience stop-loss orders. However, we win more than we lose and remain positive.
👉You can close the position before or after the take profit orders indicated by the green lines if you are personally satisfied; the same applies to stop loss orders.
👉We must stay positive, clear-headed, and humble.
we cannot provide all instructions or all trades here on this channel.
Good luck to us all, and may God guide us. Amen.
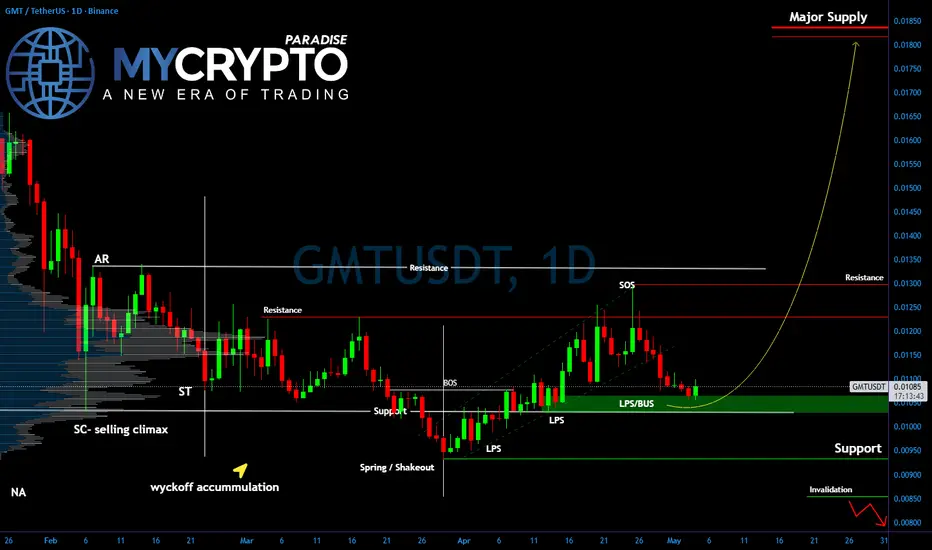
GMT: Real Move or Another Trap?💎Yello, are you about to get caught on the wrong side of GMT just before the real expansion phase begins?
💎#GMTUSDT has clearly completed a full Wyckoff accumulation range. The initial phase started with a strong selling climax, followed by an automatic rally and a secondary test, confirming that demand began to step in. This created the foundation for accumulation, where smart money quietly positioned itself while retail traders lost interest.
💎As the price developed further, we saw a clear spring or shakeout below support. This move was designed to trap weak hands and force early buyers out of their positions. Immediately after, the market reclaimed the range, confirming strength and signaling that larger players were defending lower levels.
💎The most important confirmation came with the break of structure. This shift marked the transition from accumulation into a more bullish environment. Following that, price formed multiple last points of support, showing that demand is consistently stepping in on pullbacks.
💎Right now, GMT is sitting exactly in a critical zone. The current reaction in the LPS/BUS area is not weakness by default. In Wyckoff terms, this is where the market either confirms continuation or fails and re-enters the range.
💎 As long as the price holds above the support zone around $0.0100, the structure remains bullish. This level is acting as the key demand area where buyers must defend. If this level continues to hold, the probability increases for a continuation toward the next resistance around $0.0130.
💎A successful breakout above this resistance would open the path toward higher supply zones, with the major target sitting near $0.0180. This is where significant selling pressure is expected and where smart money may begin distributing positions again.
💎However, you need to stay realistic and disciplined. If the price loses the $0.0100 support and fails to reclaim it quickly, the bullish scenario weakens significantly. In that case, the market could revisit lower levels near $0.0085, which serves as the invalidation zone for this current structure.
Right now, this is a patience game. The market is building energy, and a liquidity event is highly likely before the real move unfolds.
MyCryptoParadise
iFeel the success🌴
GMTUSDT Forming Descending ChannelGMTUSDT is forming a clear descending channel pattern, a classic bullish reversal signal that often indicates an upcoming breakout. The price has been consolidating within a narrowing range, suggesting that selling pressure is weakening while buyers are beginning to regain control. With consistent volume confirming accumulation at lower levels, the setup hints at a potential bullish breakout soon. The projected move could lead to an impressive gain of around 70% to 80% once the price breaks above the channel resistance.
This descending channel pattern is typically seen at the end of downtrends or corrective phases, and it represents a potential shift in market sentiment from bearish to bullish. Traders closely watching GMTUSDT are noting the strengthening momentum as it nears a breakout zone. The good trading volume adds confidence to this pattern, showing that market participants are positioning early in anticipation of a reversal.
Investors’ growing interest in GMTUSDT reflects rising confidence in the project’s long-term fundamentals and current technical strength. If the breakout confirms with sustained volume, this could mark the start of a fresh bullish leg. Traders might find this a valuable setup for medium-term gains, especially as the channel pattern completes and buying momentum accelerates.
✅ Show your support by hitting the like button and
✅ Leaving a comment below! (What is your opinion about this Coin?)
Your feedback and engagement keep me inspired to share more insightful market analysis with you!
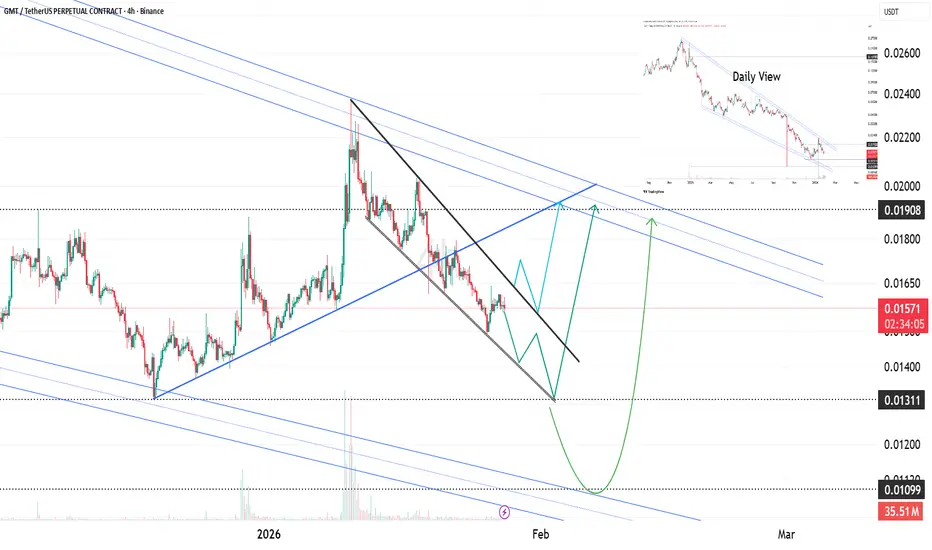
GMT Falling Wedge | Reversal Setup at DemandGMT is forming a clear falling wedge with price compressing toward the wedge support near 0.013–0.011. This structure typically signals selling pressure exhaustion, especially after a prolonged downside move.
Price is currently reacting from the lower boundary of the falling wedge, suggesting buyers are stepping in. A confirmed breakout above wedge resistance can trigger a upside move, with first targets around 0.019–0.020, followed by higher continuation if momentum builds.
If price breaks and closes below 0.011, this bullish setup will be invalidated.
$GMT stabilizes at demand, pullback long targets $0.023BINANCE:GMTUSDT spent an extended period in correction, leaving price compressed and direction uncertain.
Price is now showing early bullish reversal signs with a high-probability pullback-based long setup forming at key demand.
Price retraced into a validated demand zone: $0.01904 – $0.01853
Bullish Harami printed at support → seller exhaustion
Structure favors buyers while holding above demand
Buying Zone: $0.01904 – $0.01853
Entry: $0.01891
Stop Loss: $0.01811
Target 1: $0.02078
Target 2: $0.02291
Bullish bias remains intact above $0.01811.
Break below invalidates the setup.
GMTUSDT UPDATE#GMT
UPDATE
GMT Technical Setup
Pattern: Falling Wedge Pattern
Current Price: 0.02143$
Target Price: 0.03060$
Target % Gain: 112.84%
Technical Analysis: GMT is breaking out of a falling wedge pattern on the 1D timeframe, signaling a bullish reversal after an extended downtrend. Price has pushed above the descending resistance trendline and is showing follow-through strength, suggesting buyers are gaining control. The projected upside target is derived from the height of the wedge, pointing toward the 0.030–0.031$ region, which also aligns with a previous resistance zone. A sustained hold above the breakout area would support continuation toward the target.
Time Frame: 1D
Risk Management Tip: Always use proper risk management.
GMT WILL OUTPERFORM ALL MARKET🔥 Fortune AI Radar — NZX:GMT
Fresh activity detected on NZX:GMT today.
Data suggests increasing market interest & buyers stepping in.
Technicals currently lean bullish, with momentum trending upward.
Whales showing hints of accumulation and hype rising among traders.
This coin is flashing strong signals on short-term charts — worth keeping an eye on 👀
Not financial advice — always research before taking decisions
GMT/USDT — Downtrend Exhaustion | DCA Zone for Recovery PhaseGMT/USDT has been locked in a prolonged and aggressive downtrend, a phase that typically ends with seller exhaustion and weak-hand capitulation. Current price behavior suggests that this bearish cycle is approaching completion, with the market preparing to transition into a recovery phase.
From a risk-to-reward perspective, this area offers a favorable accumulation opportunity rather than a chase.
GMTUSDT UPDATEGMT
UPDATE
GMT Technical Setup
Pattern: Falling Wedge Pattern
Current Price: $0.0142
Target Price: $0.03000
Target % Gain: 111.27%
Technical Analysis: GMT is forming a falling wedge pattern on the 1D chart, indicating bullish potential if price can break and hold above the wedge’s resistance trendline. The current consolidation near support shows buyers defending levels, and an eventual breakout with volume could push price toward the $0.03000 target zone. The setup becomes more valid as price approaches key resistance and structure levels.
Time Frame: 1D
Risk Management Tip: Always use proper risk management.
GMTUSDT 3D#GMT is moving inside a falling wedge pattern on the 3-day timeframe chart and is currently testing the wedge support line. In case of a successful bounce and a breakout above the wedge resistance, the potential targets are:
🎯 $0.03760
🎯 $0.04337
🎯 $0.05436
🎯 $0.06325
🎯 $0.07214
🎯 $0.08479
🎯 $0.10090
⚠️ Always remember to use a tight stop-loss and maintain proper risk management.
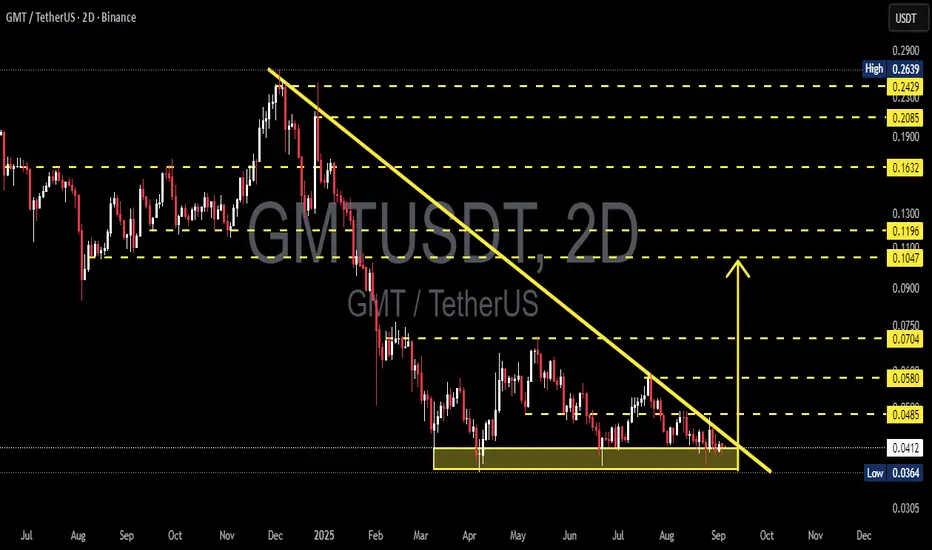
GMT/USDT — Descending Triangle: Breakout or Breakdown?📝 Market Overview:
Since the early 2025 peak, GMT has been in a clear downtrend, consistently forming lower highs along the descending trendline (yellow).
Price is now consolidating within a major support zone at 0.0364 – 0.0413, which has been tested multiple times.
The structure forms a Descending Triangle: flat support + lower highs. Statistically, this pattern carries a bearish continuation bias, but a reversal scenario is not ruled out if bulls manage to reclaim key levels.
---
🔎 Pattern Significance
A Descending Triangle occurs when sellers keep pressing with lower highs, while buyers are forced to defend the same horizontal level.
➡️ Default bias: bearish (higher probability of breakdown, ~60–65%).
➡️ However, a strong breakout above the trendline often triggers a short squeeze, flipping sentiment and leading to a bullish reversal.
---
📊 Bearish Scenario (Dominant Bias)
Trigger: 2D candle close below 0.0364 with strong volume.
Target: Measured move (0.0485 – 0.0364 = 0.0121).
Breakdown projection → 0.0243.
Extra confirmation: Failed retest of broken support turning into resistance.
Risk: A weak-volume breakdown could lead to a fake-out and quick rebound.
---
📈 Bullish Scenario (Needs Strong Confirmation)
Trigger: 2D close above descending trendline and above first resistance 0.0485.
Initial targets: 0.0580 → 0.0704.
Extended target: 0.1047 if momentum builds.
Best confirmation: Successful retest of 0.0485 as new support with increased buying volume.
---
⚖️ Conclusion
The 0.036–0.041 zone is a “make-or-break” level for GMT.
As long as this support holds, bulls still have a fighting chance.
But the descending triangle pattern leans bearish → breakdown towards 0.024 remains a strong risk.
Traders should wait for a 2D candle confirmation with volume before committing to either direction.
---
📌 Trading Checklist
1. Focus on 2D candle closes (not intraday wicks).
2. Watch for volume confirmation on breakouts/breakdowns.
3. Prefer setups with retest + rejection for higher reliability.
4. Place stop-loss around invalidation levels (above resistance or below support).
5. Maintain strict risk management (R:R at least 1:2).
---
🔑 Key Technical Levels
Main Support: 0.0364 – 0.0413
Resistances: 0.0485 → 0.0580 → 0.0704 → 0.1047
Bearish target (breakdown): ~0.0243
Bullish targets (if breakout): 0.0580 → 0.0704
---
#GMT #GMTUSDT #Crypto #Altcoins #TechnicalAnalysis #DescendingTriangle #Breakout #Breakdown #SupportResistance #ChartPattern
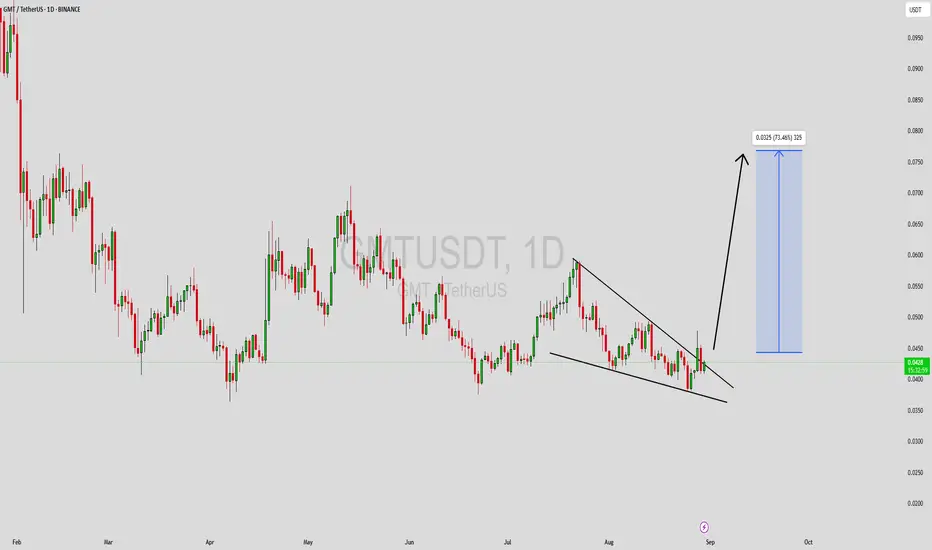
GMTUSDT Forming Bullish WaveGMTUSDT is showing signs of strength as the price structure forms a bullish breakout setup. The chart indicates that after a prolonged period of consolidation, the pair is attempting to push higher, supported by good trading volume. This increase in buying activity highlights that market participants are positioning themselves ahead of a potential trend reversal. If momentum sustains, GMTUSDT could enter a new bullish wave in the coming sessions.
With an expected gain of 60% to 70%+, this setup is drawing significant attention from traders and investors who are closely watching key breakout levels. The technical structure suggests that once price clears overhead resistance, strong upside potential could unfold rapidly. Such moves are often accompanied by increased liquidity and heightened trading interest, which further validates the bullish outlook.
Investor confidence in this project is gradually building, which can act as a catalyst for price expansion. The favorable combination of volume confirmation, technical breakout formation, and renewed interest from the community sets the stage for potential strong gains. Traders should remain attentive to continuation signals as the breakout unfolds.
✅ Show your support by hitting the like button and
✅ Leaving a comment below! (What is You opinion about this Coin)
Your feedback and engagement keep me inspired to share more insightful market analysis with you!