GMX/USDT – Update ON WAY TO BREAKOUT $12.60+📊 GMX/USDT – Update
GMX is approaching a key breakout area after a strong recovery from support. A confirmed move above resistance could trigger the next leg higher as bullish momentum continues to build.
🎯 TP 1: 8.30
🎯 TP 2: 10.85
🎯 TP 3: 12.60
🚀 Runner: Open above 12.60 if momentum remains stron
GMX: local squeeze with $7.701 destinationGMX has spent the summer carving out a range, bouncing off the mid-$5 lows and rotating back toward the middle of the band. Price is now coiling into Equilibrium — the kind of compression that resolves with a directional move.
The Macro Picture 🗺️
The broader structure is a range, not a trend. Macr
Gmx - 25.07.2006 - BullishLook at the gmx graph over time gives us several indications that a potential bounce is close. An interesting detail is that the stochastic rsi tried to break through three times and was interrupted twice...now on the third attempt, the indicator bounces from the red line, which it crossed the last
GMXUSDT Forming Bullish MomentumGMXUSDT is forming a clear bullish momentum pattern, a classic bullish wave signal that often indicates an upcoming breakout. The price has been consolidating within a narrowing range, suggesting that selling pressure is gradually weakening while buyers are beginning to regain control. With consiste
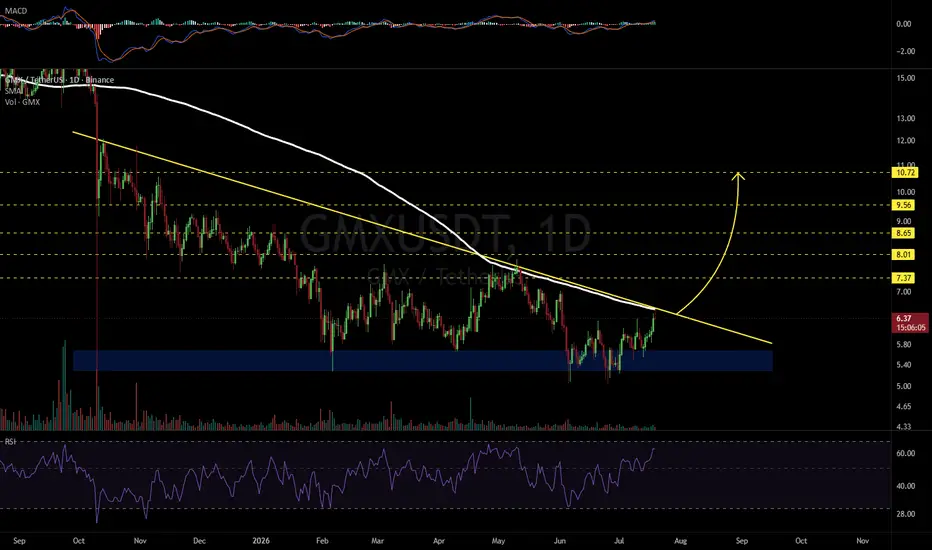
GMXUSDT 1D#GMX is testing both the descending trendline resistance and the 200-day SMA on the daily timeframe. A confirmed breakout above these key resistance levels could trigger a bullish move toward the following upside targets:
🎯 $7.37
🎯 $8.01
🎯 $8.65
🎯 $9.56
🎯 $10.72
⚠️ Always remember to use a tight s
GMX: local squeeze with $6.50 destinationThe Macro Picture 🗺️
GMX unwound its May $7.80 highs through a steady descent that bottomed at $5.05 in June. Since then the structure has settled into a range — price is now rotating inside a $5.05–6.10 band, a volatility playground where the lows keep getting defended and the rallies faded back t
GMX / GMXUSDT Bullish Setup | Futures Trade IdeaMARKET ANALYSIS
GMX is currently reacting from a key technical area highlighted on the chart.
As long as the protected support zone remains intact, the bullish market structure remains valid and higher liquidity targets may continue to attract price action.
A breakdown below the invalidation l
GMXUSDT Forming Falling WedgeGMXUSDT is forming a clear falling wedge pattern, a classic bullish reversal signal that often indicates an upcoming breakout. The price has been consolidating within a narrowing range, suggesting that selling pressure is weakening while buyers are beginning to regain control. With consistent volume
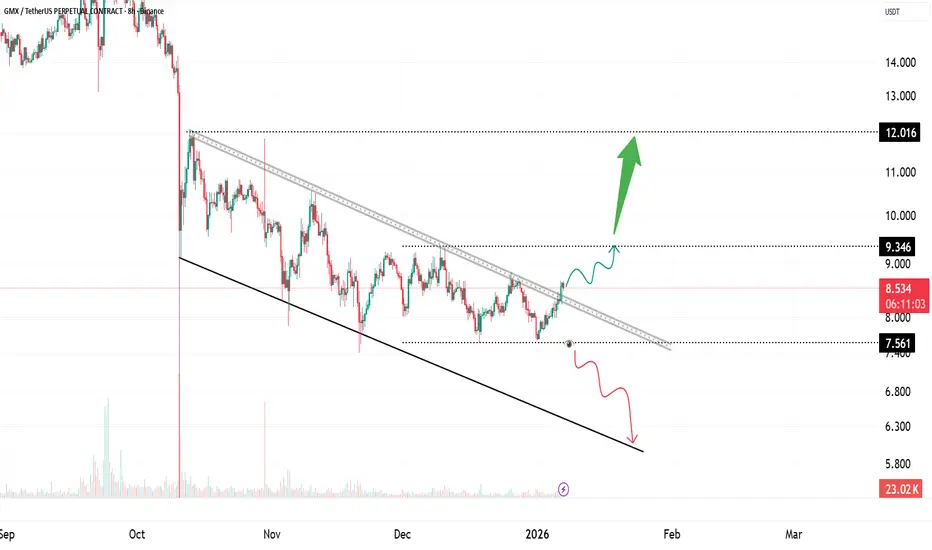
GMX Descending Channel | Testing Upper ResistanceGMX is trading inside a well-defined descending channel, marked by consistent lower highs and lower lows. Price action remains technically bearish, but momentum has slowed as price approaches the upper boundary of the channel.
This area is important. A break and hold above channel resistance would
See all ideas
Summarizing what the indicators are suggesting.
Oscillators
Neutral
SellBuy
Strong sellStrong buy
Strong sellSellNeutralBuyStrong buy
Oscillators
Neutral
SellBuy
Strong sellStrong buy
Strong sellSellNeutralBuyStrong buy
Summary
Neutral
SellBuy
Strong sellStrong buy
Strong sellSellNeutralBuyStrong buy
Summary
Neutral
SellBuy
Strong sellStrong buy
Strong sellSellNeutralBuyStrong buy
Summary
Neutral
SellBuy
Strong sellStrong buy
Strong sellSellNeutralBuyStrong buy
Moving Averages
Neutral
SellBuy
Strong sellStrong buy
Strong sellSellNeutralBuyStrong buy
Moving Averages
Neutral
SellBuy
Strong sellStrong buy
Strong sellSellNeutralBuyStrong buy
Displays a symbol's price movements over previous years to identify recurring trends.