GMX/USDT – Update ON WAY TO BREAKOUT $12.60+📊 GMX/USDT – Update
GMX is approaching a key breakout area after a strong recovery from support. A confirmed move above resistance could trigger the next leg higher as bullish momentum continues to build.
🎯 TP 1: 8.30
🎯 TP 2: 10.85
🎯 TP 3: 12.60
🚀 Runner: Open above 12.60 if momentum remains strong.
This process can take between hours and days.
👉 As long as price holds above the breakout zone, the bullish scenario remains active.
This is our trading expectation and not financial advice — everything depends on confirmed trend continuation.
In-depth trading ideas
GMX: local squeeze with $7.701 destinationGMX has spent the summer carving out a range, bouncing off the mid-$5 lows and rotating back toward the middle of the band. Price is now coiling into Equilibrium — the kind of compression that resolves with a directional move.
The Macro Picture 🗺️
The broader structure is a range, not a trend. Macro Resistance caps the top at $7.845 with Local High / Decision just below at $7.712, while Macro Support anchors the base at $5.016. Price has spent weeks oscillating between them rather than picking a side.
The Setup ⚙️
Price is trading at $6.240, holding well above Local Low at $5.803. The squeeze into Equilibrium is the tell — buyers and sellers are compressing, and the range floor is doing its job.
The Range Floor 🟢
$5.803–$6.240 is the zone that matters. This is where a range strategy accumulates — buying the lower half of the band and scaling out into strength, letting the rotation pay while price works.
The Decision Point 🔴
$7.712 is the level that flips the story. Reclaim it and the range breaks upward; lose $5.803 and price slides back toward the $5.016 macro base.
The Roadmap 🛣️
Holding the range floor keeps the squeeze bullish and points price toward the $7.701 bull target. Invalidation is a daily close below $5.803 — lose the floor and the range thesis flips toward the lower band.
A GRID bot is built for exactly this kind of rotation — placing orders across the Range Floor and mid-band, banking every swing while price oscillates instead of waiting for one clean breakout.
#GMX #Crypto #Bitcoin #Altcoins #GRID #TradingView #3Commas
Gmx - 25.07.2006 - BullishLook at the gmx graph over time gives us several indications that a potential bounce is close. An interesting detail is that the stochastic rsi tried to break through three times and was interrupted twice...now on the third attempt, the indicator bounces from the red line, which it crossed the last two times and destroyed the growing trend...this gives me an indication that this was all correction wave 3. In this attempt, I expect support from the rest of the market, and if Btc decides to break through, gmx will grow five more.All indicators on monthly suggest a piercing move. Good luck
GMXUSDT Forming Bullish MomentumGMXUSDT is forming a clear bullish momentum pattern, a classic bullish wave signal that often indicates an upcoming breakout. The price has been consolidating within a narrowing range, suggesting that selling pressure is gradually weakening while buyers are beginning to regain control. With consistent trading volume confirming accumulation at lower levels, the current setup hints at a potential bullish breakout in the near future. If the breakout is confirmed, the projected move could lead to an impressive gain of around 30% to 40%.
This bullish momentum pattern is commonly seen at the end of downtrends or corrective phases, signaling a potential shift in market sentiment from bearish to bullish. Traders closely watching GMXUSDT are noticing strengthening momentum as the price approaches a key breakout zone. Healthy trading volume adds confidence to this setup, indicating that market participants are positioning early in anticipation of a sustained upward move.
Growing investor interest in GMXUSDT reflects increasing confidence in the project's long-term potential and its current technical structure. If buyers successfully push the price above the major resistance level with sustained volume, it could mark the beginning of a fresh bullish leg. The ongoing consolidation phase suggests steady accumulation, creating favorable conditions for a strong continuation rally once the breakout is confirmed.
Traders may find this an attractive medium-term opportunity, especially as the bullish momentum pattern nears completion and buying pressure continues to build. A confirmed breakout could attract additional market participation and accelerate the move toward the projected upside target.
✅ Show your support by hitting the like button.
✅ Leaving a comment below! (What is You opinion about this Coin)
Your feedback and engagement keep me inspired to share more insightful market analysis with you!
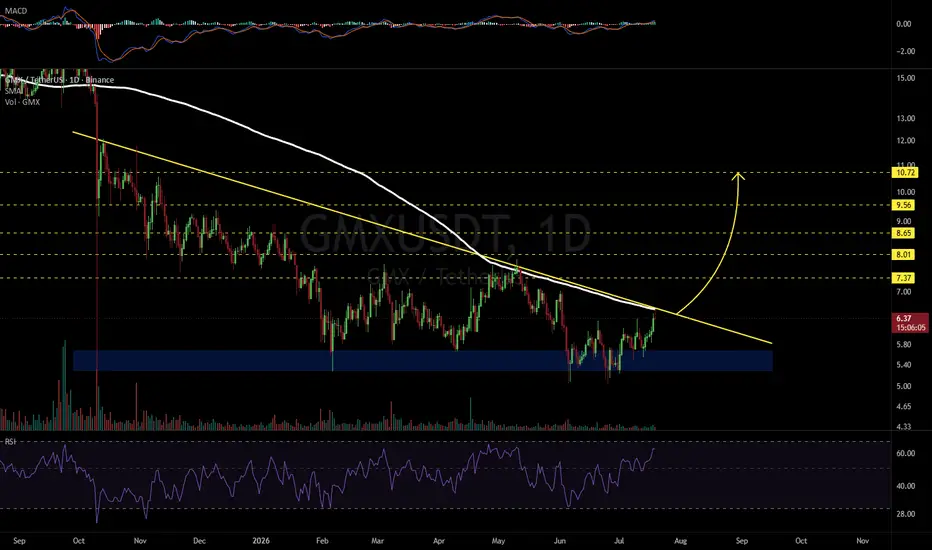
GMXUSDT 1D#GMX is testing both the descending trendline resistance and the 200-day SMA on the daily timeframe. A confirmed breakout above these key resistance levels could trigger a bullish move toward the following upside targets:
🎯 $7.37
🎯 $8.01
🎯 $8.65
🎯 $9.56
🎯 $10.72
⚠️ Always remember to use a tight stop-loss and maintain proper risk management.
GMX: local squeeze with $6.50 destinationThe Macro Picture 🗺️
GMX unwound its May $7.80 highs through a steady descent that bottomed at $5.05 in June. Since then the structure has settled into a range — price is now rotating inside a $5.05–6.10 band, a volatility playground where the lows keep getting defended and the rallies faded back toward the middle. Price has worked up to the upper half near $5.95 with RSI reclaiming the midline around 53. With the floor firmly established and momentum turning up, the path of least resistance leans toward a test of the range ceiling from here.
The Setup ⚙️
The Buy Area: The $5.40–5.95 band has absorbed pullbacks throughout the range. Bulls are defending each dip, and as marked on the chart, price is holding above the $5.40 local support with momentum behind it.
The Ceiling: The $6.10 decision line caps the range. A clean reclaim flips the local structure bullish and opens the path toward the $6.50 macro resistance above.
The Range Play: The zone between $5.40 and $6.10 creates a structural playground for grid-based accumulation — staggered entries across the range capture the chop while the market decides its next macro leg.
The Roadmap: Primary target sits at $6.50 — the green roadmap points there as price works up toward and through the range top. Invalidation: a clean daily close below $5.05 would invalidate this bullish thesis and signal a structural breakdown out of the range.
More setups in profile.
#GMX #CRYPTO #DeFi #Perpetuals #TechnicalAnalysis
GMX / GMXUSDT Bullish Setup | Futures Trade IdeaMARKET ANALYSIS
GMX is currently reacting from a key technical area highlighted on the chart.
As long as the protected support zone remains intact, the bullish market structure remains valid and higher liquidity targets may continue to attract price action.
A breakdown below the invalidation level would weaken the current bullish scenario and require a reassessment of market conditions.
📍 Entry, Stop Loss and Take Profit levels are marked directly on the chart.
━━━━━━━━━━━━━━
⚠️ DISCLAIMER
This publication is provided solely for educational and market observation purposes.
Nothing contained in this analysis should be considered financial advice, investment advice, or a recommendation to buy or sell any financial instrument.
All trading and investment decisions remain solely the responsibility of the individual trader.
Always conduct your own research and apply proper risk management before entering any position.
━━━━━━━━━━━━━━
🎯 PARALOG
▪️Crypto Market Analysis
▪️BTC Futures Signals
▪️Bitcoin & Altcoin Market Analysis
Precision • Momentum • Timing
━━━━━━━━━━━━━━
Exchange: #MEXC Futures
#bitcoin #btc #crypto #futures #technicalanalysis
GMXUSDT Forming Falling WedgeGMXUSDT is forming a clear falling wedge pattern, a classic bullish reversal signal that often indicates an upcoming breakout. The price has been consolidating within a narrowing range, suggesting that selling pressure is weakening while buyers are beginning to regain control. With consistent volume confirming accumulation at lower levels, the setup hints at a potential bullish breakout soon. The projected move could lead to an impressive gain of around 90% to 100% once the price breaks above the wedge resistance.
This falling wedge pattern is typically seen at the end of downtrends or corrective phases, and it represents a potential shift in market sentiment from bearish to bullish. Traders closely watching GMXUSDT are noting the strengthening momentum as it nears a breakout zone. The good trading volume adds confidence to this pattern, showing that market participants are positioning early in anticipation of a reversal.
Investors’ growing interest in GMXUSDT reflects rising confidence in the project’s long-term fundamentals and current technical strength. If the breakout confirms with sustained volume, this could mark the start of a fresh bullish leg. Traders might find this a valuable setup for medium-term gains, especially as the wedge pattern completes and buying momentum accelerates.
✅ Show your support by hitting the like button and
✅ Leaving a comment below! (What is your opinion about this Coin?)
Your feedback and engagement keep me inspired to share more insightful market analysis with you!
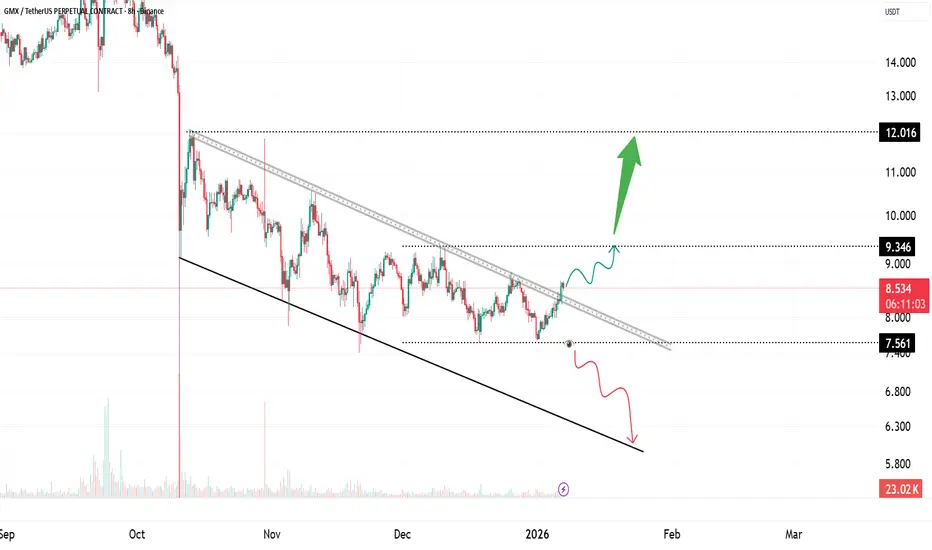
GMX Descending Channel | Testing Upper ResistanceGMX is trading inside a well-defined descending channel, marked by consistent lower highs and lower lows. Price action remains technically bearish, but momentum has slowed as price approaches the upper boundary of the channel.
This area is important. A break and hold above channel resistance would signal a potential trend shift and open the path toward higher resistance levels. Until that happens, the structure remains corrective within a broader downtrend.
If price gets rejected from the upper channel resistance, continuation toward the lower boundary of the channel remains possible. Direction will be decided by how price reacts at this resistance zone.
Key levels to watch
Upper channel resistance for breakout confirmation
Lower channel support for downside continuation
Horizontal resistance above the channel as upside targets
Bias remains neutral until a confirmed breakout.
GMXUSDT Forming Bullish ContinuationGMXUSDT is currently trading within a consolidation zone, forming a contracting pattern that indicates a potential breakout ahead. With strong volume support and steady investor activity, this setup is gaining attention as a possible bullish continuation structure. Based on the technical outlook, GMXUSDT shows the potential for a 50% to 60%+ move if momentum builds and buyers push the price above key resistance levels.
This kind of structure often signals accumulation, where smart money is preparing for the next upward move. A confirmed breakout from the pattern could trigger a rally toward higher resistance zones, making GMXUSDT an attractive opportunity for traders seeking medium-term gains. The current chart structure aligns with bullish market sentiment and offers a favorable risk-to-reward setup.
Investor interest is steadily increasing, and the volume profile supports the possibility of a breakout-driven rally. If the trend follows through, GMXUSDT could experience significant price expansion in the coming weeks. Monitoring the breakout levels will be crucial, as a strong push above resistance may unlock fresh bullish momentum for this pair.
✅ Show your support by hitting the like button and
✅ Leaving a comment below! (What is You opinion about this Coin)
Your feedback and engagement keep me inspired to share more insightful market analysis with you!
GMXUSDT Forming Bullish MomentumGMXUSDT is currently showing a breakout setup from a long-standing resistance zone that looks to be flipping into support—a decisive shift that often marks the start of a new bullish trend. The price pushed through the overhead resistance on strong volume, signaling a potential change in market sentiment. Pulling back slightly toward the new support may provide a solid entry point for traders looking to capitalize on the momentum.
Volume conditions are solid, suggesting that this move is supported by genuine buying interest, not just a short-term spike. A successful retest of the breakout zone could serve as confirmation and set the stage for a further rally. If momentum holds, this could result in a 90%–100%+ gain as price targets are reached toward prior highs.
Wider market attention is turning toward GMX, with more investors recognizing its potential as decentralized perpetual trading gains traction. The combination of structural breakout, volume backing, and rising investor interest makes GMXUSDT an attractive mid-term setup for those targeting higher returns.
This chart is worth watching closely—especially key support retests and volume behavior—to determine if this breakout has staying power and can launch a sustained trend.
✅ Show your support by hitting the like button and
✅ Leaving a comment below! (What is You opinion about this Coin)
Your feedback and engagement keep me inspired to share more insightful market analysis with you!
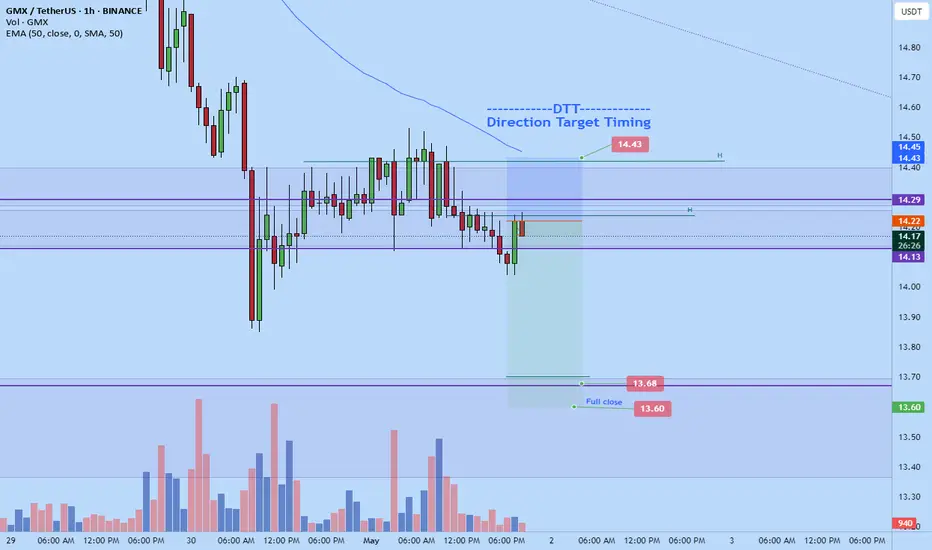
GMXUSDT 30%+ Short opportunity here?I found a possible short opportunity here in one of the largest up-trending tokens in the last 24 hours. You can see by all the previous structure of what I call the EMA (solid red smoothed Heikin Ashi candles) and how the actual price behaves when it break up through the mean. It is short lived (2-4 days) and the average move down is 35.94%.
Keep in mind to have a plan to add to your short if it move higher against you first, so spread a series of smaller short limit orders across 18% above the MA break would be what I am doing. I generally like to fill one short first, and let the price come to my better series of entries. Thus, averaging my entry and this gives me the opportunity to get out if price continues to move up. As I can get out on a retrace at break even or a small profit. Do not attempt this strategy unless you place small orders, don't go higher than 10x leverage and commit to managing the trade for multiple hours to get out unscathed. Something I would do at the start of my trading session, not when I need to get some sleep.
But this strategy works. I am nobody special and currently the #2 lead trader on Bitunix for copy trading at time of writing.
There are two lower highs on the 1H right now! So this is a high probability of profit.
gmx extremely over sold (easy 400-500% gain)The descending broadening wedge chart pattern is a bullish reversal formation characterized by two sloping and diverging trend lines. This pattern emerges as the price fluctuates between the upper resistance and lower support trend lines, expanding the trading range during a downtrend.
A descending broadening wedge is bullish chart pattern (said to be a reversal pattern). It is formed by two diverging bullish lines.
A descending broadening wedge is confirmed/valid if it has good oscillation between the two upward lines . The upper line is the resistance line; the lower line is the support line.
Each of these lines must have been touched at least twice to validate the pattern.
NB: a line is said to be "valid" if the price line touches the support or resistance at least 3 times.
This implies that the descending broadening wedge pattern is considered valid if the price touches the support line at least 3 times and the resistance line twice (or the support line at least twice and the resistance line 3 times).
A descending broadening wedge does not mark the exhaustion of the selling current, but the buyers’ ambition to take control. The divergence of the two lines in the same direction (increase in price magnitude) informs us that the price continues to fall with movements that are increasingly low in magnitude. The sellers manage to make the price rebound on the resistance line but lose control after the formation of a new lowest point. The highest point reached during the first correction on the descending broadening wedge’s resistance line forms the resistance. A second wave of decline then occurs of more magnitude, signalling the sellers' loss of control after a new lowest point. A third wave forms afterwards but the sellers lose control again after the formation of new lowest points.
During the formation of a descending broadening wedge, volumes do not behave in any particular way but they increase strongly when the support line breaks.
This type of pattern appears on the troughs, it is a bullish reversal pattern.
The break in the resistance line definitively validates the pattern.
The price objective is determined by the highest point at which the descending broadening wedge was formed.
NB: often, the steeper the descending broadening wedge’s trend lines, the faster the price objective is reached.
Statistics of the descending broadening wedge after a bullish movement
In 80% of cases, the exit is bullish.
In 75% of cases, a descending broadening wedge is a reversal pattern.
In 60% of cases, a descending broadening wedge’s price objective is achieved when the resistance line is broken.
In 21% of cases, the price makes a pullback in support on the descending broadening wedge’s resistance line.
I also feel its important to add the staking on this is crazy, and comes from margin fees. app.gmx.io its about 80% at time of post.
trading the decending channel for 300% (long)The descending channel pattern (also called the falling channel) is a bearish chart formation. It develops within pronounced downtrends in asset pricing.
Forex traders view descending channels as evidence of weakened strength in the counter currency. Accordingly, it is frequently used to sell a currency pair and join the prevailing market downtrend.
It appears as two parallel lines in a downward trend, forming resistance and support levels for the price. The upper boundary is formed by connecting the lower highs, while the lower boundary comes from connecting the lower lows.
The descending channel is strictly a bearish chart formation. But it has a bullish alternative called the ascending channel, where everything is completely opposite.
Contrary to trend-following strategies, descending channels may also be used to project a shift in a prevailing bearish trend. This is done by waiting to buy the market on price breaks above the channel’s upper extreme.
To trade reversal breakouts, you buy the market above the upper trend line. In doing so, a new long position is opened. Stop-loss orders are placed beneath the channel, and profit targets are located above the channel.
#1 – Trade the Breakout
One method is to trade the breakout of the channel. This breakout can be to the upside, but also to the downside. This setup is going to be the toughest of the three to trade, due to the false breakouts which occur in the market at a high frequency.
Breakout to the Upside
A breakout to the upside means there is a possible shift from a bearish sentiment to bullish. This strategy will have you buying the break above the channel. It’s recommended that buying into this break should occur after multiple tests of the upper channel line. Reason being breakouts early on in the channel often lead to traps as shorts push the price of the stock back down to the lower end of the channel.
#2- Short the Test of the Top of the Channel
Channels are better suited for traders that place trades within the range. The top of the channel is also known as the overbought territory for all of you Wyckoff traders out there.
This means that as a stock approaches the upper channel, there is a high probability of price returning inside of the channel.
For this strategy, you will place your sell order at the top of the channel and then cover your position as the stock moves in your favor. There is no guarantee the stock will make it all the way back to the support channel, so you need to be prepared for anything.
Also, the price action for stocks trading in channels is often slow and boring. Therefore the trading action will appear erratic at times as price marches to its own beat. This will give you a number of false signals, and head fakes as the action plays out within the channel.
This is why again it’s better to cover as things go in your favor and remember to exercise patience
#3 – Buy the Test of the Bottom of the Channel
Buying the test of the lower portion of the channel can get tricky. This is because you are knowingly buying a stock that is in a weak position. Therefore, you need to tread the waters with caution. That doesn’t mean you can’t take action but you have to be prepared that the stock may not bounce and could just ride the lower portion of the channel lower with no reaction back to the top line.
this trade will utilize number 3 gl guys...
GMX is Still Bearish (12H)From the point where we placed a red arrow on the chart, it appears that GMX has entered a bearish diametric pattern.
It now seems that wave F is nearing completion.
The target is marked on the chart. it could be the green target box. If a daily candle closes above the upper red box, this analysis will be invalidated.
For risk management, please don't forget stop loss and capital management
Comment if you have any questions
Thank You
GMX/USDTHello friends
Due to the heavy price drop on the indicated support, buyers have provided good support for the price, which has caused a good price growth.
Now you can buy in steps in the indicated support areas.
If you want to be with us in the Alt Season, send us a message.
*Trade safely with us*
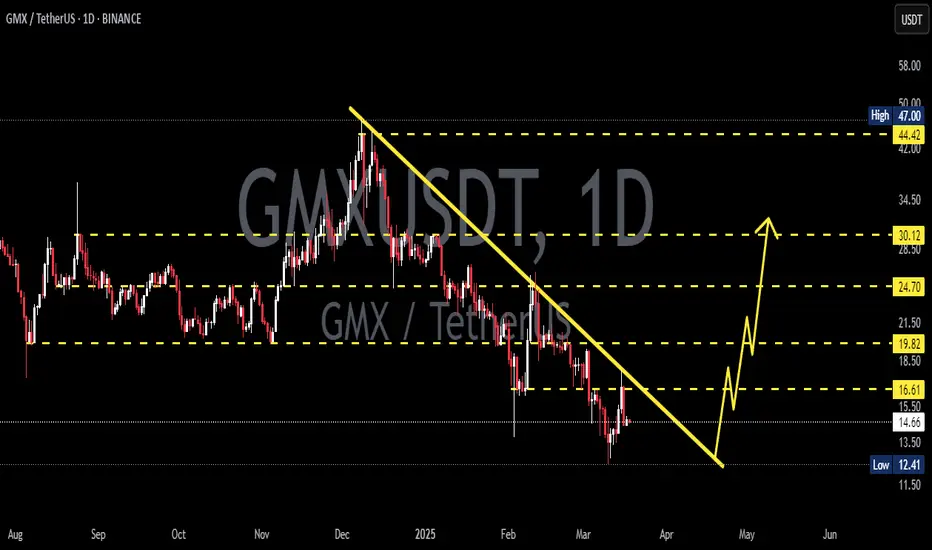
GMXUSDT UPDATEGMXUSDT is a cryptocurrency trading at $15.52. Its target price is $30.00, indicating a potential 90%+ gain. The pattern is a Bullish Falling Wedge, a reversal pattern signaling a trend change. This pattern suggests the downward trend may be ending. A breakout from the wedge could lead to a strong upward move. The Bullish Falling Wedge is a positive signal, indicating a potential price surge. Investors are optimistic about GMXUSDT's future performance. The current price may be a buying opportunity. Reaching the target price would result in significant returns. GMXUSDT is poised for a potential breakout and substantial gains.
GMX/USDT 1W🩸 TSX:GMX ⁀➷
#GMX_IO. Macro chart Another
💯 Intermediate Target - $67
🚩 Macro Target 1 - $94
🚩 Macro Target 2 - $148
🚩 Macro Target 3 - $220
- Not financial advice, trade with caution.
#Crypto #GMX_IO #GMX #Investment
✅ Stay updated on market news and developments that may influence the price of GMX_IO. Positive or negative news can significantly impact the cryptocurrency's value.
✅ Exercise patience and discipline when executing your trading plan. Avoid making impulsive decisions driven by emotions, and adhere to your strategy even during periods of market volatility.
✅ Remember that trading always involves risk, and there are no guarantees of profit. Conduct thorough research, analyze market conditions, and be prepared for various scenarios. Trade only with funds you can afford to lose and avoid excessive risk-taking.