Gnosis (GNO) Extended Consolidation = 6 Months Bullish ActionMany projects have been moving sideways since February 2026, Gnosis (GNOUSDT) has been doing so since March 2025, for a very long 455 days.
The price range that is supporting this consolidation period is the same from 2022-2023. Back in 2022-23 GNOUSDT went sideways for 518 days and this supported five months of bullish action; today, market conditions are the same, we can expect the same results.
Volume goes down during the consolidation period, this signal is present. 100% sideways with a lack of new lows. All the big wicks are pushing higher but not lower revealing a hidden bullish bias. This means that this consolidation period will result in bullish action.
Finally, a higher high is possible or even a bull market or new all-time high. All bullish scenarios are possible in the coming years. The minimum we will get is sustained bullish action with a very strong bullish market phase. This is a strong chart setup.
Thank you for reading.
Namaste.
In-depth trading ideas
$GNO – Ready for Bullish Continuation After Breakout?BINANCE:GNOUSDT
CRYPTOCAP:GNO – Ready for Bullish Continuation After Breakout? 📈
🧐 Price is expected to move sideways 🔀, as this corrective movement may form a triangle pattern, following the strong bullish breakout seen through the sub-waves of wave 3.
✨ Once all sub-waves of the triangle pattern are completed — which may represent wave four — and the upper boundary is broken 🏹 along with a key level, this would signal positive development reinforcing confidence in the bullish move. The expected upward movement could reach the 136.32 – 139.18 zone, reflecting continuation of the uptrend. 📈
👉 However, an alternative scenario suggests the possibility of a deeper correction, where price may decline toward the 38.20% – 50% retracement of the previous upward wave, as illustrated by the grey line on the chart.
#GNOUSDT #Gnosis #ElliottWave #Crypto #SmartWedgeTrader #FVG #WaveAnalysis #BullishBreakout #AltcoinSeason #TradingView
GNO: catching the bounce? key levels and targets for todayGNO
Catching the knife or catching the bounce? While most eyes are on majors, GNO just printed a nasty flush into a big historical demand zone as DeFi sentiment cooled off according to the market. Today we saw a sharp wick down and instant buyback, which often means someone with size just stepped in.
On the 4H chart, price tapped that green demand block around 120 and snapped back, with RSI lifting out of oversold after a mini capitulation spike. I’m leaning long here: momentum is trying to reverse, and any follow‑through from fresh interest in DeFi governance plays could fuel a short squeeze toward the first liquidity pocket around 130. I might be wrong, but this looks more like exhaustion selling than the start of a full trend collapse.
My base plan: as long as GNO holds above 121‑122, I expect a grind up toward 130‑132, with extension possible into the red supply zone above if volume kicks in. Lose that 121 floor on a 4H close and the idea is invalidated for me, opening room for a deeper dive toward the lower part of the green zone. ✅ I’m watching for a clean retest of 124‑125 to build longs rather than chasing green candles.
GNO: sleeper alert? watch key levels for the next few daysGNO. Anyone else watching this sleeper wake up again? According to industry sources, Gnosis is back in the spotlight with fresh ecosystem upgrades and more noise around payments and validators, while majors just range. The market reacted by dragging price right back into this old battlefield zone you see in orange on the 4H.
On the 4H chart, GNO is parked on a thick horizontal volume node around 118-120, a level that has flipped between support and resistance multiple times. RSI bounced from oversold and is now chopping just under 50, which looks more like a consolidation inside a trend than a final top. As long as we keep 118-120 on closing basis, I lean bullish, eyeing a move first into 124, then into that darker supply band above 130 where the last big sellers showed up.
My game plan: stalk dips into 118-120 with tight invalidation under 117, then scale out into 124 and 130+ if buyers step back in ✅. If 117 gives way with strong volume and RSI rolls under 40, I assume the level failed and let price slide toward 110 without me. I might be wrong, but this kind of balanced base right on a major volume node is exactly where I like to take my shot.
GNO: Strong Bear Label, Accumulation StructureGNO: Strong Bear Label, Accumulation Structure — 0th Percentile Leverage + OBV Inflow
📊 Overview
GNO presents one of the cleanest structural setups in crypto right now — hiding behind a Strong Bear label. The bias reads 46% bearish across 74.4% of timeframes, but every underlying metric tells a completely different story. Leverage at the absolute 0th percentile floor. F/S ratio a pristine 4.86x normal — no manipulation, no ghost market. OBV confirmed inflow at 1.16, meaning money is actively flowing in while the bias points down. And the bounce ratio is a perfect 1x balanced — bears simply cannot push price below its recovery point. This is what accumulation looks like before the market admits it.
💰 Price
Spot: $127.8 | Futures: $127.3
Retrace: -1.7% | Bounce: 1.8% | 1x Balanced ⚖️
The 1x bounce ratio is the most important number on this chart. For every dollar lost, one dollar recovered. In a Strong Bear environment, this should be impossible — bears should be winning the price battle. Instead, buying pressure matches selling dollar for dollar. The -1.7% retrace is shallow and the 1.8% bounce actually exceeds it slightly. This isn't structural weakness — it's contested accumulation where bears control the signal count but bulls control the actual price.
📉 Bias
Strong BEAR — 25.6 / 74.4 across all timeframes
Signals: 10🟢 : 29🔴 / 112
EMA: 0:6 swept | Candle: 2:4 | Ichimoku: 4:7
C>T: 3:11 | Engulfing: 1:1 balanced | Spread: 48.7% Strong
SS/DD: 3:4 — supply slightly dominant but nearly balanced
Clarity at 35% — very low. The lowest conviction strong bear reading possible. When clarity is this low on a strong directional bias, it often means the bias is about to flip rather than intensify. The signals are bearish but the structure beneath isn't following.
Note Engulfing at 1:1 — perfectly split. Equal bullish and bearish engulfing means the reversal battle is genuinely 50/50 despite the overall lean. A crack in the bear thesis the headline numbers hide.
📊 Volume — Clean and Accumulating
Spot Z: -0.44 Steady | Futures Z: -0.44 Steady — identically muted across both markets. Perfect symmetry suggests organic, balanced participation rather than one side dominating.
Spot:Fut = Normal — no distortion, no ghost market dynamics. The relationship is functioning properly.
Momentum: 0.04 Rising — volume impulse turned positive, supporting the accumulation thesis with rising participation.
F/S Ratio: 4.86x Normal — THIS IS RARE. Most crypto trades at 50x-500x futures-to-spot. At 4.86x, almost no speculative leverage distorts price. Nearly pure price discovery — what moves here is actual buying and selling, not derivative speculation. Every signal on this chart is significantly more reliable because of this clean structure.
S/F $: $1.36M spot / $6.58M futures
OBV Z: 1.16 Inflow ↑ — confirmed accumulation. OBV is statistically above average at 1.16σ. In a Strong Bear, OBV should show outflow as holders distribute. Instead, buying meaningfully outpaces selling. Combined with 1x balanced bounce and normal F/S ratio, this creates a three-point accumulation signature: price holding, money flowing in, no leverage distortion. This trifecta precedes structural reversals.
🔥 Squeeze — Energy Building
Squeeze: ELEVATED (7 bars) — compression building steadily.
Momentum: Bear ↓ | BW: 1.93% — extremely narrow bandwidth means significant stored energy relative to recent volatility. Even moderate expansion produces proportionally large moves.
Contraction: ↓ 18.3% — still tightening at moderate rate. Not imminent but building steadily.
No sub-squeezes active — single unified compression typically produces cleaner directional moves than divergent setups.
The critical question: which direction does this fire? Bias says bear, but OBV, bounce ratio, and leverage all lean bull. When squeeze direction contradicts accumulation evidence, the squeeze often reverses early — a bear trap where initial downward movement gets absorbed and reversed by accumulated bids sitting beneath the surface.
📐 Leverage — Absolute Floor
Current: 4.84x Normal | Percentile: 0% Bottom 💜
50b Max: 13.43x | 200b Max: 298.73x
AT Max: 298.73x (136 bars ago) | AT Min: 1.5x (4328 bars ago)
The single most bullish data point on this chart. 0th percentile means there has never been less speculative positioning in GNO's history on this timeframe. Just 136 bars ago, leverage was 298.73x — collapsed from nearly 300x to under 5x. A complete speculative washout.
Why this matters: all forced liquidations have already happened. No margin calls to cascade, no stop hunts to trigger. Any new buying doesn't have to fight through leveraged sellers. 0th percentile leverage combined with OBV inflow is one of the strongest contrarian setups available in crypto.
💎 Premium
-0.41% Backward | Z: 0.5 — futures below spot, mild bearish derivative positioning.
Yield: -454% APY (0.5σ Bull) | StdDev: 0.32% Volatile
MeanZ: -0.72σ Normal — trending slightly below mean but within normal bounds. No extreme dislocation.
🎯 Scenarios
Accumulation Breakout (45%) — 0th percentile leverage, 1.16 OBV inflow, 1x balanced bounce, and 4.86x clean F/S form a textbook accumulation signature. If the squeeze fires bullish or reverses after a bear fake, minimal resistance since all leveraged sellers have been cleared. Low clarity at 35% supports an imminent bias flip.
Bearish Resolution (30%) — Bias is Strong Bear across 74.4% with squeeze momentum pointing down. If OBV stalls and squeeze fires bearish with follow-through, the balanced ratio breaks and bears take control. Overcoming floor-level leverage and confirmed accumulation is a high bar to clear though.
Extended Compression (25%) — Clarity at 35% with no sub-squeezes means the market may continue building without resolution. The squeeze at 7 bars is relatively young. More accumulation time if the bull thesis is correct, but delays any directional payoff.
👀 Watch
1. OBV trajectory — sustained inflow above 1.0 Z confirms accumulation
2. Squeeze fire direction — the resolution defines the next trend
3. Bounce ratio — must hold above 1x for balanced thesis to stand
4. Leverage expansion — above 10x signals new speculative interest entering
5. Clarity improvement — above 50% either direction confirms commitment
6. F/S ratio — must stay below 10x to maintain clean market structure
⚠️ Risk
The bear bias is real — 74.4% of timeframes agree on downside. Trading against it requires conviction in accumulation evidence not yet confirmed by price. The squeeze could fire bearish and break the balanced structure. However, 0th percentile leverage means downside is likely limited compared to upside potential if accumulation plays out. Risk-reward favors patience — let the squeeze reveal direction before committing.
👆More analysis on my profile.
---
**Tags:** `GNOUSDT` `GNO` `cryptocurrency` `technicalanalysis` `volumeanalysis` `squeeze` `accumulation` `leverage` `OBV` `contrarian`
G
GNO mid-term TAGnosis is having positive accumulation for mid-tern bullish run, as of now long-term is still in bearish area which keeps the risk higher so you need to be cautious but positive formation on mid-term may reduce the risk and continue bullish formation. Current long-term pivot for the resistance is around $150ish area, the top of this channel has to be broken and hold as a support for the uptrend continuation in the future.
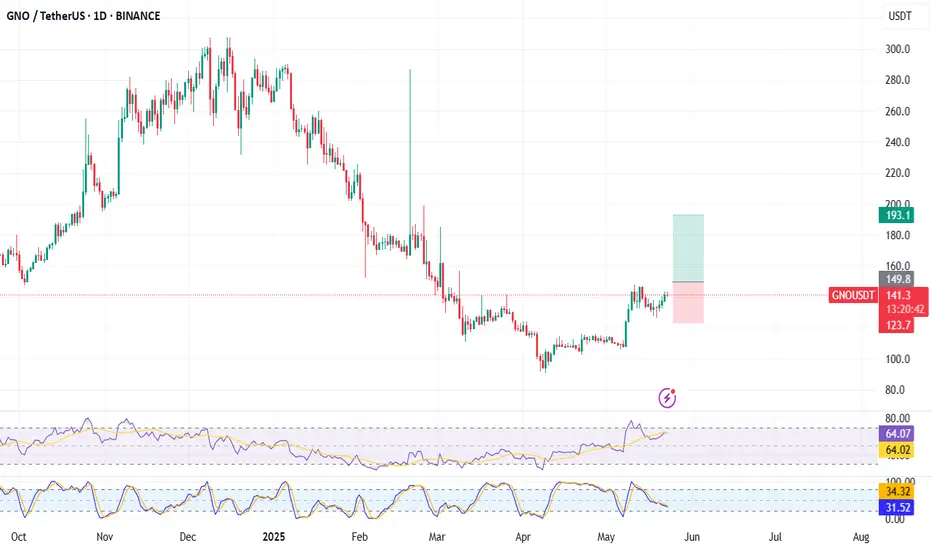
GNOUSDT 1D#GNO is moving inside an ascending triangle on the daily chart. It has bounced off the triangle support line and the daily SMA200 and is now on the verge of breaking out above the resistance zone. If that happens, the potential targets are:
🎯 $172.35
🎯 $191.60
🎯 $219.00
🎯 $253.90
⚠️ Always remember to use a tight stop-loss and follow proper risk management.
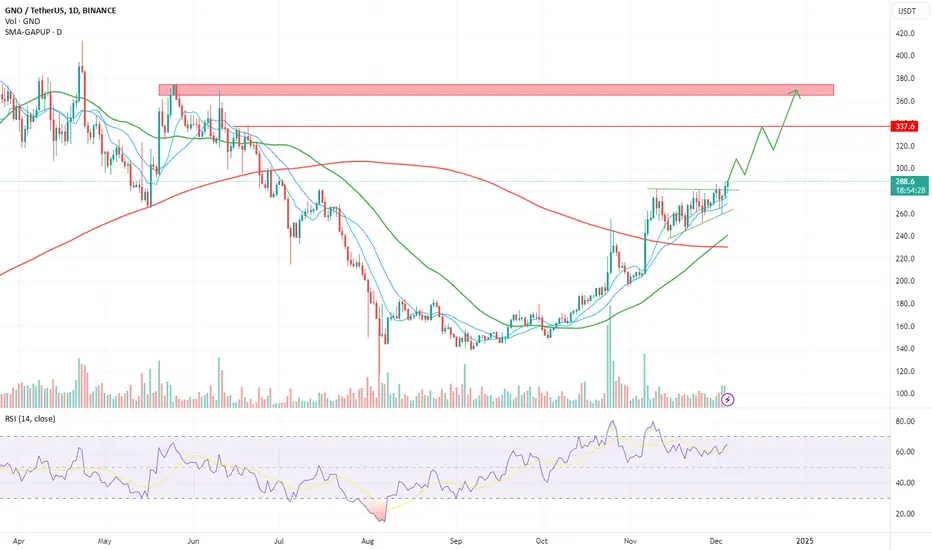
GNOUSDT Forming Bullish MomentumGNOUSDT has recently shown a strong breakout from its consolidation zone, signaling renewed bullish momentum in the market. The chart structure indicates a breakout above a key resistance level that has now turned into support, providing strength to the ongoing upward move. With volume supporting this breakout, traders are eyeing a potential rally that could deliver gains of 30% to 40%+ in the coming sessions.
This bullish setup reflects the confidence of investors who are actively accumulating at these levels. The steady increase in volume is a strong confirmation of growing market participation, which often fuels sustained rallies. If the price continues to hold above the breakout zone, GNOUSDT may enter into a new bullish wave, attracting both short-term traders and long-term investors.
Investors are closely monitoring this crypto pair as it shows resilience and momentum after a prolonged accumulation phase. With clear breakout signals and improving sentiment, the upside potential remains strong, and the path towards higher levels seems more achievable. This makes GNOUSDT a pair worth watching for potential opportunities in the days ahead.
✅ Show your support by hitting the like button and
✅ Leaving a comment below! (What is You opinion about this Coin)
Your feedback and engagement keep me inspired to share more insightful market analysis with you!
#GNOUSDT remains weak after a strong drop📉 SHORT BYBIT:GNOUSDT.P from $181.40
🛡 Stop Loss: $186.50
⏱ 1H Timeframe
✅ Overview:
➡️ BYBIT:GNOUSDT.P experienced a sharp rally above $210, followed by an equally strong pullback.
➡️ The POC (Point of Control) at $187.27 indicates the highest liquidity area, which serves as a strong resistance level.
➡️ Price is consolidating below $183.12, signaling potential seller dominance.
➡️ If $178.55 breaks downward, further decline toward $175.30 is expected.
⚡ Plan:
➡️ Enter short upon a confirmed break below $181.50.
➡️ Stop-Loss placed at $186.50, above the resistance zone.
🎯 TP Targets:
💎 Take Profit1- 178.55
🔥 Take Profit2- 175.30
🚀 BYBIT:GNOUSDT.P remains weak after a strong drop—expect further downside.
GShort
GNO short Channel 170 - 181 The instrument is above 170, so I'm considering going long because the instrument is gaining ground. But if it goes below 170, I'll consider going short to 150.
G
GNOUSDT: %200 DAILY VOLUME SPIKE | HUGE OPPORTUNITYGNOUSDT has experienced a 195% increase in trading volume.
To evaluate this surge, I will:
Monitor the price movement toward the blue boxes indicated on the chart.
Focus on upward breakouts in lower time frames from these areas to identify potential opportunities.
This approach ensures precision and aligns with risk management practices. As always, careful evaluation is essential.
Let me know if you'd like further refinements!
I keep my charts clean and simple because I believe clarity leads to better decisions.
My approach is built on years of experience and a solid track record. I don’t claim to know it all, but I’m confident in my ability to spot high-probability setups.
My Previous Analysis
🐶 DOGEUSDT.P: Next Move
🎨 RENDERUSDT.P: Opportunity of the Month
💎 ETHUSDT.P: Where to Retrace
🟢 BNBUSDT.P: Potential Surge
📊 BTC Dominance: Reaction Zone
🌊 WAVESUSDT.P: Demand Zone Potential
🟣 UNIUSDT.P: Long-Term Trade
🔵 XRPUSDT.P: Entry Zones
🔗 LINKUSDT.P: Follow The River
📈 BTCUSDT.P: Two Key Demand Zones
🟩 POLUSDT: Bullish Momentum
🌟 PENDLEUSDT.P: Where Opportunity Meets Precision
🔥 BTCUSDT.P: Liquidation of Highly Leveraged Longs
🌊 SOLUSDT.P: SOL's Dip - Your Opportunity
🐸 1000PEPEUSDT.P: Prime Bounce Zone Unlocked
🚀 ETHUSDT.P: Set to Explode - Don't Miss This Game Changer
🤖 IQUSDT: Smart Plan
⚡️ PONDUSDT: A Trade Not Taken Is Better Than a Losing One
💼 STMXUSDT: 2 Buying Areas
🐢 TURBOUSDT: Buy Zones and Buyer Presence
🌍 ICPUSDT.P: Massive Upside Potential | Check the Trade Update For Seeing Results
🟠 IDEXUSDT: Spot Buy Area | %26 Profit if You Trade with MSB
Trade Signal for GNOUSDT: Buy OpportunityAttention traders! A new trade signal has been identified for GNOUSDT, and it's time to make a strategic move. Here's a detailed overview of the trading opportunity detected using the EASY Quantum Ai strategy.
Direction: Buy
Enter Price: 167.5
Take Profit: 169.2
Stop Loss: 164.9
Analysis and Justification:
The forecast for this movement is based on a comprehensive analysis of recent market trends and indicators. Our strategy, EASY Quantum Ai, suggests a bullish momentum for GNOUSDT, driven by the convergence of several factors:
1. Technical Analysis: The pair has shown strong support at the 167.5 level, indicating a potential bounce back upwards. Recent candlestick patterns also signal a bullish reversal.
2. Market Sentiment: Increased trading volume in the last 24 hours suggests growing investor interest and positive sentiment towards GNO.
3. MACD and RSI Indications: Both indicators have recently shifted out of their oversold zones, suggesting bullish potential.
3. Global Economic Factors: Favorable news impacting the crypto market landscape may propel GNO upwards, making this a timely entry for investors.
Traders should take note of this opportunity and consider entering a buy position at the specified entry price. Remember to monitor the market conditions actively and adjust the stop loss and take profit levels if necessary. Happy trading!
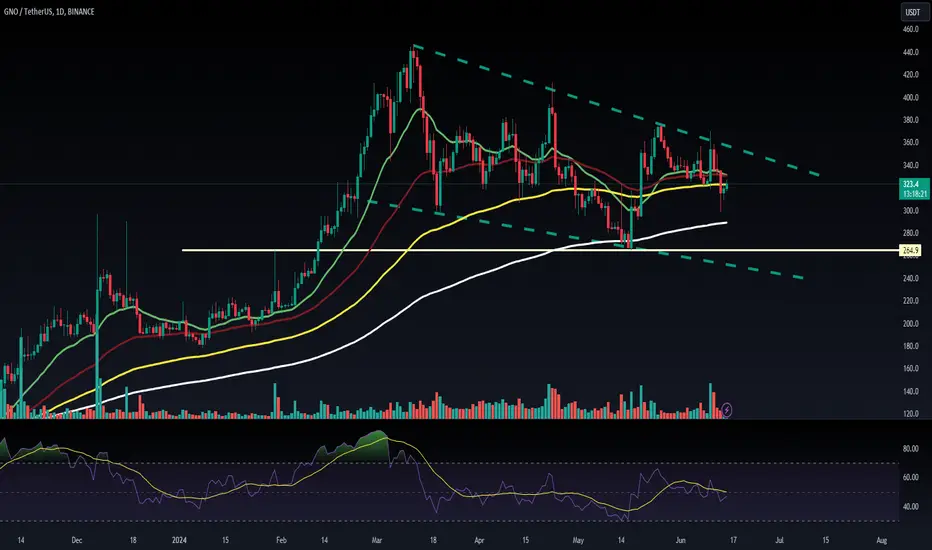
GNOUSDT | Ready for Another Push Higher?Market Context
GNOUSDT has been on a roll with a significant push higher recently, and the momentum suggests we’re not done yet!
Strategy: Buy the Dip
To capitalize on this bullish trend, here’s our buy-the-dip strategy with precise limit orders:
LIMIT Order 1: 353.93 | TP: 389.45
LIMIT Order 2: 341.12 | TP: 352.96
LIMIT Order 3: 329.60 | TP: 340.70
Excitement Ahead
With these setups, we're positioned to ride the next wave up. This could be a thrilling ride, so buckle up and stay tuned!
GLong
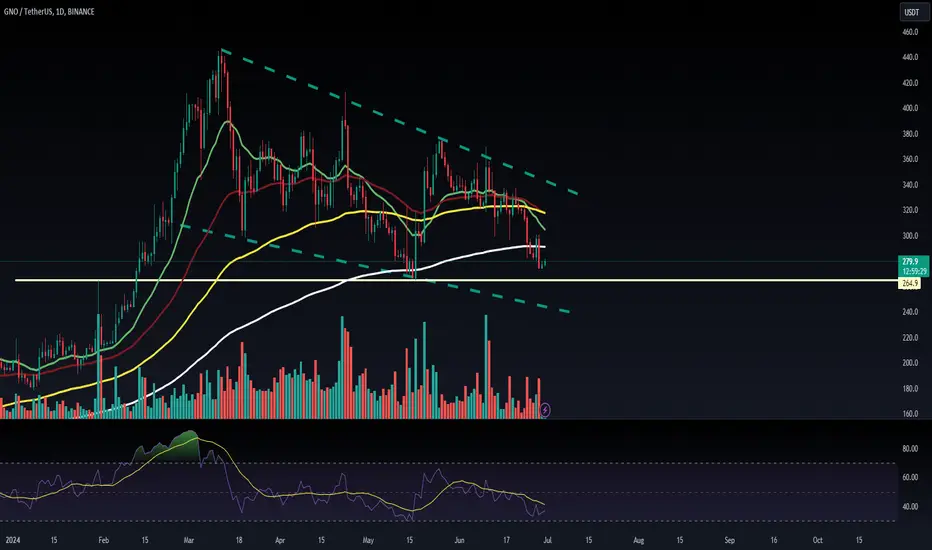
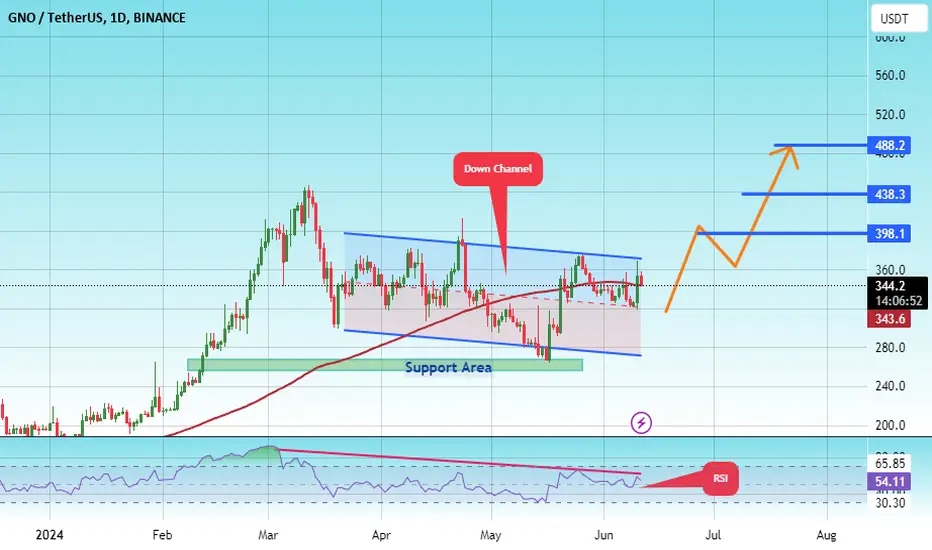
#GNO/USDT#GNO
The price is moving within a 1-day bearish channel pattern, which is a retracement pattern
We have a bounce from a green support area at 265.00
We have a tendency to stabilize above the Moving Average 100
We have a downtrend on the RSI indicator that supports the rise and gives greater momentum and the price is based on it
Entry price is 344.00
The first target is 398.10
The second goal is 438.30
The third goal is 488.20
GNOUSDT | Ready to Move Lower?Market Context
GNOUSDT recently saw a significant spike in volume, but we couldn't establish a new high on the daily chart. Now, we're consolidating within a trendline on the H4 timeframe, hinting at a possible false break.
Strategy
I’m betting on a move lower. This setup looks like it could play out quickly today, but we might see the downward momentum continue into tomorrow. It’s a thrilling moment—let’s see how this trade unfolds!
Stay tuned for updates and let’s ride this potential dip together!
GShort