GOATUSDT: Bearish Rejection Suggests Downtrend Could ContinueGOATUSDT remains under bearish control after rejecting a key resistance area and failing to sustain its recent recovery. The latest move lower reinforces the sequence of lower highs and lower lows, indicating that sellers continue to dominate the short-term trend.
Price is now trading below the rejected resistance zone, keeping downside pressure intact. As long as 0.013124 remains unbroken, the current bearish structure favours a continuation toward 0.012640. A decisive break above resistance would invalidate this setup and signal that buyers are regaining momentum.
Trade Setup
Entry: 0.013041
Target: 0.012640
Stop Loss: 0.013124
I'll remain bearish while price trades below 0.013124, targeting a move toward 0.012640. A confirmed close above the stop-loss level would invalidate this trade idea.
In-depth trading ideas
GOAT: Bullish Momentum Exhausted at MA100 ResistanceGOAT: Bullish Momentum Exhausted at MA100 Resistance – High-RR Short Opportunity at Pattern Boundary
Goatseus Maximus (GOAT) is approaching the final stage of its tightening consolidation structure, issuing clear technical signals of underlying weakness. Observing the price behavior within the current framework, buying interest appears completely exhausted after three consecutive failures at the dynamic MA100 trendline resistance: an initial short-lived breakout that quickly reversed below, a second fakebreak with a swift rejection, and a most recent touch that immediately triggered a sharp downward reaction.
Based on the visual data from the daily chart , the price action is currently hovering right against the upper boundary of the consolidation pattern. The progressive decay in bullish momentum across each MA100 retest confirms that sellers maintain total structural control around this level. The convergence of heavy overhead supply sets the stage for a continuation wave aligned with the primary trend.
This technical setup delivers an exceptionally attractive Short execution opportunity. Initiating sell orders near the upper pattern trendline allows for an optimized, tight stop-loss placement just above resistance while targeting lower pattern support. Should selling pressure prove strong enough to decisively crack the $0.010 psychological round-number support baseline, this trade setup can yield an explosive risk-to-reward ratio of at least 7–8R.
Disclaimer: This is not financial advice, DYOR.
GOATUSDT - OUTLOOKPrice has successfully flipped a key support level and broken above the trendline, signaling a clear shift in structure. Holding above these levels reflects strong buyer control and growing momentum.
With the structure now turning bullish, further upside continuation looks likely from here.
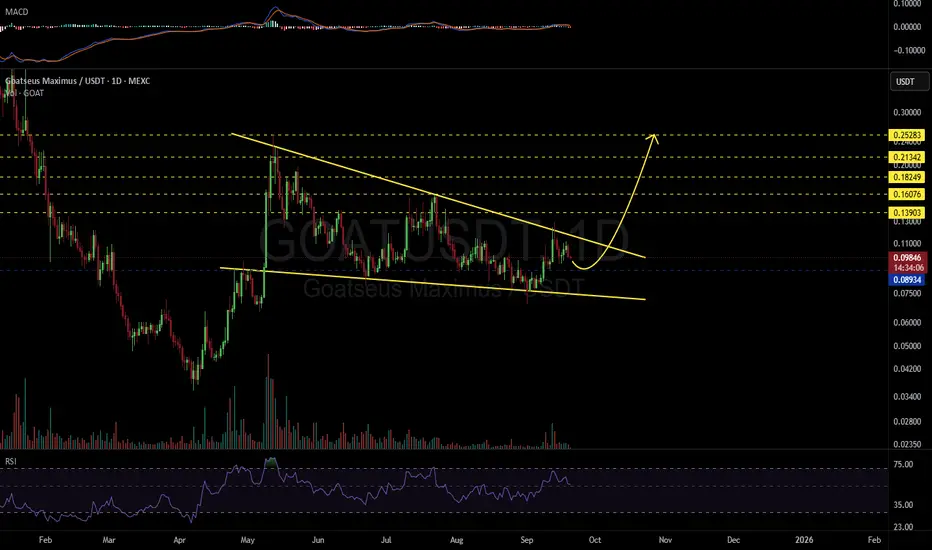
GOAT/USDT Descending Channel — Breakout or Further Correction?The GOAT/USDT chart on the 1D timeframe is clearly forming a Descending Channel, characterized by:
Consistent Lower Highs (LH) along the red resistance line
Continuous Lower Lows (LL) along the yellow support line
Price moving neatly within the channel, indicating a well-structured bearish trend
This channel reflects dominant selling pressure, but also opens the possibility for a reversal if a valid breakout occurs.
---
📉 Current Condition
Price is currently in the mid–lower area of the channel
A small consolidation (base formation) is forming around 0.017 – 0.018
The dynamic resistance (red line) remains the key barrier
The lower channel support (yellow) acts as a critical demand zone
---
🚀 Bullish Scenario
A bullish move is likely if:
1. Price breaks out above the upper channel (red line) with a strong candle close
2. Volume increases to confirm the breakout
3. A successful retest holds as new support
Upside targets:
0.02020 (initial resistance)
0.02500
0.03100
0.04300 (major resistance)
A breakout from this channel could shift the structure from bearish → sideways → bullish reversal.
---
🔻 Bearish Scenario
Bearish continuation remains likely if:
1. Price fails to break the channel resistance
2. Strong rejection occurs at the red resistance line
3. Breakdown below minor support
Downside targets:
0.01450 (near support)
0.01372 (previous low)
Potential continuation following the channel downward
As long as price remains inside the channel, the primary trend stays bearish.
---
⚠️ Conclusion
GOAT/USDT is still under bearish pressure but is beginning to show signs of accumulation at the bottom of the channel. The current area is a crucial zone that will determine whether price continues downward or begins a reversal.
👉 Key level to watch: Breakout or rejection at the upper channel
#GOATUSDT #CryptoAnalysis #TechnicalAnalysis #DescendingChannel #BearishTrend #BullishSetup #Altcoin #BreakoutWatch #CryptoTrading
A buying opportunity in GOAT (4H)A significant long wick was formed during the recent market crash on the GOAT chart. Notably, this type of liquidation wick appeared across most altcoins, signaling broad market-wide volatility and aggressive downside liquidity grabs.
At the moment, price is trading below that long wick and has not yet pulled back to retest the low of the wick. This leaves an imbalance that could potentially be revisited.
With the formation of a Swing Low (SWL) followed by a Change of Character (CH), there are early signs that buyers may be stepping in. The current structure suggests that bulls could attempt a pullback toward the red line, which marks the base of the long wick.
Additionally, there is a visible liquidity pool resting above the current price action. It is highly likely that this liquidity will be swept in the near term before any major continuation move.
We have identified two entry zones where positions can be built using a DCA (Dollar-Cost Averaging) approach. Risk should be managed carefully according to position sizing rules.
Targets are clearly marked on the chart. Upon reaching the first target, consider moving your stop loss to breakeven and securing partial profits to reduce exposure.
A daily candle close below the invalidation level will invalidate this analysis entirely.
Trade with discipline and proper risk management.
If you have a coin or altcoin you want analyzed, first hit the like button and then comment its name so I can review it for you.
This is not a trade setup, as it has no precise stop-loss, stop, or target. I do not publish my trade setups here
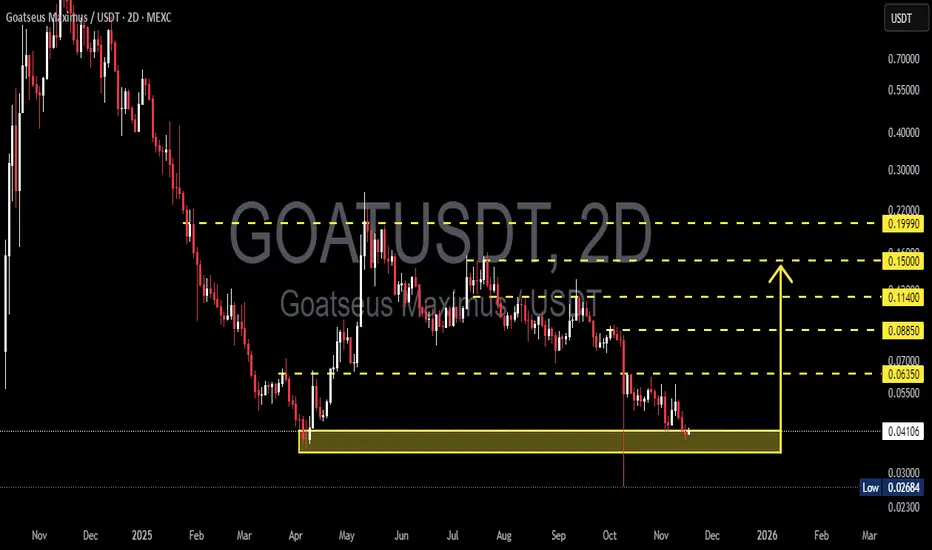
GOAT/USDT — Critical Decision Zone: Major Reversal or Breakdown?GOAT is now sitting at the most critical level since its earlier distribution phase: the price has returned to retest the Primary Structural Base at 0.041–0.035, a zone that previously triggered a major bullish expansion.
This area is not just support — it is the battleground that decides the next macro direction.
The entire downtrend from the peak has formed a consistent descending wave structure, yet each drop into the 0.041–0.035 block has been met with aggressive buy absorption. This indicates that a large liquidity cluster sits within this zone and may act as the pivot for a significant reversal.
---
Pattern & Market Structure Overview
Price action is currently forming a low-compression pattern into the key support.
This typically ends with either:
a strong impulsive reversal, or
a high-momentum breakdown into deeper liquidity zones.
The latest 2D candle closed right above the upper boundary (0.041), showing buyers are still defending — but the momentum remains fragile.
Overhead resistance levels (0.0635 → 0.0885 → 0.114 → 0.150 → 0.1999) form a clean ladder of recovery targets if a bounce is confirmed.
---
Bullish Scenario — “Major Accumulation Rebound”
This scenario activates if:
1. Price holds and rebounds strongly from 0.041–0.035.
2. A clean 2D close above 0.0635 appears — this zone is the Bullish Trigger.
Once confirmed, the market shifts from a downtrend into a recovery structure, with step targets:
0.0635 → Reversal validation
0.0885 → Momentum expansion
0.114–0.150 → Mid-range trend shift
0.1999 → Major structural retest
From the support zone to the upper targets, the upside potential can reach +300%, but only with full bullish confirmation.
---
Bearish Scenario — “Liquidity Flush Breakdown”
A strong breakdown below 0.035 signals buyer exhaustion.
If that occurs:
Price will likely drop quickly into 0.02684 (previous liquidity wick).
If 0.02684 fails, the chart may enter a capitulation phase, opening the path toward the low 0.02 region.
This would confirm the continuation of the primary downtrend.
---
Core Conclusion
GOAT is positioned inside a macro decision zone.
The 0.041–0.035 range determines whether we see:
the end of the prolonged bearish cycle and the beginning of a major reversal, or
the start of a deeper capitulation leg, as the market hunts lower liquidity.
This makes the zone both the highest-reward entry area and the highest-risk failure point.
#GOATUSDT #GOAT #CryptoAnalysis #PriceAction #SupportZone #Breakout #BullishScenario #BearishScenario #CryptoTA #TechnicalAnalysis
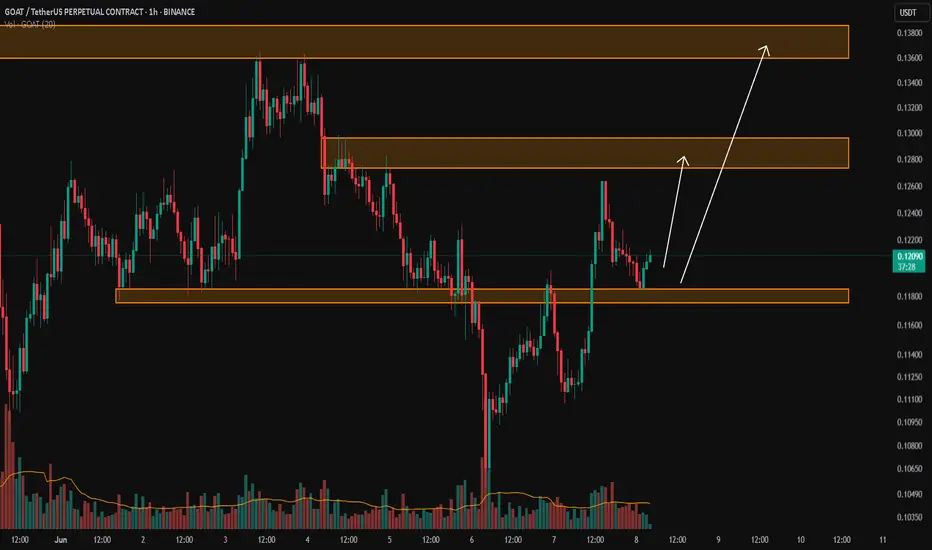
GOAT LONGHello friends 💖
It seems that the GOAT-USDT cryptocurrency has taken a very good bullish guard and can move up to the orange targets
I seriously suggest you keep this cryptocurrency on your watchlist 🔥
To support me, I would appreciate it if you boost the analysis and share it with your friends so that I can analyze it with more energy for you, my dears. Thank you all. 💖
GOATUSDT: 1000%+ Potential!GOAT has seen extreme volatility over the past year. After a massive 97% drop from the peak, the price staged a strong recovery of over 570% from the bottom. Now, the chart is showing a bullish continuation wedge formation, suggesting momentum may be shifting again.
Key Highlights
Structure: Price consolidating inside a bullish wedge pattern.
Volume Profile: Recent move broke through a key resistance zone, showing buyers stepping in.
Moving Averages: Price reclaiming EMAs will act as dynamic support.
Upside Potential: Technical projection points to a strong continuation move if the wedge breakout confirms.
📈 Trading Plan
Entry Zone: Above $0.11.
Target (TP): 300%- 1000%
Stop-Loss (SL): Below $0.074 support
Cheers
Hexa
Goatseus Maximus Hooves the Dust. Ready to Buck Up Soon!Goatseus Maximus looks like an entry win here. Check out that long accumulation period. Bullish, or should I say, "GOATish"? Additionally, I have a signal to buy from my proprietary indicator. I will be a bit more aggressive on this one with a 1:4 rrr, targeting around .16 cents and stopping out at around .07. On this one, I may sell half a little earlier. Once we reach that ascending trendline, I will be watching price action closely. Keep an eye on my trade tracker for more.
GOATUSDT Retest at Key Demand Zone – Accumulation or Breakdown?🔍 Comprehensive Technical Analysis
After experiencing a prolonged downtrend since late 2024, GOATUSDT finally broke out of a long-term descending trendline in early May 2025 — a potential early signal of a medium-term trend reversal. However, the price has now pulled back, retesting a major support zone that coincides with the previous breakout structure.
---
🧱 Key Zone: Demand Area + Trendline Retest
Price is currently trading within a crucial demand zone between $0.090 – $0.100, which previously acted as a major resistance and now serves as support. This area is technically significant due to:
Confluence of horizontal support and the retest of the descending trendline.
A previous accumulation zone that led to a breakout.
Clear historical buyer reaction from this region.
---
📐 Price Structure & Pattern
Descending Triangle Breakout: Successfully broken to the upside in May.
Support-turned-Resistance-turned-Support: A classic structure flip.
Horizontal Consolidation: Price is ranging in a narrow zone, indicating either accumulation or distribution.
---
🐂 Bullish Scenario (Potential Rebound):
If the price holds and bounces with increased volume from the $0.090 – $0.100 zone, it could confirm a strong accumulation phase and initiate the next leg up.
🎯 Bullish targets:
1. $0.15745 — Minor resistance
2. $0.21071 — Psychological and technical resistance
3. $0.24889 — Fibonacci extension level
4. $0.41017 — Mid-term breakout target
> Bullish confirmation: Bullish engulfing or hammer candle with high volume from the demand zone.
---
🐻 Bearish Scenario (Breakdown Risk):
If the price breaks below $0.093 and closes with strong bearish volume, this may confirm weakness and trigger a deeper correction.
📉 Downside targets:
$0.06500 — Minor historical support
$0.04900 — Previous base level
$0.03550 — All-time low (critical support)
> Bearish confirmation: Clean breakdown followed by a failed retest back into the range.
---
📊 Strategic Summary:
GOATUSDT is currently at a pivotal decision point. The zone between $0.093–$0.100 acts as a battleground for bulls and bears. A bounce could signal accumulation and a bullish reversal, while a breakdown could lead to continuation of the bearish trend.
🎯 Key focus: Price action and volume reaction at the demand zone.
---
🧲 Bullish Narrative Catalysts:
Renewed interest in low-cap altcoins
Gradual increase in volume since the breakout
Selling pressure weakening near key support
#GOATUSDT #CryptoBreakout #TrendlineRetest #TechnicalAnalysis #AltcoinAnalysis
#DemandZone #SmartMoneyConcepts #BreakoutOrFakeout
GOAT / USDT : Watch closely for a breakdownGOAT/USDT - Watch Closely!
Currently testing the critical support trend line.
Bullish Scenario: If it holds here and bounces, we could see a potential upward move.
Bearish Scenario: A breakdown below this support would confirm further downside, and I'd be leaning bearish in that case.
Pro Tip: Wait for confirmation before entering – either a strong rejection off support for bullish entry or a clean break for a bearish setup.
Stay alert and trade wisely!
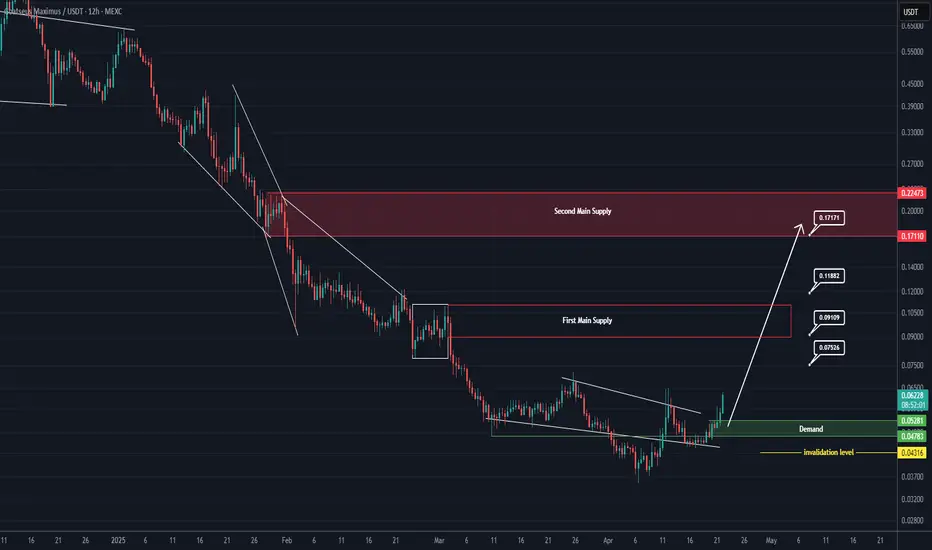
GOAT Looks Bullish (12H)It seems that a wave A of a higher-degree structure has completed, and the price is forming a triangle at the bottom, preparing for an upward movement in the form of either a wave B or a new impulse wave. Since this wave belongs to a higher degree, we expect the upcoming bullish wave to take time and show a significant upward retracement.
Try to avoid entering during pumps, and instead focus on entries during price corrections.
As long as the green zone holds, the price has the potential to move upward.
A daily candle closing below the invalidation level will invalidate this outlook.
For risk management, please don't forget stop loss and capital management
When we reach the first target, save some profit and then change the stop to entry
Comment if you have any questions
Thank You
GOATUSDT Breakout Retest: Ready for the Next Bullish Leg?The daily chart of GOATUSDT reveals a significant technical development as price breaks out of a long-term descending trendline and is now performing a crucial retest of a key support zone. This movement is attracting attention from swing traders and mid-term investors alike.
---
🔍 Pattern Analysis & Market Structure
Main Pattern: Breakout from a long-standing descending trendline (yellow line) that has capped price action since November 2024.
Key Consolidation Zone: A visible accumulation area (yellow box) between 0.10914 (Fib 0.618) and 0.11864 (Fib 0.5), now being retested as new support.
Fibonacci Retracement: Applied from the peak to the bottom to identify logical target zones and potential resistance.
Breakout Confirmation: Price cleanly broke above the trendline, pulled back to retest support, and is showing signs of holding — a potential bullish continuation signal.
---
🟢 Bullish Scenario
If price holds above the 0.11–0.12 zone:
The breakout is validated and opens room for a continued rally.
Key upside targets based on Fibonacci levels:
🔼 0.15745 – first resistance
🔼 0.21071 to 0.24889 – mid-range resistance cluster
🔼 0.41017 to 0.86054 – longer-term price targets
Bullish confirmation via price action or volume spikes can solidify this outlook.
---
🔴 Bearish Scenario
If price fails to hold the support zone:
A breakdown below 0.10914 invalidates the breakout, indicating a false breakout trap.
Downside targets may include:
0.09000 – local support
0.06500 and 0.03550 – major historical support zones
This scenario would likely reignite bearish momentum.
---
⚠️ Conclusion
GOATUSDT is currently at a critical technical crossroad. The recent breakout and retest could signify a structural trend reversal. If the current support holds, the potential for upside is significant. However, a failure here could lead to deeper correction or consolidation.
---
📌 Key Levels to Watch:
Support: 0.109 – 0.118
Resistance: 0.15745 / 0.21071 / 0.24889 / 0.41017
#GOATUSDT #CryptoBreakout #TechnicalAnalysis #AltcoinSeason #TrendlineBreakout #SupportResistance #FibonacciLevels #SwingTrade #PriceAction #CryptoTA
IS it a time for GOATUSDT? 100% potential profit TP - 0.24 $After an extended downtrend, the 4-hour chart of Goatseus Maximus (GMAX) / USDT is showing signs of stabilization and a potential trend reversal. The price has found support in the $0.11–$0.12 range, where accumulation appears to be taking place — characterized by higher lows and an early structure of upward movement.
The WaveTrend (WT_LB) indicator is currently in the oversold zone and beginning to turn upward. This behavior often suggests that selling pressure is weakening and the market may be preparing for a bullish move. A green cross on this indicator can be interpreted as an early buy signal.
Additionally, the moving averages (MA 10, 30, 60, and 120) are starting to flatten out, indicating a potential transition out of the previous downtrend. If the price can break and hold above these averages, it may trigger increased buying interest and momentum.
From a technical standpoint, the $0.14 level remains a key short-term resistance. A successful breakout above this level could open the way for a move toward $0.18, followed by a potential run-up to $0.24, which previously acted as a significant resistance zone and rejection point.
In summary, the current technical setup suggests that if bullish momentum continues and key resistance levels are broken, a move toward $0.24 is achievable in the mid-term.
Potential TP: 0.24 USD
GOATUSDT 1D#GOAT is currently retesting the broken descending trendline along with the daily SMA50, both aligning with the key support zone marked on the chart — and so far, it's holding well.
📌 In case of a successful bounce from this zone, the potential upside targets are:
🎯 $0.16803
🎯 $0.20650
🎯 $0.25008
🎯 $0.31640
🎯 $0.38272
🎯 $0.47713
🎯 $0.59740
⚠️ As always, use a tight stop-loss and practice proper risk management.
GOAT/USDT - LOCAL TOPholding strong above the 0.11 price zone, showing signs of re-accumulation between 0.11 – 0.133. The bullish market structure remains intact, with buyers defending key support and gradually pushing price upward.
This consolidation phase suggests that GOAT is gearing up for a move back toward the previous local top and potentially higher.
GOAT/USDTKey Level Zone: 0.11750 - 0.11850
LMT v1.0 detected.
The setup looks promising—price previously trended upward with rising volume and momentum, then retested this zone cleanly. This presents an excellent reward-to-risk opportunity if momentum continues to align.
Introducing LMT (Levels & Momentum Trading)
- Over the past 3 years, I’ve refined my approach to focus more sharply on the single most important element in any trade: the KEY LEVEL.
- While HMT (High Momentum Trading) served me well—combining trend, momentum, volume, and structure across multiple timeframes—I realized that consistently identifying and respecting these critical price zones is what truly separates good trades from great ones.
- That insight led to the evolution of HMT into LMT – Levels & Momentum Trading.
Why the Change? (From HMT to LMT)
Switching from High Momentum Trading (HMT) to Levels & Momentum Trading (LMT) improves precision, risk control, and confidence by:
- Clearer Entries & Stops: Defined key levels make it easier to plan entries, stop-losses, and position sizing—no more guesswork.
- Better Signal Quality: Momentum is now always checked against a support or resistance zone—if it aligns, it's a stronger setup.
- Improved Reward-to-Risk: All trades are anchored to key levels, making it easier to calculate and manage risk effectively.
- Stronger Confidence: With clear invalidation points beyond key levels, it's easier to trust the plan and stay disciplined—even in tough markets.
Whenever I share a signal, it’s because:
- A high‐probability key level has been identified on a higher timeframe.
- Lower‐timeframe momentum, market structure and volume suggest continuation or reversal is imminent.
- The reward‐to‐risk (based on that key level) meets my criteria for a disciplined entry.
***Please note that conducting a comprehensive analysis on a single timeframe chart can be quite challenging and sometimes confusing. I appreciate your understanding of the effort involved.
Important Note: The Role of Key Levels
- Holding a key level zone: If price respects the key level zone, momentum often carries the trend in the expected direction. That’s when we look to enter, with stop-loss placed just beyond the zone with some buffer.
- Breaking a key level zone: A definitive break signals a potential stop‐out for trend traders. For reversal traders, it’s a cue to consider switching direction—price often retests broken zones as new support or resistance.
My Trading Rules (Unchanged)
Risk Management
- Maximum risk per trade: 2.5%
- Leverage: 5x
Exit Strategy / Profit Taking
- Sell at least 70% on the 3rd wave up (LTF Wave 5).
- Typically sell 50% during a high‐volume spike.
- Move stop‐loss to breakeven once the trade achieves a 1.5:1 R:R.
- Exit at breakeven if momentum fades or divergence appears.
The market is highly dynamic and constantly changing. LMT signals and target profit (TP) levels are based on the current price and movement, but market conditions can shift instantly, so it is crucial to remain adaptable and follow the market's movement.
If you find this signal/analysis meaningful, kindly like and share it.
Thank you for your support~
Sharing this with love!
From HMT to LMT: A Brief Version History
HM Signal :
Date: 17/08/2023
- Early concept identifying high momentum pullbacks within strong uptrends
- Triggered after a prior wave up with rising volume and momentum
- Focused on healthy retracements into support for optimal reward-to-risk setups
HMT v1.0:
Date: 18/10/2024
- Initial release of the High Momentum Trading framework
- Combined multi-timeframe trend, volume, and momentum analysis.
- Focused on identifying strong trending moves high momentum
HMT v2.0:
Date: 17/12/2024
- Major update to the Momentum indicator
- Reduced false signals from inaccurate momentum detection
- New screener with improved accuracy and fewer signals
HMT v3.0:
Date: 23/12/2024
- Added liquidity factor to enhance trend continuation
- Improved potential for momentum-based plays
- Increased winning probability by reducing entries during peaks
HMT v3.1:
Date: 31/12/2024
- Enhanced entry confirmation for improved reward-to-risk ratios
HMT v4.0:
Date: 05/01/2025
- Incorporated buying and selling pressure in lower timeframes to enhance the probability of trending moves while optimizing entry timing and scaling
HMT v4.1:
Date: 06/01/2025
- Enhanced take-profit (TP) target by incorporating market structure analysis
HMT v5 :
Date: 23/01/2025
- Refined wave analysis for trending conditions
- Incorporated lower timeframe (LTF) momentum to strengthen trend reliability
- Re-aligned and re-balanced entry conditions for improved accuracy
HMT v6 :
Date : 15/02/2025
- Integrated strong accumulation activity into in-depth wave analysis
HMT v7 :
Date : 20/03/2025
- Refined wave analysis along with accumulation and market sentiment
HMT v8 :
Date : 16/04/2025
- Fully restructured strategy logic
HMT v8.1 :
Date : 18/04/2025
- Refined Take Profit (TP) logic to be more conservative for improved win consistency
LMT v1.0 :
Date : 06/06/2025
- Rebranded to emphasize key levels + momentum as the core framework