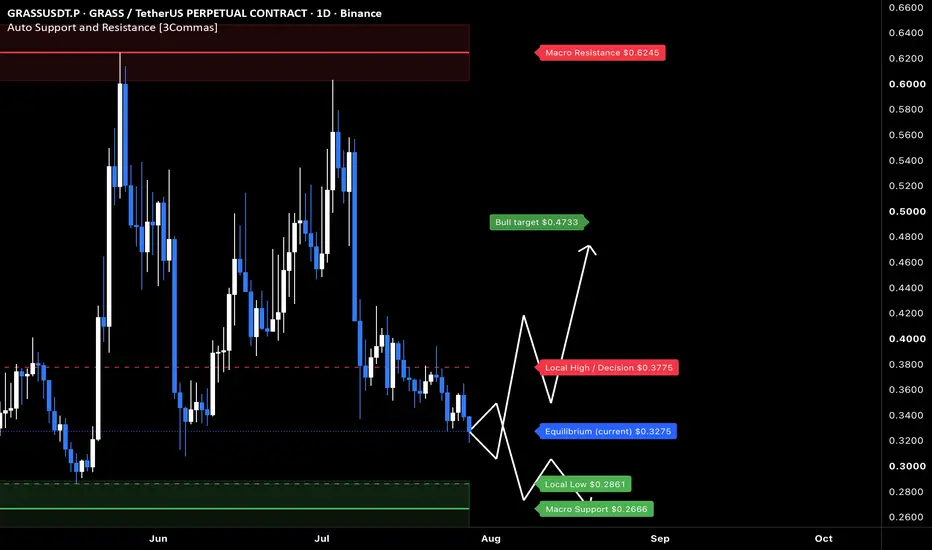
GRASS: local squeeze with $0.4731 destinationThe Macro Picture 🗺️
GRASS unwound from the $0.6245 macro ceiling into a summer range and now sits at $0.3273, holding above the $0.2861 local low. Price is coiling in the lower half of the range with the floor intact — a base rebuilding, not a breakdown.
The Setup ⚙️
The Range Floor 🟢
$0.2861 (Lo
GRASS is in the process of completing a bullish pattern (12H)From the point marked by the green arrow on the chart, GRASS appears to have entered a bullish Symmetrical pattern.
The price now seems to be in Wave H, which is expected to be a bearish wave. Once this wave is complete, a rebound in the form of Wave I is expected, followed by another strong bearis
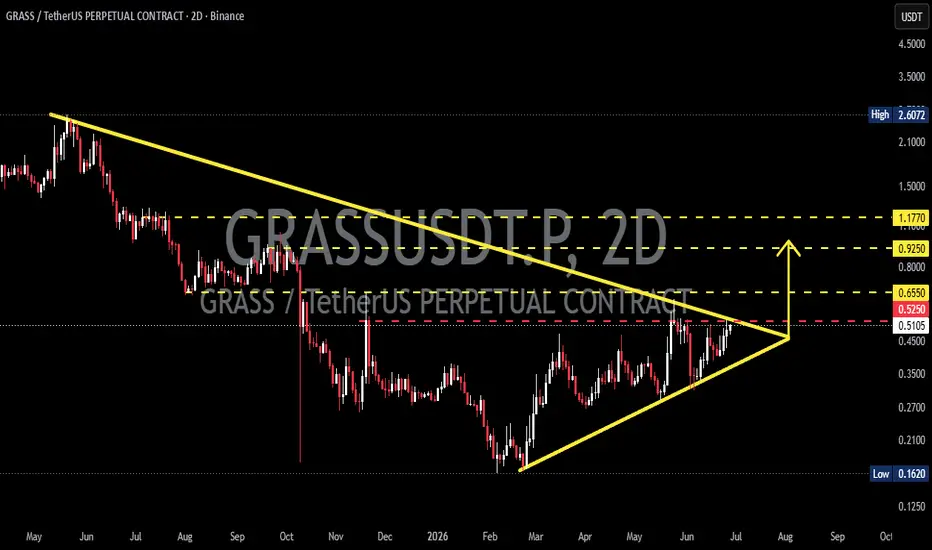
GRASSUSDT - Symmetrical Triangle, Breakout or Fakeout?On the 2-Day (2D) timeframe, GRASSUSDT is forming a Symmetrical Triangle pattern after experiencing a prolonged downtrend. The price is now approaching the apex (tip of the triangle), which is typically a critical area before a significant move occurs.
📌 This pattern indicates that buying 🟢 and sel
GRASSUSDT 8H#GRASS is moving inside a symmetrical triangle on the 8-hour timeframe chart. It is currently trading above the Ichimoku Cloud and the structure looks promising.
In case of a breakout, the potential upside targets are:
🎯 $0.4932
🎯 $0.5398
🎯 $0.5992
⚠️ Always remember to use a tight stop-loss and
GRASSUSDT Forming Bullish MomentumGRASSUSDT is forming a clear bullish momentum pattern, a classic bullish wave signal that often indicates an upcoming breakout. The price has been consolidating within a narrowing range, suggesting that selling pressure is weakening while buyers are beginning to regain control. With consistent volum
$GRASS: AI Infrastructure at a Crossroads$GRASS continues to carve out its niche as a decentralized physical infrastructure network (DePIN), enabling users to monetize unused internet bandwidth to provide structured datasets for AI model training. Its architecture, a sovereign data rollup on Solana addresses the growing demand for high-qua
GRASS/USDT Technical Analysis: Pennant Breakout ImminentHi!
Trend Shift via Volume and SMA Breakout
The macro structure for GRASS/USDT shifted dramatically following a massive influx of buying volume, noted as the "Big pump." This surge carried the price decisively above the 100-day Simple Moving Average (SMA), effectively neutralizing the previous be
See all ideas
Summarizing what the indicators are suggesting.
Oscillators
Neutral
SellBuy
Strong sellStrong buy
Strong sellSellNeutralBuyStrong buy
Oscillators
Neutral
SellBuy
Strong sellStrong buy
Strong sellSellNeutralBuyStrong buy
Summary
Neutral
SellBuy
Strong sellStrong buy
Strong sellSellNeutralBuyStrong buy
Summary
Neutral
SellBuy
Strong sellStrong buy
Strong sellSellNeutralBuyStrong buy
Summary
Neutral
SellBuy
Strong sellStrong buy
Strong sellSellNeutralBuyStrong buy
Moving Averages
Neutral
SellBuy
Strong sellStrong buy
Strong sellSellNeutralBuyStrong buy
Moving Averages
Neutral
SellBuy
Strong sellStrong buy
Strong sellSellNeutralBuyStrong buy
Displays a symbol's price movements over previous years to identify recurring trends.