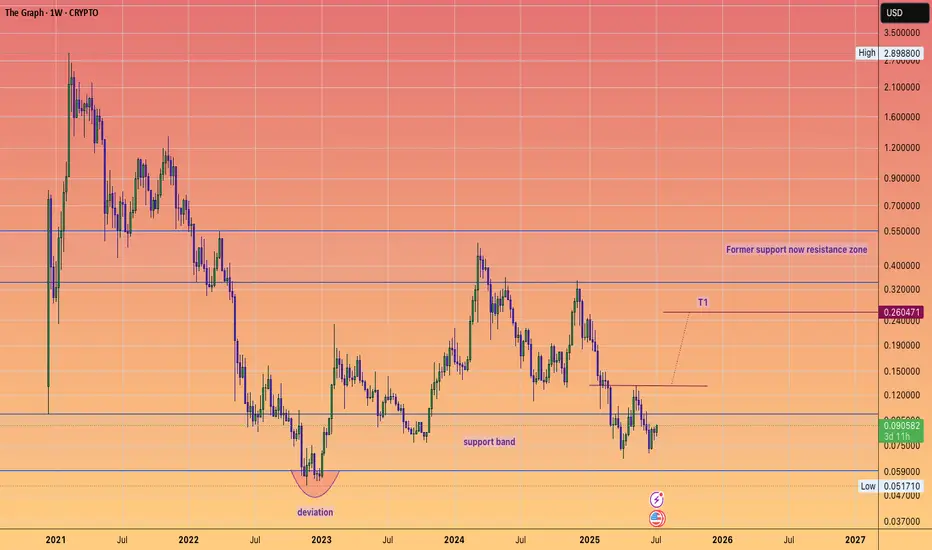
In-depth trading ideas
GRT Entire trend. Descending channel. Reversal zones. 08 2026Logarithm. 1-week time frame for visualization of the trend and channel. Key zones and support/resistance levels are shown. Another, conditional, slight decline is likely (toward dynamic channel support).
The Graph (GRT) is a fundamentally strong, but in my opinion, heavy infrastructure project. It's been called the "Google for blockchains" because it solves a critical problem in Web3: it structures and enables quick searches of data within decentralized networks.
Utility Paradox: Increase
Read NOW!!! The Graph GRT playbookThe daily chart is displaying classic bearish exhaustion. The sellers are running out of tokens to dump at these multi-month lows, while the data usage on the network continues to hum along in the background. Buying GRT at these levels is a play on the infrastructure of Web3 rather than short-term price speculation.
Look at the daily chart for GRT. We are sitting directly at the 100% Fibonacci Retracement floor ($0.01855), marking the final price extension of a massive daily Elliott Wave (C) c
GRT Final Leg of the Downtrend Before Potential AccumulationGRT continues to maintain its dominant downtrend, following a confirmed breakdown from the ascending broadening formation.
Price is now approaching the 1:1 measured-move target, which aligns with the highlighted projected drop zone, suggesting the bearish leg is nearing completion. From this demand region, the primary expectation is a strong bullish reaction, with the zone acting as a solid base for accumulation.
A sustained bounce from this level could initiate a recovery rally toward the
G
GRT Main Trend (addition) Double Bottom + Triangle 08 2025Logarithm. Time frame 1 week.
Main trend . Supplement for clarity to the previous idea for this cryptocurrency, published 23 02 2025 Everything is essentially the same, the new idea is made to visualize the trend, nothing more.
GRT Main trend.
Line chart, price now
Secondary . Big double bottom (in any case, with local scenario A or B, it will be realized in the medium term).
Local trend (price movements in the trend minimum zones before a big pump). Triangle above the Gann fan ray
GRT: Bottom fishing!I haven't looked at GRT for a while. This coin still holds a lot of potential, but not much to show for. Throughout this cycle, the price has only gone down. If the bottom has been reached is anyone's guess, but Eliott Waves technicals are pointing at an end of cycle.
The last leg might already be done, or we have wave 1 of 5 of C and price might head lower. If the low is in, or about to be in, we should see a 5 waves structure upward to complete wave 1. If price is about to hit lower, then it
How is GRT doing - $0.24 Soon?GRT is not an asset I enjoy dissecting too much these days, its current nature leaves a lot to be desired.
Bullish structures form prematurely and fail to reach their intended targets, while the bearish structures push deep, retrace wide, and even overshoot targets. Generally speaking, that’s behaviour you don’t want on your side.
But, there’s hope.
We didn’t break below the swing low, and more importantly, we finally broke the downside trend—marked out in white.
So now the question is whether
Not what I expected - GRT weekly update Aug 15 - 21thThe current chart positions GRT in Intermediate Wave C of Primary Wave 2, implying a bearish continuation within the Elliott Wave framework. However, confidence in this view is low, as the Elliott Wave count is the only factor supporting further downside. All other signals currently point in the opposite direction. Last week’s chart had the primary and alternative scenarios reversed, a shift largely driven by cross-cryptocurrency correlations and the anticipation of deeper corrections.
From a l
Three patterns - one move!GRT is sitting on triple confluence — small pennant support, Fib 0.236, and the golden pocket — inside a larger pennant, which itself sits inside a larger bullish wedge.
Apex of the micro-pennant hits Tuesday morning, with alt season still ahead. If support holds, watch for a breakout toward $0.099–0.103 and then $0.105–0.113.
Selling volume spike + break below support? Then eyes on the lower liquidity zone near $0.085–0.087.
GLong
Chasing new highs - GRT weekly update August 8 - 14thThe Graph (GRT) has formed two higher-degree 1–2 setups — one at the Cycle degree and one at the Primary degree — creating a structurally bullish foundation. At the Intermediate degree, price is currently advancing in Wave 1, while at the Minor degree, it is in Wave 3, the most dynamic phase of an impulse. This alignment of early waves across degrees suggests a potentially strong continuation if key resistance levels are broken.
The immediate bullish confirmation comes from a break above the $0.
GRT black structure continues to bring it further down...Another lower low for GRT means another trading opportunity on the table. The black targets from the overarching structure still stand tall, patiently waiting to be reached. This is exactly why we trade anti-cyclically—the possibilities are endless, and the markets just keep on giving.
Never chase. Prepare accordingly and let the market come to you. That’s how the game is played. Watch. Wait. Win.
GRT IS A GOOD ENTRY POINT 2025HELLO. What I can see is something good for this year, I'm sure of this event that is about to happen do your investigations, It's not an investment rabbit but everything I did in the CHART of 3,6,12 months my graphics are positive luck IT'S NOT INVESTMENT ADVICE IT'S YOUR DECISION