GRTUSDT: The $1.00 Macro Target — What Must Happen First?Following our previous analysis, GRT is approaching what could become one of the most significant turning points in its multi-year price structure.
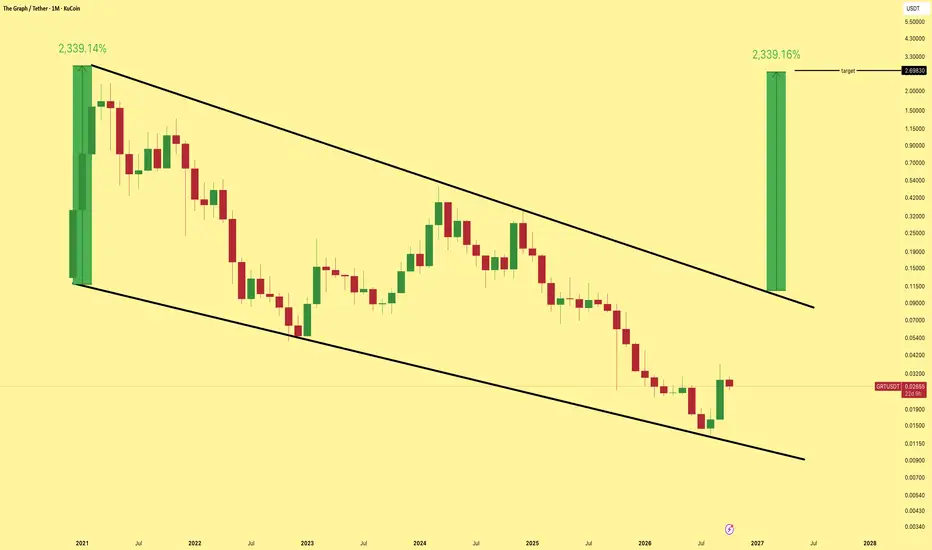
The weekly chart reveals a potential bullish harmonic formation developing within a descending broadening structure, following years of persistent selling pressure and successive lower highs.
Interestingly, price recently reacted from the lower boundary of the formation, establishing a potential reversal foundation. The emerging harmonic structure
The Graph / Tether USD
No trades
No trades
In-depth trading ideas
GRTGETTEX:GRT monthly bounced off the channel floor and the symmetry here is hard to ignore. The 2021 run from the channel bottom to the top was 2339%. Measure that exact same move from the current low and it lands at $2.70. Same channel, same math, different cycle. History does not need to be original.
#GRT 1W TF MACRO DEVIATION & EXPANSION PLAN – WATCH CLOSELY!GETTEX:GRT (The Graph/USDT) is consolidating cleanly inside the $0.02000 – $0.02800 demand base following a textbook Sell Side Liquidity (SSL) sweep below the prior Range Low.
Price is currently holding around $0.02693, establishing a high confluence higher low structure ahead of a major macro trend expansion.
Key Technical Highlights:
Demand Base Accumulation: The $0.02000 – $0.02800 green demand zone represents institutional accumulation following the liquidity sweep down to $0.01299.
Rec
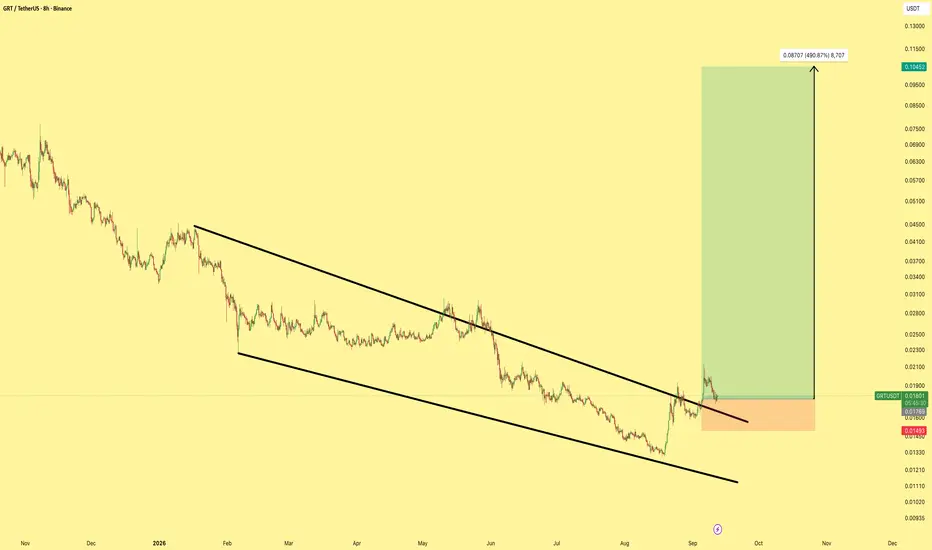
GRT Accumulation Complete? The Falling Wedge Is BreakingGRT is beginning to show one of its most interesting higher-timeframe structures in years. Price has spent a long period trending lower inside a broad falling wedge, repeatedly respecting the descending structure while forming lower highs and lower lows. The latest decline eventually pushed GRT into the $0.013–$0.030 accumulation box, directly around the lower macro boundary.
What makes the current move interesting is the falling wedge breakout attempt from this accumulation area. There is also
Will $GRT 20X Potential in Bull Season?GETTEX:GRT 180% Up From Our Accumulation Zone | 20X Upside Potential Targets
#GRT Has Perfectly Bounced From Our HTF Accumulation Zone And Is Now Up ~180% From The $0.020-$0.013 Zone.
Our Original Accumulation Zone Has Been Fully Filled.
From An SMC + ICT Perspective, The Macro Structure Has Now Shifted Aggressively Bullish.
$0.03038 Was The Key CHoCH Level, Price Broke It To The Upside, Confirming A Major HTF Structure Shift.
Current Structure:
✅ Accumulation Zone: $0.020-$0.013 Filled
✅ ~1
GRT - Descending Trendline Breakout + Key Support Zone!📊 Technical Analysis — GETTEX:GRT
⏱️ Time Frame: 4D
💰 Current Price: ± $0.02615
📐 Pattern: Descending Trendline Breakout + Accumulation/Support Zone
🟨 Key Zone: $0.02100 – $0.02550
---
📉 1. Previous Market Structure
GRT has been trading in a prolonged downtrend, characterized by a Descending TrendLine connecting a series of lower highs since the major high around $0.3488.
🔻 As long as the trendline remained unbroken, bearish pressure continued to dominate.
However, price has now broken ab
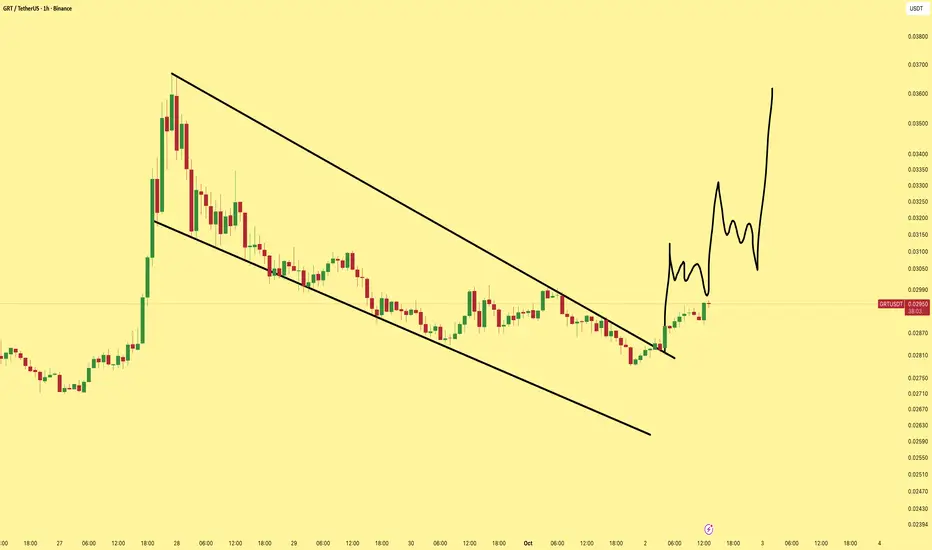
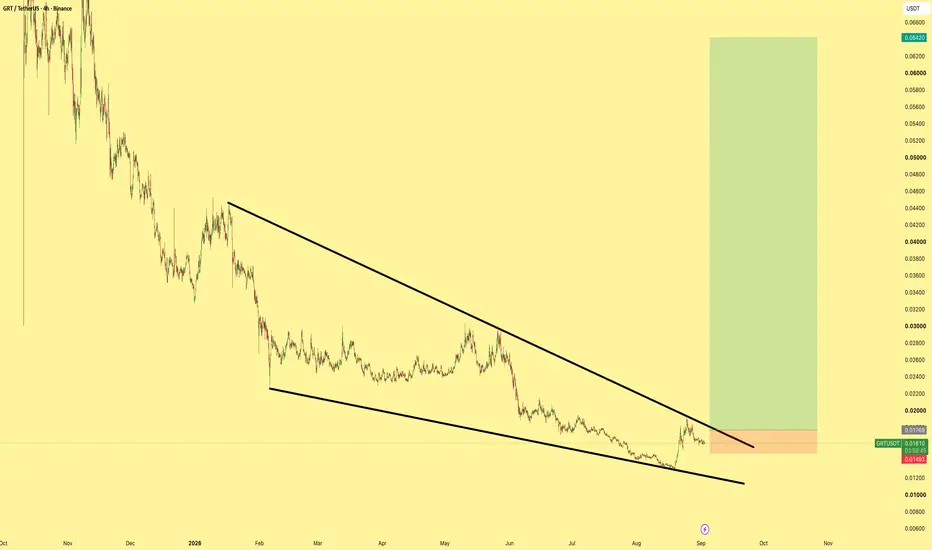
GRT/USDT (4h) Compressing Inside a Falling WedgeGRT/USDT is consolidating inside a falling wedge on the 4H chart, with price forming lower highs and lower lows while the structure continues to tighten near the apex. At the same time, Bollinger Band Width has contracted to around 3.6%, signaling unusually low volatility and increasing the probability of a stronger move once the compression resolves.
A confirmed breakout above the descending resistance around $0.0163–$0.0165 could trigger a bullish recovery toward the key $0.0179–$0.0182 resis
GRT/USDT H1: Weakness DUE to lack of catalysts🎯 TP1: $0.016272 (+1.14%) │ TP2: $0.016131 (+2.00%)
🛑 SL: $0.016759 (-1.82%) │ R/R: 1 : 1.1
⚠️ SL is placed beyond the nearest candle tails to reduce the risk of accidental triggering
FUNDAMENTAL BACKGROUND
GRT is trading without its own drivers—there is no fresh news on the project, and the token is following the broader crypto market. The main influence comes from fluctuations in BTC and ETH, which are showing increased volatility. The Fear & Greed Index in the 68–69 range supports altcoins b
GRT/USDT H4: Consolidation near the daily LOW🎯 TP1: $0.013459 (+1.27%) │ TP2: $0.013629 (+2.55%)
🛑 SL: $0.012982 (-2.32%) │ R/R: 1 : 1.1
⚠️ SL is placed beyond the nearest candle wicks to reduce the risk of accidental triggering.
FUNDAMENTAL BACKGROUND
GRT is moving without its own catalyst, following the broader crypto market. The Fear & Greed Index at 38 indicates investor caution toward altcoins. The US inflation data (CPI) released on 08/12/2026 showed a 0.1% monthly increase compared to the previous 0.4%, which did not exert signific
GRT at macro floor: base recovery toward $0.0205The Macro Picture 🗺️
GRT unwound the entire move from the $0.030 May high down to the $0.01689 macro floor, and price has stopped falling right on it. Sellers are running out of room, and the tape is flattening into a base rather than continuing to break down.
The Setup ⚙️
The Accumulation Zone 🟢
$0.01689–0.0172 is where the selling has dried up. The macro floor has held on every retest, and this is the demand shelf a recovery would build from.
The Decision Point 🔴
$0.02656 (Local High) is t
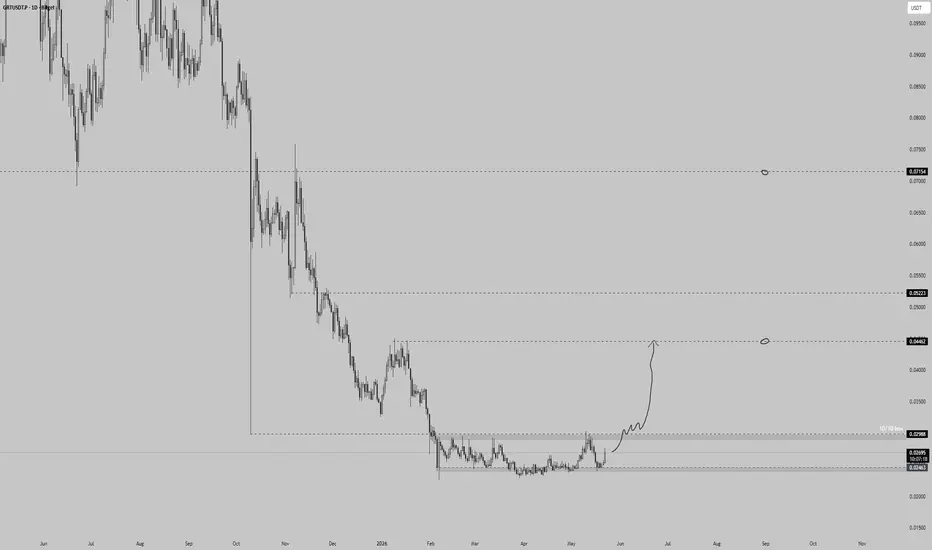
$GRT - The Invisible Infrastructure AI Can't Run Without━━━ TECHNICAL PICTURE ━━━
GRT has been one of the most brutal bear market casualties - down over -98% from its ATH of ~$2.88 all the way to a 10/10 low of ~$0.0246. The chart is now showing the first credible signs of a base:
→ Price has been grinding along the $0.024–$0.030 macro support zone - multiple touches, no breakdown
→ 10/10 low marked at $0.02988, current price $0.02699 sitting just above critical support
→ The drawn path on chart shows the anticipated move: bounce from current level
GRTGETTEX:GRT stuck inside a descending channel since December 2024 and the R/R sitting here is straight gourmet. AI narrative ripping hot, DTCC partnership lurking under the hood, and we already watched CRYPTOCAP:XLM and NYSE:CC fly. GETTEX:GRT next up in the rotation queue.
Load up while it sleeps.
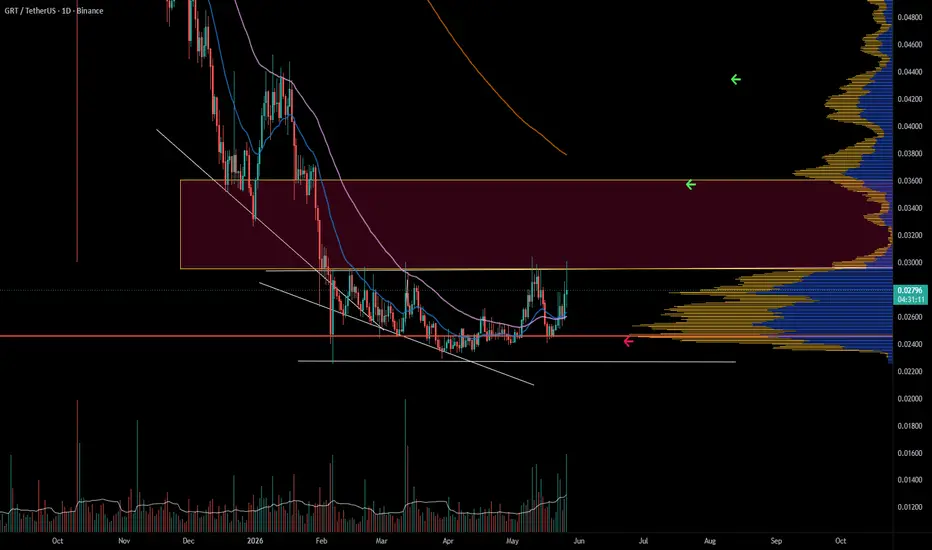
The Graph may have found its bottom but just trade what you gotGETTEX:GRT is showing early signs of a trend reversal after months of sustained selling pressure. Price has broken out of its descending structure and is beginning to establish higher lows, a key signal that buyers are regaining control.
Volume has started to increase alongside the recent move higher, adding credibility to the recovery and suggesting accumulation may be underway.
The major resistance zone overhead remains the key battleground. Bulls need a decisive break above this supply are