GRT at macro floor: base recovery toward $0.0205The Macro Picture 🗺️
GRT unwound the entire move from the $0.030 May high down to the $0.01689 macro floor, and price has stopped falling right on it. Sellers are running out of room, and the tape is flattening into a base rather than continuing to break down.
The Setup ⚙️
The Accumulation Zone 🟢
$0.01689–0.0172 is where the selling has dried up. The macro floor has held on every retest, and this is the demand shelf a recovery would build from.
The Decision Point 🔴
$0.02656 (Local High) is the level that flips the bigger structure. Before that, the first objective is the $0.0205 measured-move target — reclaiming it proves buyers are back in control.
The Roadmap 🛣️
Hold the $0.01689 floor → recover toward $0.0205 → then challenge the $0.02656 decision level. Invalidation is a clean daily close below $0.01689 — that voids the accumulation thesis.
This is a textbook DCA Accumulation Zone setup: scale in across the $0.01689–0.0172 band and let the base do the work.
More setups in profile.
#GRT #TheGraph #crypto #trading #TA #3Commas #DCA
In-depth trading ideas
$GRT - The Invisible Infrastructure AI Can't Run Without━━━ TECHNICAL PICTURE ━━━
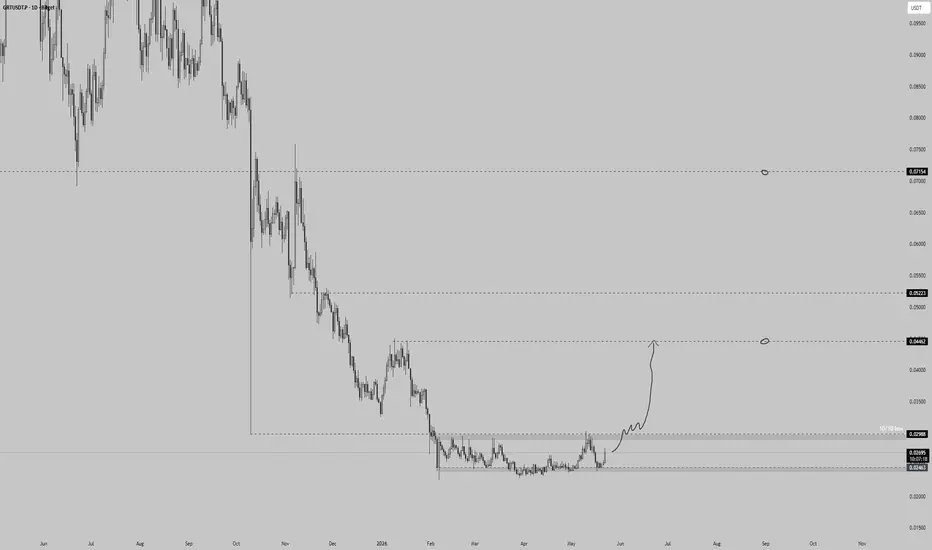
GRT has been one of the most brutal bear market casualties - down over -98% from its ATH of ~$2.88 all the way to a 10/10 low of ~$0.0246. The chart is now showing the first credible signs of a base:
→ Price has been grinding along the $0.024–$0.030 macro support zone - multiple touches, no breakdown
→ 10/10 low marked at $0.02988, current price $0.02699 sitting just above critical support
→ The drawn path on chart shows the anticipated move: bounce from current levels toward $0.04462 (first target, circled)
→ Second target: $0.07154 (major horizontal resistance, circled on chart)
→ Beyond that: $0.0900 / $0.1018 and the long road back toward ATH structure
Bull confirmation: daily close above $0.0350 with expanding volume.
Invalidation: sustained break below $0.0240.
━━━ FUNDAMENTAL CASE ━━━
GRT is the indexing layer that makes blockchain data queryable - the decentralized Google for on-chain data. And it's becoming essential infrastructure for AI:
• 40+ blockchain networks indexed
• 50,000+ active subgraphs — used by Uniswap, Aave, and enterprise clients
• DTCC (the backbone of US financial markets) uses The Graph for tokenized assets
• Grayscale allocated GRT in its AI fund (6.2% weighting)
• AI agents need structured real-time blockchain data - GRT is how they get it
• Dev activity steady - protocol upgrades shipping consistently
At $0.027, GRT trades -99% below ATH while being embedded in the infrastructure of DeFi, RWA tokenization and AI agents simultaneously.
━━━ LEVELS TO WATCH ━━━
Support: $0.0270 / $0.0240
Resistance: $0.0350 / $0.0446 / $0.0715 / $0.0900
Bull target (6–12mo): $0.0446 → $0.0715 retest
~DYOR
GRTGETTEX:GRT stuck inside a descending channel since December 2024 and the R/R sitting here is straight gourmet. AI narrative ripping hot, DTCC partnership lurking under the hood, and we already watched CRYPTOCAP:XLM and NYSE:CC fly. GETTEX:GRT next up in the rotation queue.
Load up while it sleeps.
grtusdt shortInstructions:
Entry point: yellow
Stop loss: red
Take profit: green
👉Leverage x 5-10-20 for crypto
👉Leverage x 20-50-100 for commodities, stocks, indices, and forex
👉Margin 1-5% max.
Always practice risk and money management.
Invest a maximum of 5% on any trade or across all your trades.
Invest only what you can afford to lose, as no one is in control of the market.
👉Our analyses are primarily based on:
breakouts: two trend lines (ascending and descending) and a line indicating a horizontal breakout.
chart patterns: shoulders and head, triangle parttern, elliott impulse, etc etc.
We don't always have the time to track them at all times or to represent them visibly, given the numerous signals, the number of channels to manage, and especially because of the often rapid pace of market movements.
indicators: We associate at least two indicators with this technique.
👉Depending on the circumstances, we use specific indicators, often setting 3 or more take profit levels.
👉Indeed, there are good days in trading and also bad days. No one can promise to win every trade, and like all traders worldwide, we also experience stop-loss orders. However, we win more than we lose and remain positive.
👉You can close the position before or after the take profit orders indicated by the green lines if you are personally satisfied; the same applies to stop loss orders.
👉We must stay positive, clear-headed, and humble.
we cannot provide all instructions or all trades here on this channel.
Good luck to us all, and may God guide us. Amen.
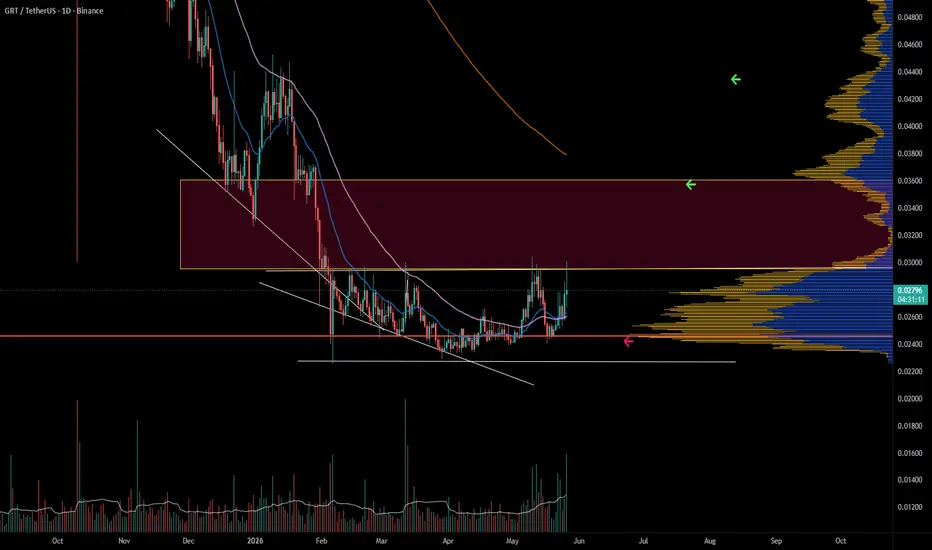
The Graph may have found its bottom but just trade what you gotGETTEX:GRT is showing early signs of a trend reversal after months of sustained selling pressure. Price has broken out of its descending structure and is beginning to establish higher lows, a key signal that buyers are regaining control.
Volume has started to increase alongside the recent move higher, adding credibility to the recovery and suggesting accumulation may be underway.
The major resistance zone overhead remains the key battleground. Bulls need a decisive break above this supply area to confirm a larger bullish structure shift. Until then, this remains a recovery attempt within a broader range.
Support is holding near the recent base, and as long as that level remains intact, the bullish outlook stays valid.
GETTEX:GRT is approaching a critical decision point. A breakout could attract significant attention from traders looking for strength in the AI and data infrastructure sectors of crypto.
grtusdt shortInstructions:
Entry point: yellow
Stop loss: red
Take profit: green
👉Leverage x 5-10-20 for crypto
👉Leverage x 20-50-100 for commodities, stocks, indices, and forex
👉Margin 1-5% max.
Always practice risk and money management.
Invest a maximum of 5% on any trade or across all your trades.
Invest only what you can afford to lose, as no one is in control of the market.
👉Our analyses are primarily based on:
breakouts: two trend lines (ascending and descending) and a line indicating a horizontal breakout.
chart patterns: shoulders and head, triangle parttern, elliott impulse, etc etc.
We don't always have the time to track them at all times or to represent them visibly, given the numerous signals, the number of channels to manage, and especially because of the often rapid pace of market movements.
indicators: We associate at least two indicators with this technique.
👉Depending on the circumstances, we use specific indicators, often setting 3 or more take profit levels.
👉Indeed, there are good days in trading and also bad days. No one can promise to win every trade, and like all traders worldwide, we also experience stop-loss orders. However, we win more than we lose and remain positive.
👉You can close the position before or after the take profit orders indicated by the green lines if you are personally satisfied; the same applies to stop loss orders.
👉We must stay positive, clear-headed, and humble.
we cannot provide all instructions or all trades here on this channel.
Good luck to us all, and may God guide us. Amen.
GRTGETTEX:GRT has trended within a long-term descending channel since genesis, with recent price action suggesting seller exhaustion at the lower bounds. Structure points toward a potential transition into price discovery, supported by narrative tailwinds in AI and staking. Positioning remains favorable to capture incremental capital inflows.
GRTUSDT 1D#GRT looks promising. It is moving within a descending channel and is on the verge of breaking out above a resistance cluster, which includes the channel resistance, the Ichimoku cloud, and the daily SMA50. If that happens, the potential upside targets are:
🎯 $0.02791
🎯 $0.03123
🎯 $0.03391
🎯 $0.03659
🎯 $0.04041
🎯 $0.04527
⚠️ Always remember to use a tight stop-loss and maintain proper risk management.
The Graph (GRT): Buy & hold with long-term focus (Think of 2056)The all-time high happened February 2021. The all-time low February 2026.
The bull market, Nov. 2022 - March 2024, can also be called a long-term relief rally or inverted correction, if we consider the entire chart as one.
The bull market lasted 469 days. The bear market that followed, March 2024 - February 2026, lasted 700 days.
The first bear market, Feb. 2021 - November 2022, lasted 651 days.
The previous bullish period lasted less than either bear market, which supports the inverted correction definition.
What happens if we get a full blown bull market next, how long can it last?
Instead of 450 some days, it can last 700, 900 days or more, possible?
This would be a true bull market.
There can be a strong correction in-between the bull market, just like the bullish period in 2023-24. This would be a small bear market just as we had a small bull market. GRTUSDT has been bearish long-term.
Market conditions are changing from a fundamental and regulatory standpoint.
The Cryptocurrency market today is not the same as back in 2015, 2020 or 2022. Market conditions continue to improve.
Cryptocurrencies are now a normal part of our lives. Still young, wild and innovative but no more rare, new or strange. It has become part of the firmament.
In just a few years from now, say 1-4 years, Cryptocurrencies will be fully regulated. There won't be a need for the harsh times and strong volatility we saw in the past. It will be different and it gets better.
Patience is key. Buy and hold focused on the long-term.
Invest in Crypto with a 3-5 years perspective. Buy Crypto thinking long-term, 10, 20 and even 30 years into the future. Think of life in the year 2056... What do you see?
Buy reputable projects. Buy weekly, monthly, yearly—as much as you can.
Buy and hold. Continue to accumulate. You will be happy with the results.
Namaste.
GRTUSDT — Ongoing Downtrend, Reversal or Further Drop Ahead?On the 1D timeframe, GRT/USDT is still in a strong downtrend since its previous peak. This is clearly shown by:
A consistent lower high & lower low structure
A descending trendline resistance continuously pushing the price down
Price currently moving near a minor support zone (~0.022 – 0.024)
The market is now in a tight consolidation below resistance, which often signals an upcoming decisive move.
---
📐 Pattern Formation: Descending Triangle / Bearish Continuation
This chart is forming a:
➡️ Descending Triangle
Key characteristics:
Lower highs (rejected by the yellow trendline)
Relatively flat horizontal support
Strong selling pressure
📌 This pattern is typically a bearish continuation pattern, but it can turn bullish if a strong breakout occurs.
---
🟢 Bullish Scenario (Reversal Setup)
Bullish momentum is valid only if:
✅ Price breaks and closes above the trendline resistance
✅ Supported by increasing volume
Upside targets:
🎯 0.0280 (first resistance)
🎯 0.0305 (supply zone)
🎯 0.0370 (major resistance)
🎯 0.0435 (mid-term target)
📈 A valid breakout could lead to a +30% to +70% move from the current level
⚠️ Note:
A weak breakout may result in a fakeout and continuation to the downside.
---
🔴 Bearish Scenario (Trend Continuation)
Bearish momentum remains dominant if:
❌ Price fails to break the trendline
❌ Price keeps getting rejected below resistance
Bearish confirmation:
Breakdown below 0.022 – 0.024 support zone
Downside targets:
🎯 0.0215 (recent low)
🎯 Lower levels if panic selling occurs
📉 This would confirm a continuation of the lower low structure
---
📊 Key Levels
Resistance: 0.0280 — 0.0305 — 0.0370 — 0.0435
Support: 0.0240 — 0.0225 — 0.0215
---
⚠️ Conclusion
Main trend: Bearish
Current condition: Compression / consolidation below resistance
High probability: Impulsive move (breakout or breakdown) coming soon
👉 This is a critical decision zone
Traders should wait for clear confirmation before entering large positions.
#GRT #GRTUSDT #CryptoAnalysis #TechnicalAnalysis #Altcoins #BearishTrend #Breakout #DescendingTriangle #CryptoTrading #SupportResistance #MarketStructure
GRT: ready to soar? key levels and targets for the next few daysGRT
Anyone else watching this thing wake up again? GRT has been riding the AI narrative, and according to market chatter, fresh attention is coming back into AI‑linked coins after the latest big‑tech AI headlines. Today we just saw another sharp 4H push, which the market clearly didn’t ignore.
On the 4H chart price is breaking out from the local consolidation zone with strong wicks off that green demand band and RSI pushing above 60, showing bulls in control. Volume is picking up around this breakout, so I’m leaning long here, expecting continuation as late buyers FOMO in. If buyers hold above the mid green zone, this looks like the start of a new local leg up rather than a random spike.
My base case: GRT grinds higher toward the upper red supply area where I’ll be looking to take profits and see how price reacts. I want to see shallow pullbacks that stay inside or just above the current green zone – that keeps the long idea valid. If price loses that mid demand and starts living below it, I’ll flip the bias and look for a deeper dip into the lower green block. I might be wrong, but ignoring this setup feels riskier than at least having a plan.
The Graph: Buy & hold focused on the long-term (Think of 2056)The all-time high happened February 2021. The all-time low February 2026.
The bull market, Nov. 2022 - March 2024, can also be called a long-term relief rally or inverted correction, if we consider the entire chart as one.
The bull market lasted 469 days. The bear market that followed, March 2024 - February 2026, lasted 700 days.
The first bear market, Feb. 2021 - November 2022, lasted 651 days.
The previous bullish period lasted less than either bear market, which supports the inverted correction definition.
What happens if we get a full blown bull market next, how long can it last?
Instead of 450 some days, it can last 700, 900 days or more, possible?
This would be a true bull market.
There can be a strong correction in-between the bull market, just like the bullish period in 2023-24. This would be a small bear market just as we had a small bull market. GRTUSDT has been bearish long-term.
Market conditions are changing from a fundamental and regulatory standpoint.
The Cryptocurrency market today is not the same as back in 2015, 2020 or 2022. Market conditions continue to improve.
Cryptocurrencies are now a normal part of our lives. Still young, wild and innovative but no more rare, new or strange. It has become part of the firmament.
In just a few years from now, say 1-4 years, Cryptocurrencies will be fully regulated. There won't be a need for the harsh times and strong volatility we saw in the past. It will be different and it gets better.
Patience is key. Buy and hold focused on the long-term.
Invest in Crypto with a 3-5 years perspective. Buy Crypto thinking long-term, 10, 20 and even 30 years into the future. Think of life in the year 2056... What do you see?
Buy reputable projects. Buy weekly, monthly, yearly—as much as you can.
Buy and hold. Continue to accumulate. You will be happy with the results.
Namaste.
GRTUSDT - Structure of the Move and Current Market SituationLooking at the chart from a broader perspective, the entire move from the top can be interpreted as a five-wave declining structure. The market has been forming a sequential downward impulse with intermediate corrections, and the price is currently approaching an area where the present phase of selling pressure could potentially be nearing completion.
The latest segment of the move is unfolding inside a contracting structure, where the price range is gradually narrowing. This type of behavior often appears toward the later stages of a trend, when the momentum of the move begins to weaken.
The recent move below the lower boundary of this structure may turn out to be a false breakout. In situations like this, the market often performs a final liquidity sweep below local lows before returning back into the range.
At the moment, the market is forming a decision point. The reaction around current levels will determine whether the latest drop was a final liquidity sweep or simply another leg within the ongoing decline.
Additionally, the time rhythm of the chart is worth noting. In the past, key turning phases have appeared roughly every 300 days, and the current situation once again falls within a similar time window. This is not a guarantee of a reversal, but it increases the probability that the market may be approaching a potential phase transition.