In-depth trading ideas
๏ปฟGravity (G) at bottom ยท Bullish reversal signals โPP: 2000-3000%All is great right now. The altcoins market continues to look better with each passing hour.
Recently I mentioned a continuation on two projects as an example of how an altcoins marketwide continuation is starting to show, this is truer today compared to yesterday. I kept on reviewing charts and this continuation is present on hundreds of projects.
I will start this amazing Sunday by looking at some projects that are trading at the bottom, true bottom and all-time low. These can be approached as a great buy-entry opportunity in anticipation of maximum growth.
Good morning my fellow Cryptocurrency trader, thanks a lot for your continued support.
Gravity โGUSDT
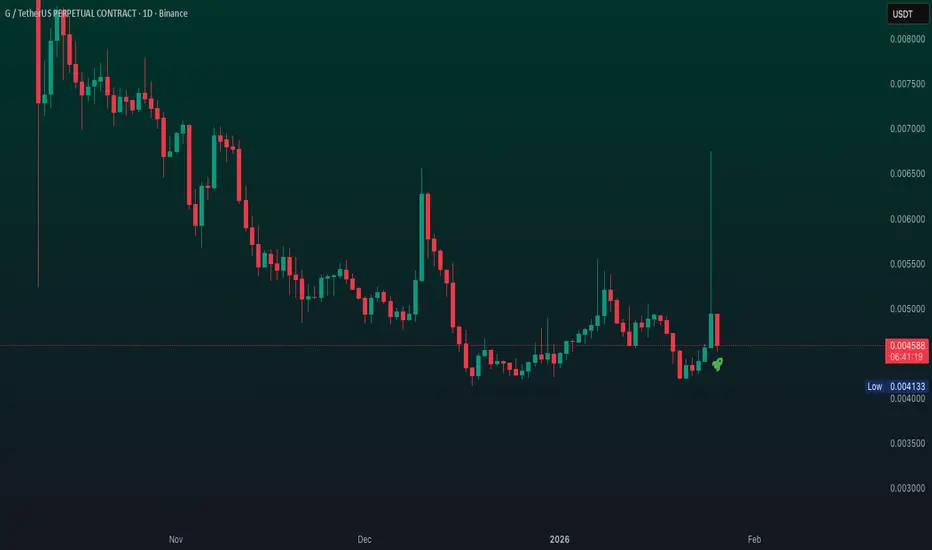
I looked at all the exchanges and the chart looks exactly the same. After hitting a new all-time low, we see strong bullish action; long upper-shadows on the candles and rising volume. The rising volume is the most significant signal when the chart looks like this.
It reveals the presence of buyers, interest at current prices and so on.
Candlestick reading can be coupled with the current signals. Weeks ago, a very strong inverted hammer appeared, then again the same signal shows up. The session that produced an all-time low is also a Doji.
First the Doji to signal indecision, then the inverted hammers to signal a reversal. Only confirmation is needed but buying can be started now, or weeks ago. This is a perfect entry zone.
Finally, there is a strong downtrend since 2024. Two years of bearish action and we know, based on how the rest of the market is doing and the above signals, that we are close to change.
Simplicity yields the best results when it comes to TA.
Thank you for reading.
Namaste.
Gravity (G) at bottom ยท Bullish reversal signals โPP: 2000-3000%All is great right now. The altcoins market continues to look better with each passing hour.
Yesterday I mentioned a continuation on two projects as an example of how an altcoins marketwide continuation is starting to show, this is truer today compared to yesterday. I kept on reviewing charts and this continuation is present on hundreds of projects.
I will start this amazing Saturday by looking at some projects that are trading at the bottom, true bottom and all-time low. These can be approached as a great buy-entry opportunity in anticipation of maximum growth.
Good afternoon my fellow Cryptocurrency trader, thanks a lot for your continued support.
Gravity โGUSDT on WhiteBIT
I looked at all the exchanges and the chart looks exactly the same. After hitting a new all-time low, we see strong bullish action; long upper-shadows on the candles and rising volume. The rising volume is the most significant signal when the chart looks like this.
It reveals the presence of buyers, interest at current prices and so on.
Candlestick reading can be coupled with the current signals. Two weeks ago, a very strong inverted hammer appeared, this week the same signal shows up. The session that produced an all-time is a Doji.
First the Doji to signal indecision, then the inverted hammers to signal a reversal. Only confirmation is needed but buying can be started now, or weeks ago. This is a perfect entry zone.
Finally, there is a strong downtrend since 2024. Two years of bearish action and we know, based on how the rest of the market is doing and the above signals, that we are close to change.
Simplicity yields the best results when it comes to TA.
Thank you for reading.
Namaste.
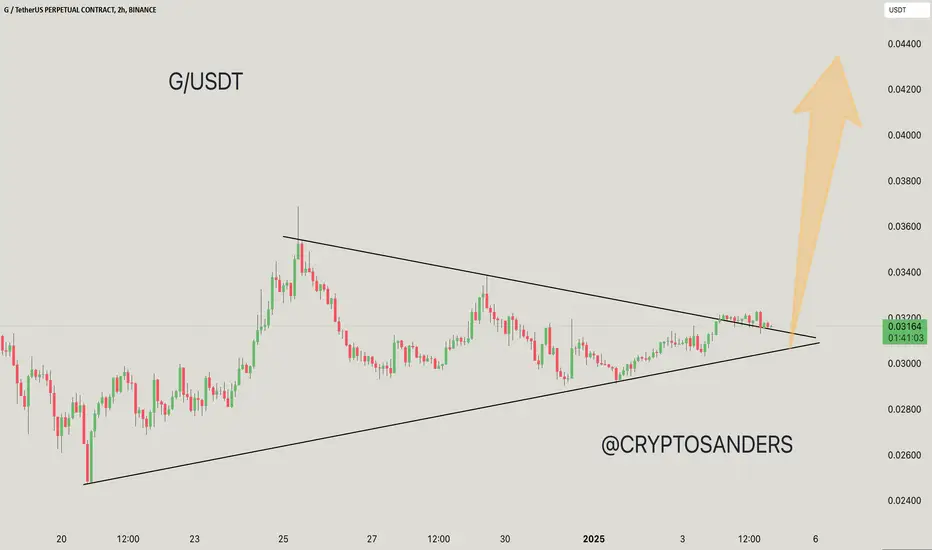
GUSDT Forming Falling WedgeGUSDT is forming a clear falling wedge pattern, a classic bullish reversal signal that often indicates an upcoming breakout. The price has been consolidating within a narrowing range, suggesting that selling pressure is weakening while buyers are beginning to regain control. With consistent volume confirming accumulation at lower levels, the setup hints at a potential bullish breakout soon. The projected move could lead to an impressive gain of around 140% to 150% once the price breaks above the wedge resistance.
This falling wedge pattern is typically seen at the end of downtrends or corrective phases, and it represents a potential shift in market sentiment from bearish to bullish. Traders closely watching GUSDT are noting the strengthening momentum as it nears a breakout zone. The good trading volume adds confidence to this pattern, showing that market participants are positioning early in anticipation of a reversal.
Investorsโ growing interest in GUSDT reflects rising confidence in the projectโs long-term fundamentals and current technical strength. If the breakout confirms with sustained volume, this could mark the start of a fresh bullish leg. Traders might find this a valuable setup for medium-term gains, especially as the wedge pattern completes and buying momentum accelerates.
โ
Show your support by hitting the like button and
โ
Leaving a comment below! (What is your opinion about this Coin?)
Your feedback and engagement keep me inspired to share more insightful market analysis with you!
#G #G is currently experiencing a price pullback ๐ after breaking out of a falling wedge pattern. The volume looks weak ๐, indicating that the bullish momentum might be slowing down. Traders should watch for a potential retest ๐ค of the previous resistance level around 0.004550 as a possible target.
A breakout without volume is just a fakeout. ๐ก
#G #crypto #trading #altcoin
GUSDT - Long LiqGUSDT spot at 0.004651 against 0.004627 futures โ backwardation at -0.52% with -565% APY, futures pricing mild downside. S/F Vol at 2.74B spot against 28.52B futures gives 10.34x High leverage sitting at 46.2% Lower of its range, well below the 22.37x all-time max hit 171 bars ago.
14 bull signals against 33 bear across 112 gives a 24.7% Moderate BEAR spread at 42% clarity. EMA 2 bull 3 bear, candle bias 4 bull 7 bear, Ichi TK 5 bull 8 bear. Two star patterns bull, zero bear. C>T zero bull 14 bear โ price below Tenkan on every single timeframe. SS/DD shows 1 demand against 10 supply zones dominant. Both spot and futures squeezes FIRED simultaneously โ BOTH FIRED confirmed on Sqz Div with bull rising momentum and blowoff BBW at 64.71%.
Spot Z at 2.41 Spike, Futures Z at 2.91 V.High, Combined at 2.9 V.High. Full Send on Spot:Fut. Momentum at 2.35 accelerating. Bull:Bear Z at -0.14 against 14 โ one of the most extreme bear-dominant directional readings possible. OBV Z at 3.64 Strong up โ this is the key conflict in the data.
Leverage at 10.34x High at 46.2% Lower โ mid-range, not at peak speculation. Price at 16% Floor of range between 0.00318 and 0.01235. Longs liquidation warning active. MeanZ at -1.51ฯ Fall showing premium structure deteriorating. Both volume squeezes fired together with 1130.1% spot momentum blowoff โ maximum energy release event.
OBV Z at 3.64 Strong up with Normal divergence is the only genuine bull signal in the stack. BOTH FIRED squeeze with bull momentum direction suggests the release energy leans up. But Bear Dom direct flow with Bull:Bear Z at 14 bear side and C>T zero bull across all timeframes is a structurally broken picture.
The honest read: BOTH FIRED squeeze with OBV Strong up is genuinely interesting โ when both spot and futures squeezes release together it typically means a sustained directional move, not a spike. The bull momentum direction on the squeeze release combined with OBV accumulation at 3.64 suggests this could be a real recovery attempt from the -30.3% deep retrace at price floor. However Bear Dom direct flow and 14 bear C>T signals mean the higher timeframe trend is firmly down. This looks like a tradeable bounce, not a trend reversal โ the 1.6x recovery ratio confirms partial recovery only. Backwardation and 10 supply zones overhead are the ceiling.
Is That Crypto Pump Real? Data Says No. Here's Why.
Stop Losing Money to Fake Volume. Find Real Moves Now.
Trade the REAL Crypto Volume. Stop Getting Faked Out.
GUSDT Extreme Bull Signal โ Futures BlackSwan, Real or Trap?GUSDT is printing Extreme BULL at 83.97% with spot at 0.00614 against futures at 0.00539. F/S ratio sits at 8.47x Elevated with spot dollar volume at 34.11M against 289.06M futures, futures outweighing spot by a wide margin.
50 of 112 signals are bullish against 4 bearish with Clarity at 48%. EMA stack clean at 7:0, Ichi TK 10:2, Candle bias 13:1 with 4 bullish pattern confirmations including 3 Stars across timeframes. SS/DD shows 1 demand against 5 supply zones overhead. Price squeeze FIRED with momentum Bull up and BW at 66.68% Expanding, volatility expansion underway across both price and volume.
Spot Z 9.4 BlackSwan and Futures Z 14.3 BlackSwan combine into F+S Z of 13.87 BlackSwan. Spot:Fut reads Full Send, both markets exploding simultaneously. Volume momentum at 9.71 Accel confirms the surge is accelerating rather than fading.
Leverage at 7.44x Elevated with Percentile at 100% Ceiling, AT Max hit 0 bars ago. Price sits at 16.2% Floor in the 200-bar range, creating a sharp divergence where price is historically low while leverage is historically maxed out, a dangerous combination for late longs.
OBV Z 4.1 Strong up is the key read here. Real spot accumulation is backing this move, not pure paper. Liq fired SHORT REKT confirming mass short liquidation is the driver. Bull:Bear Z at 13.95 against -0.51 shows overwhelming directional conviction in buy volume.
The honest read: this is a short squeeze liquidation cascade, not organic accumulation. Futures volume is 8x spot, leverage is at absolute ceiling, and premium is deeply negative at -12.32% Bkwd with Z at -9.3, backwardation this extreme means the market was priced for a crash before this move. Shorts got caught and are being forcefully unwound. OBV and Spot Z confirm real spot is joining in which adds credibility to continuation, but chasing at leverage ceiling with 48% clarity is high risk. Wait for leverage percentile to pull back before sizing in.
Is That Crypto Pump Real? Data Says No. Here's Why.
Stop Losing Money to Fake Volume. Find Real Moves Now.
Trade the REAL Crypto Volume. Stop Getting Faked Out.
G ( Spot -Investment )BINANCE:GUSDT
G/ USDT
Entry range (0.0045- 0.0050)
SL 1D close below 0.0039
T1 0.008
T2 0.011
T3 0.016
T4 0.020
T5 0.027
3 optional extra targets on the chart
_______________________________________________________
Golden Advices.
********************
* collect the coin slowly in the entry range.
* Please calculate your losses before the entry.
* Do not enter any trade you find it not suitable for you.
* No FOMO - No Rush , it is a long journey.
Galaxy its time to rise?Couple quick facts about G:
-Gravity is a Galxe project developing an omnichain Layer-1 blockchain focused on scalability, efficiency, and interoperability.
-The current alpha-Mainnet is built on Arbitrum Orbit/Nitro technology, supporting the migration of Galxe ecosystem activities on-chain, such as Quest, Passport, and the Identity Protocol.
-The full standalone Gravity Mainnet (Layer-1) is planned for 2025, with features such as very high throughput, sub-second transaction finality, restaking mechanisms, and EVM compatibility.
3-Month Outlook (Optimistic Scenario)
If Gravity:
continues deploying key ecosystem features (new integrations within Galxe), maintains or grows its active user base, and sustains current bullish technical signals, then over the next three months:
The G token could experience moderate price growth, bouncing from current support levels and testing higher resistance zones. Potential gains: in a favorable environment, a 20โ50% upward move from current prices is possible, depending on overall market conditions.
Still, short-term corrections remain likely, especially when technical indicators show overbought conditions.
The perfect setup A+ (short)This is the perfect setup for a short position in my book, overall trend is a downtrend on the Daily time frame, it has been constantly going down and itโs showing more downside since it did a pullback creating a bear flag, which it has broke out of the flag and itโs retesting, this trade is offering a very good risk reward 1:2 being conservative but it show more potential this is a swing trade for the short term.
Comment what do you think about my first idea
$$$
GUSDT โ Blue Boxes Mark the Resistance Zones! โWe're at a critical levelโcan buyers push through or will resistance hold?โ
๐ฅ Key Insights:
โ
Blue Boxes = Resistance Zones โ Expect strong reactions here.
โ
Rejection = Short Setup โ But only with LTF breakdown confirmation.
๐ก The Smart Plan:
Watch Lower Time Frames (15M & 1H) โ Look for breakouts or rejections.
CDV & Volume Profile Must Align โ Smart traders wait for confirmation.
React, Donโt Predict โ Trade based on what the market shows.
โPatience and confirmation are keyโletโs see what the blue boxes tell us!โ ๐๐ฅ
A tiny part of my runners:
๐ฏ ZENUSDT.P: Patience & Profitability | %230 Reaction from the Sniper Entry
๐ถ DOGEUSDT.P: Next Move
๐จ RENDERUSDT.P: Opportunity of the Month
๐ ETHUSDT.P: Where to Retrace
๐ข BNBUSDT.P: Potential Surge
๐ BTC Dominance: Reaction Zone
๐ WAVESUSDT.P: Demand Zone Potential
๐ฃ UNIUSDT.P: Long-Term Trade
๐ต XRPUSDT.P: Entry Zones
๐ LINKUSDT.P: Follow The River
๐ BTCUSDT.P: Two Key Demand Zones
๐ฉ POLUSDT: Bullish Momentum
๐ PENDLEUSDT.P: Where Opportunity Meets Precision
๐ฅ BTCUSDT.P: Liquidation of Highly Leveraged Longs
๐ SOLUSDT.P: SOL's Dip - Your Opportunity
๐ธ 1000PEPEUSDT.P: Prime Bounce Zone Unlocked
๐ ETHUSDT.P: Set to Explode - Don't Miss This Game Changer
๐ค IQUSDT: Smart Plan
โก๏ธ PONDUSDT: A Trade Not Taken Is Better Than a Losing One
๐ผ STMXUSDT: 2 Buying Areas
๐ข TURBOUSDT: Buy Zones and Buyer Presence
๐ ICPUSDT.P: Massive Upside Potential | Check the Trade Update For Seeing Results
๐ IDEXUSDT: Spot Buy Area | %26 Profit if You Trade with MSB
๐ USUALUSDT: Buyers Are Active + %70 Profit in Total
๐ FORTHUSDT: Sniper Entry +%26 Reaction
๐ณ QKCUSDT: Sniper Entry +%57 Reaction
๐ BTC.D: Retest of Key Area Highly Likely
G/USDT LONG TRADE SETUP !!This is a long trade setup for G/USDT with specific entry, stop-loss, target, and leverage details:
Entry: Current Market Price (CMP) and $0.03090
Stop-Loss: $0.03000
Target: $0.03678
Leverage: 5x to 10x
Let me know if youโd like further assistance or adjustments!
DYOR. NFA
Strategic Buy Opportunity in Cryptocurrency GDescription:
Unlock the potential of Cryptocurrency G with a strategic buy approach grounded in fundamental analysis. This guide offers key insights into the factors that can influence the value of Crypto G, helping you make informed trading decisions on TradingView.
Fundamentals Overview:
1. **Adoption and Use Cases**: Monitor the growth of real-world applications and partnerships involving Crypto G. Increased adoption for payments, smart contracts, or other blockchain innovations can drive demand and enhance its value.
2. **Market Sentiment**: Pay attention to market sentiment, including news, social media trends, and influencer endorsements. Positive sentiment and strong community support can significantly impact the price of Crypto G.
3. **Regulatory Environment**: Stay updated on regulatory developments and government policies affecting the crypto market. Favorable regulations can boost investor confidence, while stringent policies may pose risks to Crypto G's growth.
4. **Network Developments**: Watch for updates on the technological advancements and improvements within the Crypto G network. Upgrades, security enhancements, and scalability solutions can increase the appeal and functionality of the cryptocurrency.
Disclaimer:
Cryptocurrency trading involves significant risk and may not be suitable for all investors. The volatile nature of digital assets like Crypto G can result in substantial losses. Before trading, ensure you understand the risks, consider your investment goals, and evaluate your financial situation carefully. Be aware that past performance is not a reliable indicator of future results. Always conduct thorough research and, if necessary, consult with a financial advisor before engaging in cryptocurrency trading.
---
Use this guide to enhance your trading strategy for Crypto G, grounding your buy decisions in solid fundamentals. Stay informed with real-time updates and insights to capitalize on opportunities in the fast-paced world of cryptocurrency.
G/USDT NEW ATH POSSIBLITYThe last data shows that G/USDT has a good chance to create a new volume in the coming time frames, we will follow up to see if this coin is able to have confirmation in the coming time frames.
G/USD has a history of breakdown trends, we will follow the coin to see if this is the reversal trend.
There is possibility for new ATH