Haedal Protocol turns bullish —Long-term growth starts now!HAEDALUSDT just closed the biggest week ever as it moved out of bearish cycle. Coupled with this green candle we have a break of EMA8 & EMA13 weekly as resistance; the highest volume since July 2025; a rounded bottom and a broken falling wedge pattern.
Wow! You never get to see the biggest green candle coupled with high volume during the bearish impulse. It is only happening at the bottom after the bearish wave reached its end.
This is the confirmation that a bullish wave starts now. Also the confirmation that lower is no longer possible as the bulls entered the game. The market is now bullish based on recent price action.
Many projects are looking like this. After the cessation of new lows, we get some bullish action. Some are doing extraordinary numbers in the first few days of green. Others are taking longer but moving higher. The ground gained is being maintained, and this is the most positive development supporting growth long-term.
Crypto is set to grow. Bearish action ended almost three months ago. The transition period is about to reach its end. Once the bearish impulse is over, we get to enjoy a strong wave of rising prices. It is already happening on so many projects.
Thank you for reading.
Namaste.
In-depth trading ideas
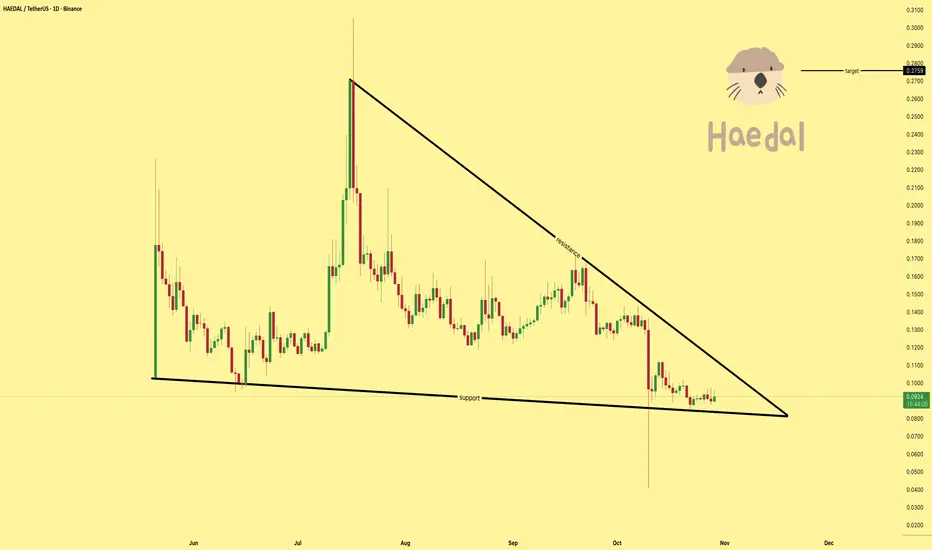
HEADALUSDT Forming Bullish MomentumHEADALUSDT is forming a clear bullish momentum pattern, a classic bullish reversal signal that often indicates an upcoming breakout. The price has been consolidating within a narrowing range, suggesting that selling pressure is weakening while buyers are beginning to regain control. With consistent volume confirming accumulation at lower levels, the setup hints at a potential bullish breakout soon. The projected move could lead to an impressive gain of around 90% to 100% once the price breaks above the wedge resistance.
This bullish momentum pattern is typically seen at the end of downtrends or corrective phases, and it represents a potential shift in market sentiment from bearish to bullish. Traders closely watching HEADALUSDT are noting the strengthening momentum as it nears a breakout zone. The good trading volume adds confidence to this pattern, showing that market participants are positioning early in anticipation of a reversal.
Investors’ growing interest in HEADALUSDT reflects rising confidence in the project’s long-term fundamentals and current technical strength. If the breakout confirms with sustained volume, this could mark the start of a fresh bullish leg. Traders might find this a valuable setup for medium-term gains, especially as the pattern completes and buying momentum accelerates.
✅ Show your support by hitting the like button and
✅ Leaving a comment below! (What is your opinion about this Coin?)
Your feedback and engagement keep me inspired to share more insightful market analysis with you!
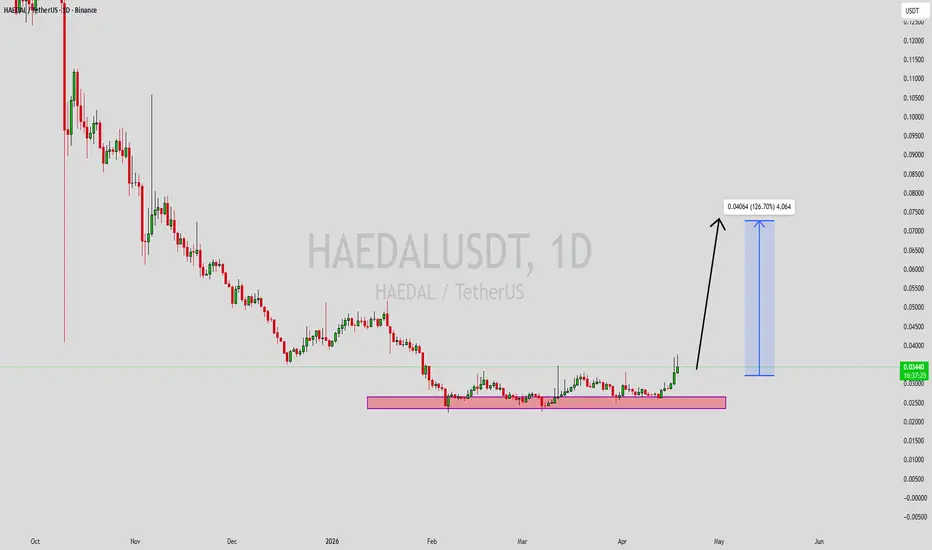
HAEDALUSDT About to Explode?HAEDAL is showing early signs of a potential trend reversal after a prolonged downtrend, with price now reclaiming a key horizontal resistance level and attempting to flip it into support.
Key Points:
- Price has broken above a major resistance zone (~0.033–0.034), which previously acted as strong supply.
- This level is now being retested as support, a classic bullish confirmation if it holds.
- The market structure is shifting from lower highs → consolidation → potential higher high, indicating early accumulation.
- Moving averages are starting to compress and flatten, hinting at a possible trend transition.
- Holding above the breakout zone opens the door for a strong impulsive move.
- Target range sits around 0.10–0.11, aligning with the next major high-volume area and resistance zone.
- Failure to hold above the breakout level would signal a fakeout, sending price back into the prior range.
- A breakdown below ~0.029 could invalidate the bullish thesis and resume the broader downtrend.
Cheers
Hexa
#HAEDAL#HAEDAL is currently trading around 0.02739 📉, showing some consolidation after a downtrend. A falling wedge pattern 📐 is forming, which is often a bullish reversal signal. The next potential target is around 0.02850 🎯 if the price breaks out of the wedge.
Patience is key 🗝️; wait for confirmation before making trading decisions.
#HAEDAL #crypto #trading #pattern
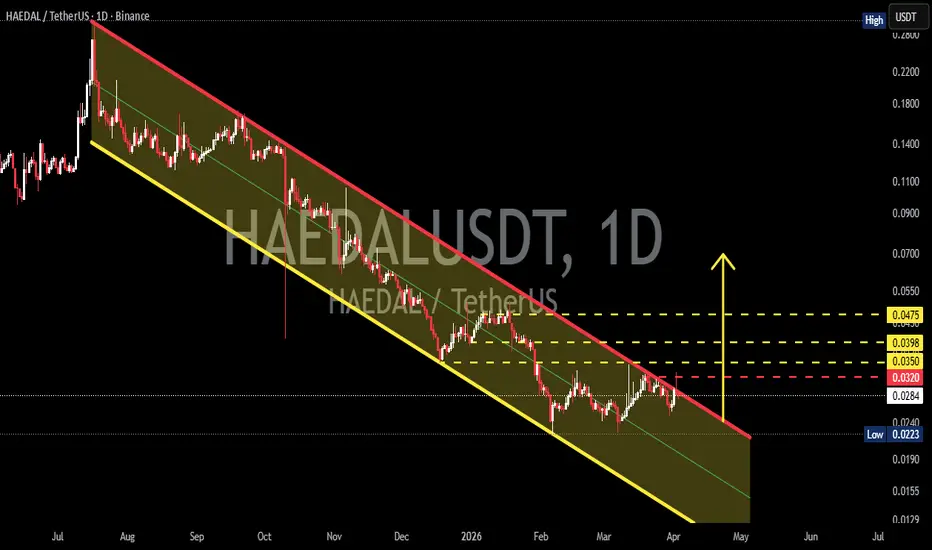
HAEDALUSDT Descending Channel — Reversal or Bearish ContinuationThe chart clearly shows price moving within a Descending Channel (Bearish Channel):
Red resistance line → consistent Lower Highs
Yellow support line → consistent Lower Lows
Overall trend remains bearish (strong downtrend)
However, currently:
Price is approaching the channel resistance area
Forming a small consolidation / sideways movement
Early signs of accumulation / base formation are appearing
---
🔍 Key Levels
🔴 Strong Resistance:
0.0320 (minor resistance)
0.0350 (key breakout level)
0.0398
0.0475 (major target)
🟢 Key Support:
0.0283 (current base)
0.0223 (channel lower support)
---
🧩 Pattern Analysis
📌 1. Descending Channel
A bearish continuation pattern
As long as price stays inside the channel → bias remains bearish
📌 2. Possible Accumulation
Sideways movement suggests selling pressure is weakening
Potential for breakout if volume increases
---
🟢 Bullish Scenario (Reversal / Breakout)
📈 Confirmation:
Break and close above the red trendline (channel resistance)
Ideally above 0.0320 – 0.0350
🎯 Targets:
0.0398
0.0475
Potential +20% – 40% upside if momentum is strong
💡 Insight:
A breakout from a descending channel often leads to a strong impulsive move due to trapped sellers exiting positions.
---
🔴 Bearish Scenario (Continuation)
📉 Confirmation:
Rejection at resistance
Breakdown below 0.0283
🎯 Targets:
0.0223 (lower channel support)
Possible further downside if market weakens
💡 Insight:
As long as no breakout occurs, this remains a bearish continuation structure
---
⚖️ Conclusion
Main trend: Bearish
Current condition: Testing channel resistance
This is a key decision zone
👉 Break above = early reversal
👉 Rejection = continuation lower
#HAEDAL #CryptoAnalysis #TechnicalAnalysis #Altcoins
#BearishTrend #DescendingChannel #BreakoutSetup #CryptoTrading #SupportResistance
#PriceAction #AltcoinSeason #TradingCrypto #ChartAnalysis #BullishSetup
HEADALUSDT Forming Bullish MomentumHEADALUSDT is forming a clear bullish momentum pattern, a classic bullish reversal signal that often indicates an upcoming breakout. The price has been consolidating within a narrowing range, suggesting that selling pressure is weakening while buyers are beginning to regain control. With consistent volume confirming accumulation at lower levels, the setup hints at a potential bullish breakout soon. The projected move could lead to an impressive gain of around 190% to 200% once the price breaks above the wedge resistance.
This bullish momentum pattern is typically seen at the end of downtrends or corrective phases, and it represents a potential shift in market sentiment from bearish to bullish. Traders closely watching HEADALUSDT are noting the strengthening momentum as it nears a breakout zone. The good trading volume adds confidence to this pattern, showing that market participants are positioning early in anticipation of a reversal.
Investors’ growing interest in HEADALUSDT reflects rising confidence in the project’s long-term fundamentals and current technical strength. If the breakout confirms with sustained volume, this could mark the start of a fresh bullish leg. Traders might find this a valuable setup for medium-term gains, especially as the pattern completes and buying momentum accelerates.
✅ Show your support by hitting the like button and
✅ Leaving a comment below! (What is your opinion about this Coin?)
Your feedback and engagement keep me inspired to share more insightful market analysis with you!
Futures · A New Opportunity · Asymmetric Risk-Reward · HaedalOpportunities are endless. Let me show you.
HAEDALUSDT we traded before once already and the trade-numbers were a success. This is good because if we can see it go up once, we can do it again. Market conditions are very similar to what they were before the previous jump. All the signals are present for a new higher high jump.
Is the timing right? —Let's ask the chart.
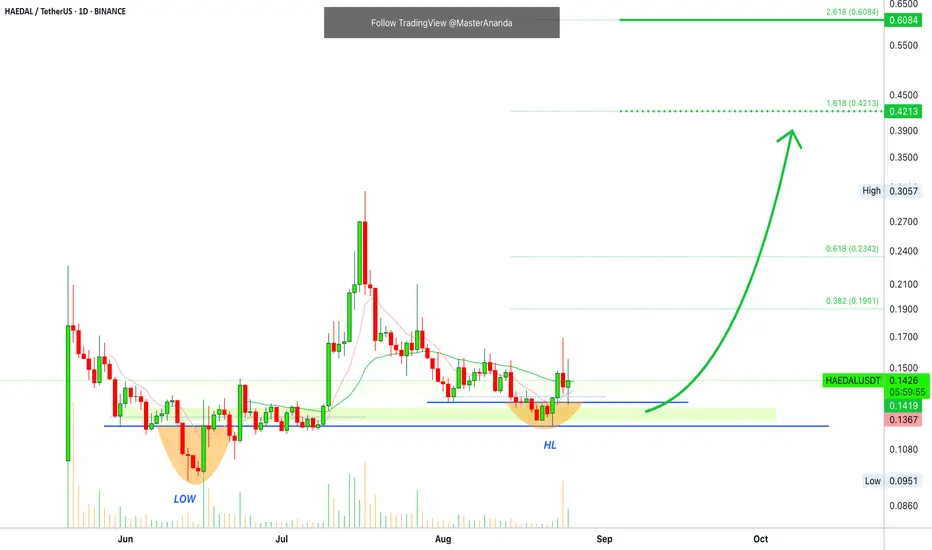
A low in June leads to sideways and then a bullish jump. The bullish jump shows up only when HAEDALUSDT moves above EMA34 (green).
Present day HAEDALUSDT produced a higher low in August vs June. The action is moving just today above EMA34 and this is the signal we've been waiting for.
Since we have a higher low, we can expect at least a higher high on this upcoming bullish jump. I am sure the market will move much higher, but this is the minimum. The higher the better for sure.
Our job is to spot the right entry at the right time. Buy low before prices jump. Buy patiently when prices are trading near support. These conditions are present on this chart setup. Some can change in a flash though and cause a loss.
Let's talk a little bit about losses.
There is a lot to lose and there is high frequency of losing. This is normal. If you open a position with 5% of your capital and lose 100% of the position, you still have plenty of capital left to continue trading.
Losing is not wrong. You only need to protect yourself from losing everything or losing big. We cap our risk.
Our losers we try to keep them small and our winners big. Something like asymmetric risk/reward. A small loss if you lose vs a big pay if you win.
If you lose, you only lose that 3% or 5%. If you win, you can get anywhere between 10-20X. When we are talking spot, the range goes between 10-30% per trade. You can lose 3 to 10 times and still be in the game. One win can produce easily 5X, 4X or 10X if the trade is long-term.
Spot, the risk is less but the winners take longer to produce big results. Spot has no stress basically and it is so easy once you learn the basics, that you can't go wrong. This is the way to win for the average person, buy and hold.
As soon as we grow and we are comfortable with our buy and hold, we move to the more advanced tools to increase our risk but also our potential for rewards. You can't go wrong if you only use your profits to grow to the next step.
There is always time. There is no need to hurry, the market is not going away.
If the opportunity is real and yours to take, take the time to prepare. Once your skills are well developed, you can earn money with Crypto long-term. If you rush, you lose and have to try again. If you take your time, you can win big and winners we are all... All those of us who never give up.
Keep trying and go harder.
Never give up.
Go higher.
Namaste.
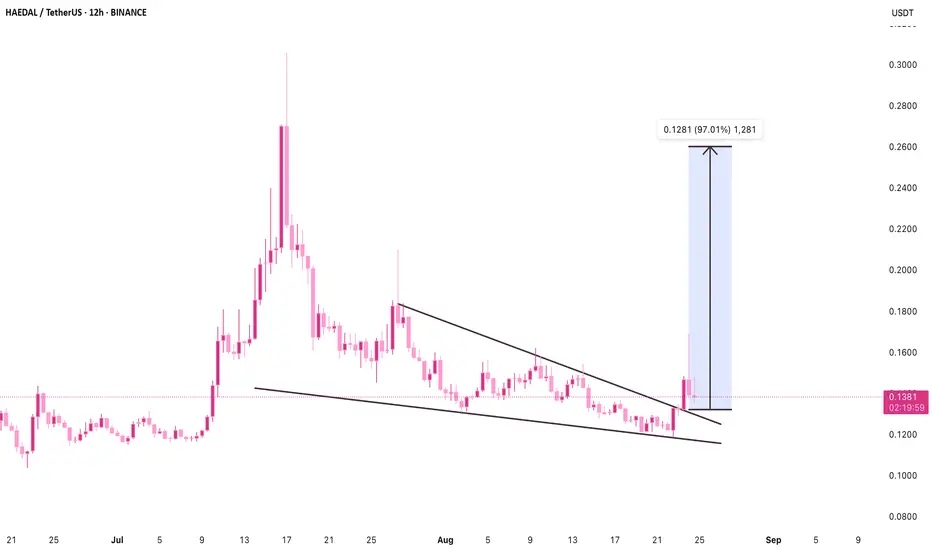
HAEDAL – Falling Wedge Breakout with 97% TargetAfter breaking above a descending wedge structure, HAEDAL is now trading above the former resistance line near 0.1376 USDT. This move confirms a bullish breakout, with price consolidating in a tight range just above the trendline – now acting as support.
The projected move based on the pattern’s depth points toward a potential upside target of 0.266 USDT (+97% from breakout). As long as price structure holds, momentum remains tilted in favor of the bulls.
Key levels:
• Breakout zone: ~0.132 USDT
• Target: 0.266 USDT
• Invalidation: Breakdown below ~0.120 USDT
Breakout remains valid – watching for sustained strength toward the upside objective.
HAEDALUSDT UPDATE#HAEDAL
UPDATE
HAEDAL Technical Setup
Pattern : Falling Wedge Breakout
Current Price: $0.1449
Target Price: $0.26
Target % Gain: 73%
Technical Analysis: HAEDAL has broken out of a falling wedge pattern on the 1D chart, showing strong bullish momentum. Price is holding above the breakout zone with increasing buying pressure, indicating potential continuation toward $0.26.
Time Frame: 1D
Risk Management Tip: Always use proper risk management.
Haedal Protocol: Trading Young Charts Short-Term (~125% Profits)Remember the "young charts"?
"Not enough data."
We now trade the young charts as well but always keep it short-term. Our aim is a maximum of 130-120%.
Here I show higher targets but normally that's the range. We go for 10% the first target, more or less, to 120-150% the last target.
And of course, short-term for us means one month (30 days). For some people and trading styles this is a very long time and I understand.
Technical analysis HAEDALUSDT
» We have the falling wedge pattern. Automatically when the action breaks out of this pattern we have also a broken downtrend and downtrend line.
» Here we have a rounded bottom, a higher low and a bullish hammer candlestick.
» 16-June produced the highest volume and this day marks the end of the downtrend and bullish breakout from the falling wedge.
All these are bullish signal. We are aiming up while aiming higher. Higher high, higher heights, new all-time high and beyond in the coming weeks and months.
Namaste.
HAEDALUSDT Forming Inverse Head And ShoulderHAEDALUSDT is currently forming an inverse head and shoulders pattern on the chart, a classic bullish reversal structure that signals the potential end of a downtrend. This pattern is often considered highly reliable when confirmed by a breakout above the neckline, especially when accompanied by strong trading volume. In the case of HAEDALUSDT, volume has been steadily increasing, suggesting accumulating interest from investors and a possible breakout on the horizon.
Technical analysis indicates that if HAEDALUSDT successfully breaks above the neckline, it could initiate a strong upward move, potentially yielding gains in the range of 60% to 70%+. The symmetry of the pattern, with well-formed shoulders and a clear head, further enhances the reliability of the bullish setup. Such technical formations tend to attract both swing traders and breakout traders who anticipate momentum-driven moves.
Adding to its appeal, the project behind HAEDALUSDT has started gaining traction among investors, which is reflected in recent price stability and a surge in buying pressure. This could mark the beginning of a broader trend reversal, especially if market sentiment across the crypto space continues to recover. Coins forming strong bottoming patterns like this often outperform in bullish cycles.
If you're looking for an early entry into a potential breakout with high reward-to-risk potential, HAEDALUSDT is certainly a chart to keep on your radar. Continued volume support and a confirmed breakout could quickly propel it toward upper resistance zones, making it a favorable candidate for short- to mid-term gains.
✅ Show your support by hitting the like button and
✅ Leaving a comment below! (What is You opinion about this Coin)
Your feedback and engagement keep me inspired to share more insightful market analysis with you!
HAEDAL/USDT – Breakout Trade Setup After Market Structure ShiftThis chart highlights a potential bullish breakout scenario on HAEDAL/USDT (30min timeframe), following a clean shift in market structure.
After a series of lower highs (LH) and lower lows (LL), price formed a higher low (HL), signaling a possible trend reversal.
A key descending trendline has been broken with momentum, confirming buying interest. (It could be a fake out too so we need to wait for break the recent high)
The price has retraced and is consolidating just under the recent high around $0.1248.
Entry is planned on confirmation of a breakout above this level, with upside potential mapped using Fibonacci retracement.
📌 Key confluences:
• Trendline breakout + retest
• HL formation above 0.382–0.5 Fib zone
• Volume picking up into consolidation
• Clear invalidation level below HL
This is a momentum continuation setup — ideal for breakout traders with clear risk management.
HAEDALUSDT breakdown alertHAEDALUSDT breakdown alert
HAEDALUSDT has broken down from a triangle pattern and appears to have completed a retest of the breakdown zone. If the retest holds and price continues to reject that level, it may confirm bearish momentum and open the way for further downside.
Key levels to watch:
– Breakdown zone acting as resistance
– Next support levels below
– Volume confirmation on rejection
Keep a close eye — if this retest holds, HAEDAL could see continued selling pressure.
$HAEDAL/USDT Analysis (4H Chart):
The chart is showing a falling wedge pattern, typically a bullish reversal setup. The price is currently testing the upper boundary of the wedge near 0.131 USDT.
🔸 Key Support Zone at 0.125 - 0.110:
This green zone has acted as a strong demand area historically and is being respected again.
🔸 Upside Target: 0.20+ USDT
If the price successfully breaks out of the wedge with volume confirmation, a sharp move upward toward 0.16–0.20 USDT is likely.
🔸 Risk Level at 0.104 USDT:
A drop below this zone could invalidate the breakout setup and signal further downside.
🔸 Outlook:
Watch for a 4H candle close above the wedge. If confirmed, consider entries above 0.135 USDT with tight stop-losses below 0.114 USDT.
If HAEDAL breaks out of this wedge with strength, it could lead to a solid bullish move. Keep it on your radar and wait for confirmation before entering.
HAEDAL/USDT Volume surge !!!Box Formation with Strong Volume Surge
Big Buyers Stepping In?
Over the past 22 days, we've seen a well-defined box formation
This kind of setup often precedes a breakout, especially when supported by strong volume. DCA on green box for potential 70% up move — a confirmed breakout with volume could trigger a significant move.
HAEDAL Analysis (4H)The HAEDAL correction has started from the point marked with the red arrow on the chart.
This correction appears to be a diametric pattern. The green zone is where the price correction may complete, and the price could enter wave F.
The targets are marked on the chart.
A daily candle closing below the invalidation level will invalidate this view.
For risk management, please don't forget stop loss and capital management
Comment if you have any questions
Thank You