In-depth trading ideas

HANA / USDT — Long Accumulation Base & Early Expansion Hey there something is cooking :-)
January 28, 2026
HANA is coming from a very deep drawdown phase and is now showing the first meaningful signs of structural recovery after months of base building near the lows.
This is a classic post-capitulation accumulation setup, where volatility compresses before a potential trend reversal.
🔍 Technical Overview
Current price: ~$0.033–0.034
Price has recently lifted off the absolute bottom, reclaiming short-term structure and printing higher lows for the first time since the downtrend began.
Volume has expanded sharply during the latest push — a key signal that demand is finally stepping in after a long period of apathy.
📊 Market Structure Breakdown
1. Prolonged downtrend & capitulation
HANA spent several months in a persistent downtrend, eventually collapsing into a flat base around $0.010–0.012.
This zone represents:
Maximum pessimism
Forced selling exhaustion
Long-term demand absorption
The flat behavior here strongly suggests capitulation rather than distribution.
2. Multi-week accumulation at the lows
After bottoming, price moved sideways for weeks with:
Extremely low volatility
Declining sell volume
Tight daily ranges
This is typical smart-money accumulation behavior, where positions are built quietly before any expansion.
3. First impulsive reclaim
The recent impulse broke price above:
The base range
Local resistances
Short-term value area
This marks a transition from accumulation to early expansion, not yet a full trend — but an important regime shift.
🧱 Key Levels
Major Support Zones
$0.022–0.025 → first structural support after breakout
$0.010–0.012 → macro bottom / accumulation base
Losing the base would invalidate the setup, but as long as price holds above ~$0.022, structure remains constructive.
Resistance & Upside Targets
$0.034–0.036 → current acceptance zone
$0.054–0.055 → major prior breakdown level
$0.078–0.080 → high-timeframe supply & historical resistance
These levels align with previous inefficiencies created during the distribution phase.
🎯 Outlook & Scenarios
Bullish Case
Hold above $0.030–0.032
Acceptance above $0.036
If confirmed, price could rotate toward $0.054 first, with extension potential toward $0.078 if momentum accelerates.
Bearish / Invalidation
Loss of $0.022
Acceptance back into the base
This would signal that accumulation is incomplete and delay expansion.
🧠 Final Thought
HANA is not in a hype phase — and that’s exactly what makes the structure interesting.
This is an early-stage recovery setup:
Deep base
Clear capitulation
First impulse supported by volume
If continuation follows, HANA could transition from dead-chart behavior to trend development over the coming weeks.
have a nice trading week
Long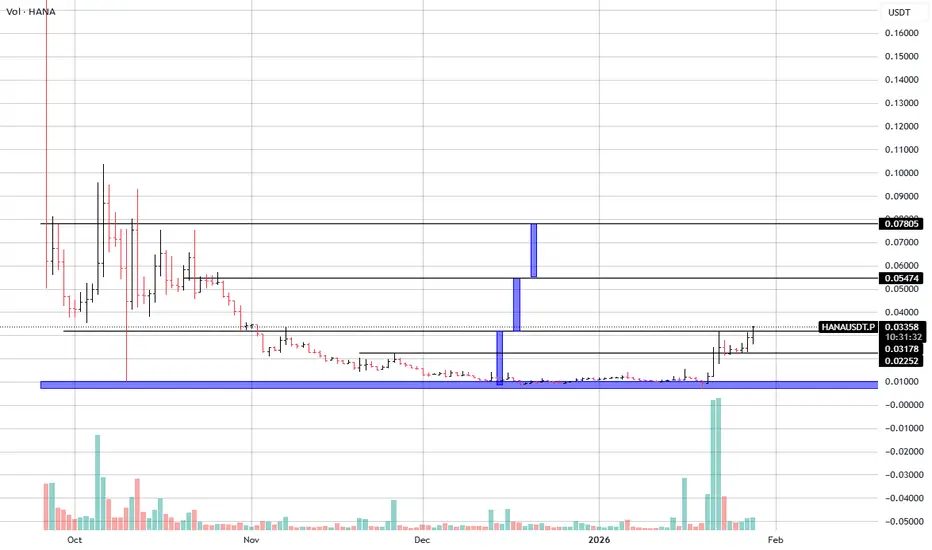 Long
Long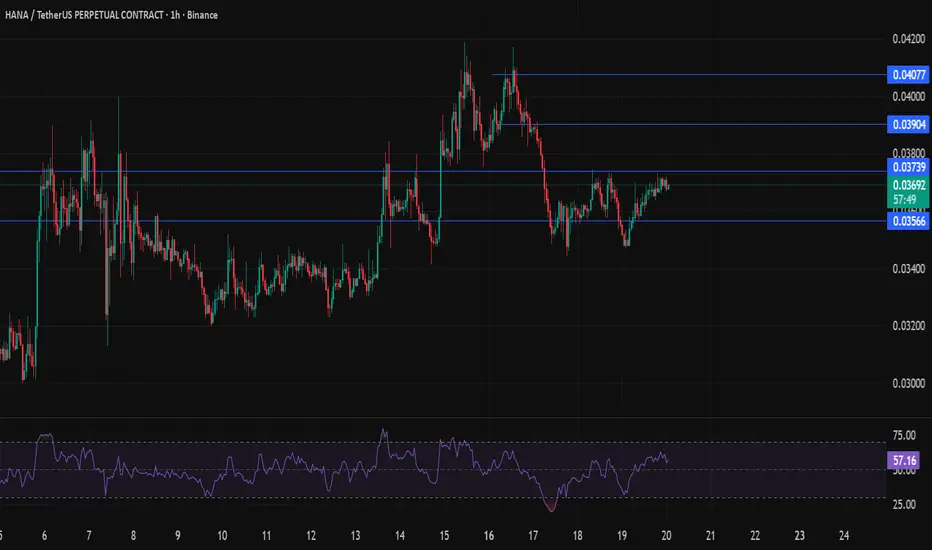
HANA - Descending Trendline Breakout – Potential Impulsive MovePrice has been respecting a long-term descending trendline, forming a clear bearish structure with lower highs. Currently, price is testing this trendline from below after a strong local bounce from support.
If price successfully breaks and holds above the descending trendline, this breakout may trigger an impulsive bullish move , as sellers lose control and breakout traders enter the market. Such a move could quickly turn into a pump , fueled by short covering and momentum buying.
Key confirmation:
Strong bullish candle close above the trendline
Increased volume on the breakout
Successful retest of the trendline as support (optional but ideal)
Targets:
🎯 $0.15 — first major resistance / mid-term target
🎯 $0.20 — extended target if momentum continues
Invalidation:
Rejection from the trendline and continuation below support would invalidate the bullish scenario.
This setup favors breakout and momentum traders watching for a trend reversal from a prolonged downtrend.
Long
HANA READY TO FLYListed on top exchanges, technicals bullish, small MCAP and Volume Huge. Be patient and use proper risk management
Long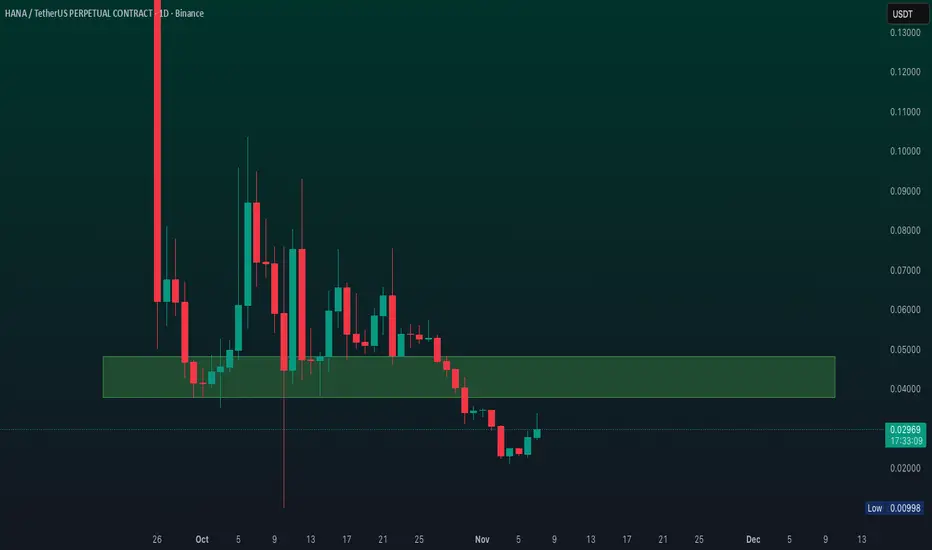
HANAUSDT.P LONG IDEAHİ all, i was watching hanausdt for a while. yellow box seems to me like accoumulationbox and every dip higher from former one. also marketcap of this coin is very very low so i want to try long position on it.
entry : 0.05420
stop : 0.04422
target area : between somewhere 0.07000 - 0.09000
Long
HANA bullrun Another gem in AI sector, once it breaks .09 it will move to .21 fast and once it breaks .21 it will fly like coai and aia
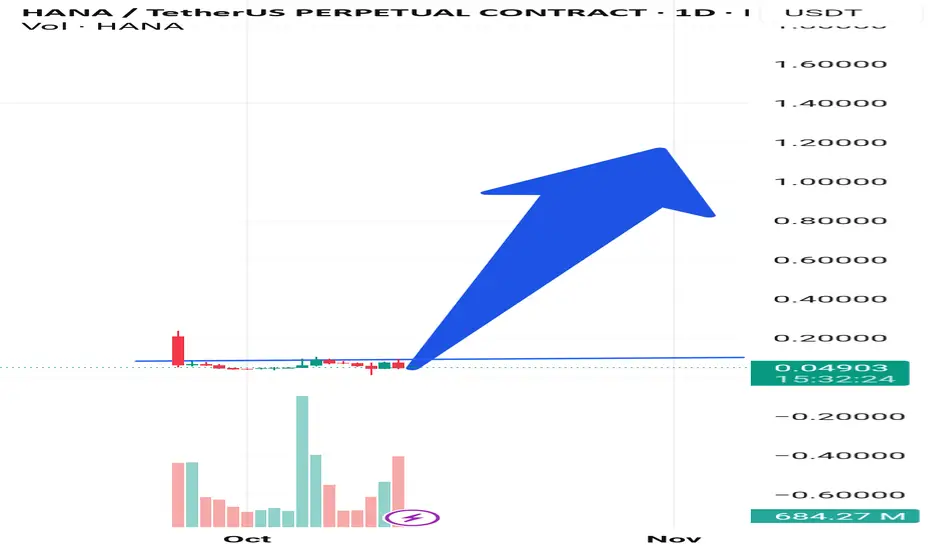
HANA will Become a TOP Performer soon Targeting $1 I am getting a Kind of feeling that HANA will pull COAI kind of Price action, Chart Looks similar like COAI (Before it Pumped from 0.39 to 7$)
I am anticipating that once it Breaks 0.09 Level it will be free ride towards new ATH
break and retest" pattern, targeting higher resistances. Failure below $0.06549 would invalidate this and resume bearish momentum toward $0.044–$0.037.
BUY ZONE:- $0.073 to $0.068
SL :- $0.065
TP-1 $0.09
TP-2 $0.35
TP-3 $1
Disclaimer:- DYOR Not a Financial Advice Financial Markets always Carries huge Risk
Long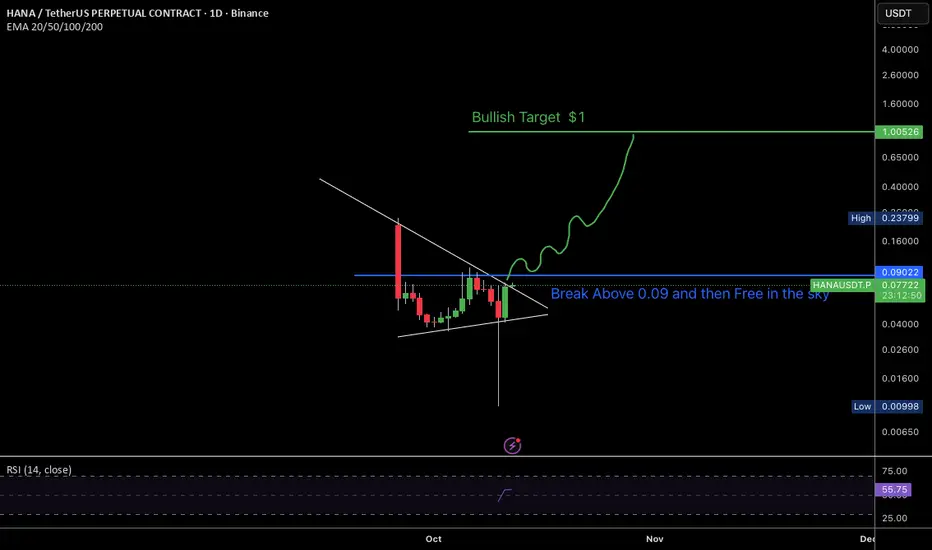
HANA/USDT – 1st Setup Targets Hit, Positioning for 2nd Leg HigheFollowing the success of our first buy setup, where all outlined targets were achieved, HANA is now entering the next accumulation phase, setting the stage for a second bullish setup.
This structure aligns with the classic principle of “buy high, sell higher,” as momentum continues to favor the upside.
Long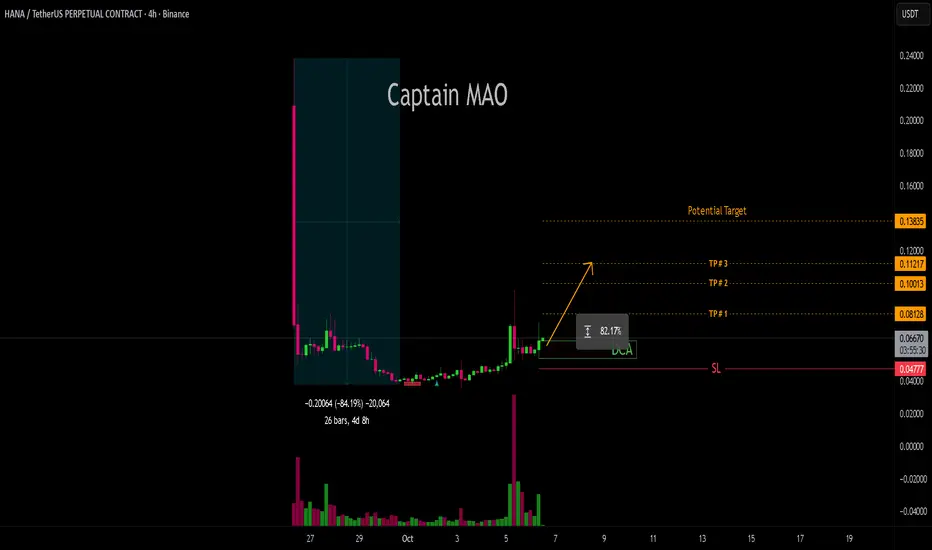
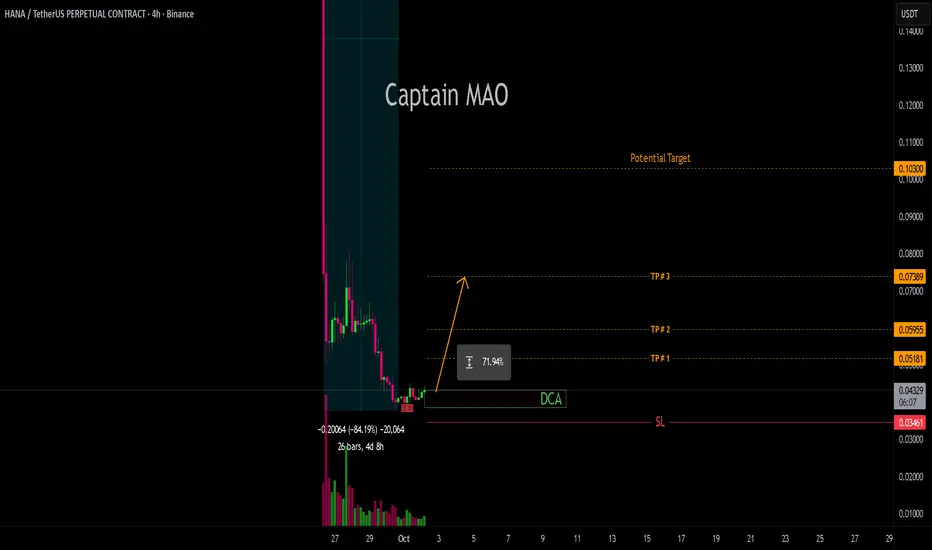
HANA/USDT -85% Drawdown Signals Recovery PotentialAfter suffering a sharp -85% decline from the peak, HANA has finally begun to stabilize, with price action consolidating and forming a strong base of support. This deep reset has cleared paving the way for a potential recovery phase.
The emerging structure suggests accumulation is underway, with buyers defending lows and preparing for a possible trend reversal
Long