$HBAR IS ABOUT TO HIT OUR FIRST TARGET | WHAT COMES NEXT?CRYPTOCAP:HBAR IS ABOUT TO HIT OUR FIRST TARGET | WHAT COMES NEXT?
CRYPTOCAP:HBAR Is Now Trading Near Our First Target At $0.10, Already ~53% Up From Our Original Entry Zone.
The Setup Is Playing Out As Expected.
Watch For: Liquidity Sweep → Reclaim → CHoCH → BOS.
Targets Remain: $0.10 → $0.30 → $0.50 → $0.70 → $1
Invalidation: Weekly Close Below $0.065
No FOMO. Let Structure Confirm.
In-depth trading ideas
HBAR: Altseason High MC Opportunities#HBAR is setting up for a new bullish trend after its decline from the Jan 2025 top. Although the HTF structure isn't the best, the lower & medium timeframes strength is optimistic.
As long as price holds above $0.0648, the first target could be the $0.20 range.
#Hedera
HBAR / HBARUSDT Bullish Setup | Futures Trade IdeaMARKET ANALYSIS
HBAR is currently reacting from a key technical area highlighted on the chart.
As long as the protected support zone remains intact, the bullish market structure remains valid and higher liquidity targets may continue to attract price action.
A breakdown below the invalidation level would weaken the current bullish scenario and require a reassessment of market conditions.
📍 Entry, Stop Loss and Take Profit levels are marked directly on the chart.
━━━━━━━━━━━━━━
⚠️ DISCLAIMER
This publication is provided solely for educational and market observation purposes.
Nothing contained in this analysis should be considered financial advice, investment advice, or a recommendation to buy or sell any financial instrument.
All trading and investment decisions remain solely the responsibility of the individual trader.
Always conduct your own research and apply proper risk management before entering any position.
━━━━━━━━━━━━━━
🎯 PARALOG
▪️Crypto Market Analysis
▪️BTC Futures Signals
▪️Bitcoin & Altcoin Market Analysis
Precision • Momentum • Timing
━━━━━━━━━━━━━━
Exchange: #MEXC Futures
#bitcoin #btc #crypto #futures #technicalanalysis
HBARUSDT — LONG Setup From a Compact Base With Tight InvalidatioHBAR is another asset where I prefer waiting for a pullback instead of buying after the expansion has already happened.
The area I’m watching is the previous base around:
Entry 1: 0.07407
Entry 2: 0.07300
Invalidation: 0.07140
Risk: 1% total
Potential: roughly 2–17% clean price movement
Before the recent rally, price spent several sessions holding this area. Sellers repeatedly failed to push and hold below the base, and once buyers took control, HBAR expanded quickly toward 0.08–0.083.
A retest of that origin gives us a much cleaner risk structure.
What I like most here is the tight invalidation. If price returns to the base but then trades decisively below it, there is little reason to stay attached to the LONG scenario.
The plan:
retest the base → hold → continuation higher.
If both limits are filled, I’ll bring the first take-profit closer to reduce risk faster.
CRYPTOCAP:HBAR #HBARUSDT
hbarusdt longInstructions:
Entry point: yellow
Stop loss: red
Take profit: green
👉Leverage x 5-10-20 for crypto
👉Leverage x 20-50-100 for commodities, stocks, indices, and forex
👉Margin 1-5% max.
Always practice risk and money management.
Invest a maximum of 5% on any trade or across all your trades.
Invest only what you can afford to lose, as no one is in control of the market.
👉Our analyses are primarily based on:
breakouts: two trend lines (ascending and descending) and a line indicating a horizontal breakout.
chart patterns: shoulders and head, triangle parttern, elliott impulse, etc etc.
We don't always have the time to track them at all times or to represent them visibly, given the numerous signals, the number of channels to manage, and especially because of the often rapid pace of market movements.
indicators: We associate at least two indicators with this technique.
👉Depending on the circumstances, we use specific indicators, often setting 3 or more take profit levels.
👉Indeed, there are good days in trading and also bad days. No one can promise to win every trade, and like all traders worldwide, we also experience stop-loss orders. However, we win more than we lose and remain positive.
👉You can close the position before or after the take profit orders indicated by the green lines if you are personally satisfied; the same applies to stop loss orders.
👉We must stay positive, clear-headed, and humble.
we cannot provide all instructions or all trades here on this channel.
Good luck to us all, and may God guide us. Amen.
hbarusdt shortInstructions:
Entry point: yellow
Stop loss: red
Take profit: green
👉Leverage x 5-10-20 for crypto
👉Leverage x 20-50-100 for commodities, stocks, indices, and forex
👉Margin 1-5% max.
Always practice risk and money management.
Invest a maximum of 5% on any trade or across all your trades.
Invest only what you can afford to lose, as no one is in control of the market.
👉Our analyses are primarily based on:
breakouts: two trend lines (ascending and descending) and a line indicating a horizontal breakout.
chart patterns: shoulders and head, triangle parttern, elliott impulse, etc etc.
We don't always have the time to track them at all times or to represent them visibly, given the numerous signals, the number of channels to manage, and especially because of the often rapid pace of market movements.
indicators: We associate at least two indicators with this technique.
👉Depending on the circumstances, we use specific indicators, often setting 3 or more take profit levels.
👉Indeed, there are good days in trading and also bad days. No one can promise to win every trade, and like all traders worldwide, we also experience stop-loss orders. However, we win more than we lose and remain positive.
👉You can close the position before or after the take profit orders indicated by the green lines if you are personally satisfied; the same applies to stop loss orders.
👉We must stay positive, clear-headed, and humble.
we cannot provide all instructions or all trades here on this channel.
Good luck to us all, and may God guide us. Amen.
HBAR – Major Support Ahead!HBAR has been moving lower in a correction phase, but price is now approaching an important area on the weekly chart.
The key zone is the intersection between the rising lower trendline and the major demand zone highlighted in green.
This creates a strong area of confluence where buyers could potentially step back in.
As long as this intersection continues to hold, we will be looking for trend-following long setups, anticipating another bullish move from the lower boundary of the broader structure.
📌 The lower trendline + demand zone is the key area to watch.
⚠️ Disclaimer: This analysis is for educational purposes only and does not constitute financial advice. Always manage your risk and wait for proper confirmation before entering a trade.
📚 Stick to your trading plan regarding entries, risk, and management.
Good luck! 🍀
All Strategies Are Good; If Managed Properly!
~Richard Nasr
HBAR at the Turning Point — Breakout or Rejection?📊 Technical Analysis — HBAR/USDT
EURONEXT:HBAR remains within a long-term bearish structure on the 3D timeframe, with price trading below the Descending Trendline, which has acted as dynamic resistance since the high around $0.3050.
📐 This Descending Trendline has repeatedly limited bullish price action and maintained a series of lower highs. Price is now approaching this trendline again, making it a key decision zone for the next major move.
Current price is around $0.075–$0.078, while the major low on the chart is around $0.06436.
---
📐 Pattern — Descending Trendline
🔻 The Descending Trendline represents consistent selling pressure, characterized by a series of Lower Highs.
📉 As long as price remains below the trendline, the overall structure can still be considered bearish.
⚠️ However, the more often a resistance level is tested, the more significant a confirmed breakout can become. If EURONEXT:HBAR manages to achieve a 3D candle close above the trendline, the bearish structure could potentially shift toward a bullish reversal.
---
🟢 BULLISH SCENARIO
🚀 Bullish confirmation: EURONEXT:HBAR breaks above the Descending Trendline and achieves a strong candle close above it.
📈 This breakout would be an early indication that sellers are losing control and that the long-term bearish structure could potentially transition into a reversal.
🎯 Potential Upside Levels
1️⃣ $0.0850 — First resistance
2️⃣ $0.0950 — Next resistance
3️⃣ $0.1040 — Important breakout zone
4️⃣ $0.1290 — Major resistance
5️⃣ $0.1480 — Strong resistance
6️⃣ $0.1650 — Major recovery target
7️⃣ $0.1970 — Major long-term resistance
🔥 If bullish momentum strengthens and these resistance levels are successfully broken, the $0.1290–$0.1970 area could become a very interesting recovery zone.
---
🔴 BEARISH SCENARIO
⚠️ If EURONEXT:HBAR is rejected by the Descending Trendline, the bearish structure remains valid.
📉 A rejection from the trendline could push price back toward the nearest support levels:
🔻 $0.0775 — Immediate support / current structure
🔻 $0.0750 — Key short-term support
🔻 $0.06436 — Major swing low
💥 If $0.06436 decisively loses support, bearish pressure could intensify and potentially lead to the formation of a new lower low.
---
⚔️ KEY LEVELS TO WATCH
📌 Resistance: Descending Trendline
📌 $0.0850: First bullish obstacle
📌 $0.0950–$0.1040: Important resistance cluster
📌 $0.1290: Major breakout target
📌 $0.1480–$0.1650: Major recovery zone
📌 $0.1970: Long-term resistance
📌 $0.0750: Critical short-term support
📌 $0.06436: Major bearish support / key level
---
🧠 MARKET OUTLOOK
🔴 Current bias: Bearish until confirmed breakout
EURONEXT:HBAR remains below the Descending Trendline, so there is no full confirmation of a structural reversal yet.
🟢 A confirmed breakout above the trendline could initiate a significant bullish recovery toward $0.085 → $0.104 → $0.129 and potentially higher.
🔴 Conversely, a rejection from the trendline + breakdown below $0.0750 could maintain the bearish structure and send price back toward $0.06436.
🎯 The Descending Trendline is the key level that will determine whether HBAR continues its bearish trend or begins a larger trend reversal.
---
🔥 HBAR — THE BREAKOUT ZONE IS APPROACHING
Watch the trendline.
Wait for confirmation.
Trade the breakout, not the prediction. 📊⚡
#HBAR #Hedera #HBARUSDT #Crypto #CryptoAnalysis #TechnicalAnalysis #Altcoins #CryptoTrading #PriceAction #Trendline #Breakout
HBARUSDT SHORTInstructions:
Entry point: yellow
Stop loss: red
Take profit: green
👉Leverage x 5-10-20 for crypto
👉Leverage x 20-50-100 for commodities, stocks, indices, and forex
👉Margin 1-5% max.
Always practice risk and money management.
Invest a maximum of 5% on any trade or across all your trades.
Invest only what you can afford to lose, as no one is in control of the market.
👉Our analyses are primarily based on:
breakouts: two trend lines (ascending and descending) and a line indicating a horizontal breakout.
chart patterns: shoulders and head, triangle parttern, elliott impulse, etc etc.
We don't always have the time to track them at all times or to represent them visibly, given the numerous signals, the number of channels to manage, and especially because of the often rapid pace of market movements.
indicators: We associate at least two indicators with this technique.
👉Depending on the circumstances, we use specific indicators, often setting 3 or more take profit levels.
👉Indeed, there are good days in trading and also bad days. No one can promise to win every trade, and like all traders worldwide, we also experience stop-loss orders. However, we win more than we lose and remain positive.
👉You can close the position before or after the take profit orders indicated by the green lines if you are personally satisfied; the same applies to stop loss orders.
👉We must stay positive, clear-headed, and humble.
we cannot provide all instructions or all trades here on this channel.
Good luck to us all, and may God guide us. Amen.
Hedera (HBAR), always bullish: 1,000% profits potential"The top performers." See how some projects are moving nicely and strongly while many others are staying behind. How to spot the ones that are moving strongly before they move?
How do I know HBAR (Hedera) will grow?
HBARUSDT has a long-term bullish structure, it has been rising since December 2022. An uptrend is already present on the chart, higher highs and higher lows.
This much tells me that this project is on track to a new high to match those that moved first. If the chart was bearish, anything goes. It can continue to consolidate at support, move lower, etc. Not all pairs and projects move in the same market phase.
The market is really big so the altcoins move in groups. Some do better than others.
This chart setup shows great potential for growth. Others with lower lows, very low volume, no trading activity, etc., can be ignored in favor of those with better technical conditions, if you are actively trading of course.
If you are an investor, a holder, then going for a sound strategy is the best choice, picking projects with huge potential, others that are stable, others that can move fast, others that can work as a hedge and it goes on.
HBARUSDT is showing a huge falling wedge on the weekly timeframe. Last week broke the wedge pattern but not fully, the trendline can be drawn in a way that the last candle that closed remains inside the pattern. But, we have the triple lower low sequence which is a bullish development.
Between October 2025 and August 2026 we have three main lows. Each lower low produced lower volume and each new low remained closer to the previous one. This reading shows a waning bearish wave. The bullish breakout then supports and confirms the previous assumption that the bearish wave was ending.
Marketwide action
Look around, what do you see?
I see Bitcoin trading at $80,000 and Ethereum at $2,500. I see projects growing 100% within a day with many more breaking bullish every single hour.
I see billions worth of SHORT positions being liquidated, the first time in years, signaling that the bulls are in. This signal shouldn't be ignored.
I see all the ground gained being maintained. Not even a very small retrace after a huge advance. Green next week right away and that is what I am trying to warn you about, prepare you for. It makes all the difference if you can enter the market before a bullish jump. Never after, always before the action starts.
A new all-time high
The first target at $0.27 is a very easy one because it sits within the previous wave range, that is, hitting this target would mean a lower high, the resistance zone from July 2025; that's the minimum on the way up.
Since we have long-term higher lows, August 2026 vs November 2024 vs December 2022, we can expect to see a higher high next. Since we have long-term higher highs, February 2023 vs April 2024 vs December 2024, we can expect a new one in the coming months.
This is how I know Hedera will grow, it is all based on the chart technicals and structure. It is based on what is happening now, what happened in the past and what the rest of the market is doing. And this gives us a 666% target at $0.61. After this final target, we can expect HBAR to keep growing and hit a new all-time high, with the usual pauses, retraces and corrections along the way.
The goal is not to predict the timing nor the exact level at which the bullish cycle will end; the goal is to buy low and hold, the goal is to buy-the-bottom before the market grows.
Namaste.
HBAR Price Is at a Crucial Level as Yen Risks Meet a Bottom* HBAR remains more than 90% below its all-time high, but the $0.062–$0.067 area is showing signs of stabilization.
* A break above $0.06768 could strengthen the recovery case, with $0.070–$0.075 and $0.10570 as key levels ahead.
* CoinCodex’s 1-month forecast places the HBAR price near $0.09978, pointing to further upside from current levels.
The HBAR price is starting to get interesting again after spending months under heavy pressure. Hedera is still sitting more than 90% below its all-time high, but the selling has slowed down noticeably, and the $0.065-$0.067 area is beginning to look like an important battleground between buyers and sellers.
What makes the situation even more interesting is that HBAR isn't just dealing with crypto-specific factors. Traders are also watching the Japanese yen closely because a stronger yen can trigger deleveraging across financial markets, which often puts extra pressure on risk assets like altcoins.
We took a look at the charts, and while the bigger trend is still bearish, there are a few signs that things may be stabilizing. On the daily timeframe, HBAR remains below its 100-day moving average around $0.0767, so bulls haven't regained full control yet. However, on the 4-hour chart, the price has been forming higher lows after bouncing from the $0.062 support area, while the RSI has managed to climb back above the neutral 50 level.
The level everyone seems to be watching right now is $0.06768. That's where the 4-hour 100-period moving average sits, and it's acting as the first major hurdle for buyers. If HBAR can break above that level and hold, the next targets come into view around $0.070-$0.075, followed by the much larger resistance zone near $0.1057.
Another encouraging detail is that HBAR's market cap has stopped falling aggressively. Instead of making fresh lows, the market has been moving sideways near historically depressed levels. That doesn't confirm a bottom, but it does suggest that selling pressure may be starting to fade.
CoinCodex's one-month forecast currently places the HBAR price near $0.09978, which indicates there could still be meaningful upside if buyers manage to regain momentum.
HBAR/USDT H2: Pressure at lows before recovery🎯 TP1: $0.065693 (+0.63%) │ TP2: $0.066105 (+1.26%)
🛑 SL: $0.064530 (-1.15%) │ R/R: 1 : 1.1
⚠️ SL is placed beyond the nearest candle tails to reduce the risk of accidental triggering
FUNDAMENTAL BACKGROUND
HBAR is under pressure following Grayscale's withdrawal of ETF applications, which dampened institutional demand expectations. The lack of fresh project news and the weak overall altcoin backdrop exacerbate the situation. Geopolitical tensions around the Strait of Hormuz add caution, which is negative for risk assets. No significant macro releases are expected in the coming days, leaving the price influenced by technical factors.
TECHNICAL PICTURE
The price is in the lower 20% of the range ($0.064900–$0.070060), testing the recent low. ADX 38.4 indicates a strong trend with sellers dominating, but proximity to the key support at $0.064900 creates potential for a rebound. EMA 20 and EMA 50 converge at $0.07, forming a resistance zone. MACD and VWAP show neutral dynamics without a clear bias.
PROBABILITY MODEL
Probability of bullish continuation — 35%, flat — 35%, bearish reversal — 28%. The model assesses confidence at 50%, given conflicting signals: a strong downtrend versus proximity to historical support.
DIRECTION
🟢 BUY — testing the key support at $0.064900 creates potential for a rebound.
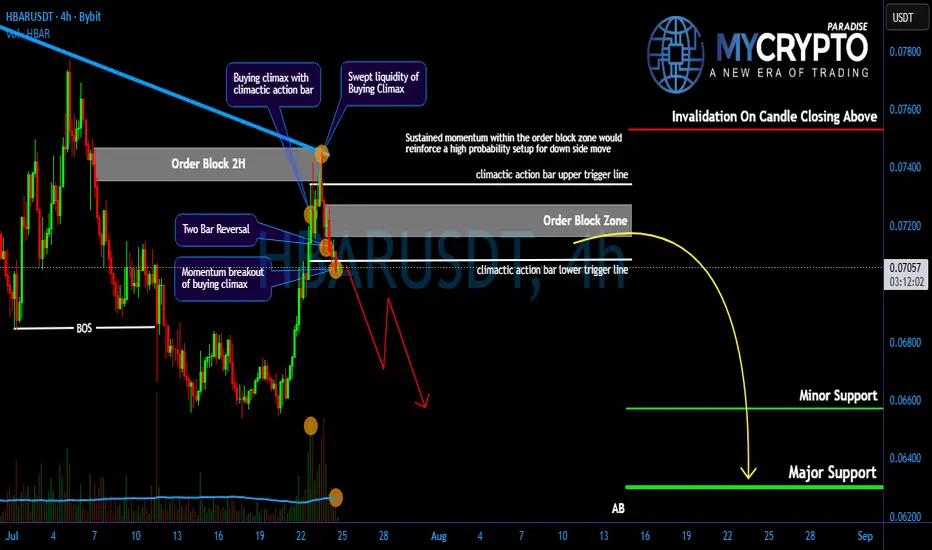
HBAR Bearish Structure Remains Intact…!Yello Paradisers! Are you prepared for a potential sharp downside move on #HBAR, or are you still calling this “just a healthy pullback” while smart money quietly distributes above you? At first glance, the structure may look harmless. But when we remove emotions and read the chart objectively, the story changes completely. This is not a random retracement. This is a high-risk zone where discipline matters more than opinions.
💎#HBAR has clearly respected the descending resistance trend-line and failed to break above it. This rejection is a key probability of ongoing structural weakness. At the same time, Overall structure is bearish and price mitigate the order block zone of 2-hour time frame during the retracement.
💎As long as price holds momentum within the order block zone the probability favors continuation lower. The immediate minor support sits around 6570, which now acts as the first downside magnet if selling pressure persists.
💎From Volume Spread Analysis perspective, the sequence is even more revealing. We saw a buying climax followed by a climactic action bar. This combination typically shows distribution. In simple terms, institutions use these aggressive spikes to offload positions into retail enthusiasm. When the crowd feels confident, smart money distributes quietly.
💎#HBAR swept the upper trigger line of the buying climax but failed to sustain higher levels, followed by a candle breaking below the lower trigger line. We also observed a two-bar reversal pattern forming inside the trigger lines of the climactic action bar. This is a classic confirmation that supply is dominating. If bearish momentum continues, the next probability of major downside target sits around 6300 and it could be reached sooner than most expect.
💎If #HBAR manages to break above the key resistance at 7530 with a strong momentum candle, this whole bearish probability would be invalidated, and we could instead see a bullish continuation. As always, we let price confirm our bias.
Discipline is key, Paradisers! The charts may look volatile, but this is where professionals thrive and amateurs panic. Don’t let emotions guide your trades. Wait for clear confirmation and manage risk like a pro. Strive for consistency, not quick profits. Treat the market as a businessman, not as a gambler.
MyCryptoParadise
iFeel the success🌴
HBAR - Major Demand Zone — Reversal or Breakdown?📊 Technical Analysis — $HBAR/USDT
⏳ Time Frame: 1W (Weekly)
💰 Current Price: ~$0.06636
🟨 Major Support / Demand Zone: $0.0475 – $0.0375 🟨
---
🔎📊 MARKET STRUCTURE
📉 HBAR remains in a long-term corrective/downtrend structure, characterized by a sequence of lower highs and lower lows following the major highs formed during 2024–2025.
⚠️ However, price is now approaching an extremely important historical demand area around $0.0475–$0.0375. 🟨🔥
🟨 This zone has previously acted as a strong accumulation/support area, making it one of the most important regions to monitor on the weekly chart. 👀📊
📌 The current price around $0.06636 is still above this demand zone, meaning HBAR has not yet reached the strongest support area shown on the chart.
---
🧩📐 PATTERN / STRUCTURE
📉 Long-Term Descending Structure
The chart currently shows a broad bearish corrective structure with:
🔻 Lower Highs
🔻 Lower Lows
🔻 Persistent Selling Pressure
🔻 Gradual Decline Toward Historical Support
📌 However, the decline is now bringing price closer to a major historical demand zone. 🟨
💡 Key Observation: A strong reaction from the $0.0475–$0.0375 zone could potentially mark the beginning of a larger reversal or accumulation phase. 🔄📈
---
🟢🚀 BULLISH SCENARIO
🟢 Primary Bullish Area: $0.0475 – $0.0375 🟨🔥
If HBAR enters this zone and buyers begin absorbing the selling pressure, a significant relief rally could potentially develop. 📈💪
📈 A bullish scenario would become stronger if:
✅ Price enters the yellow demand zone 🟨
✅ Selling pressure begins to weaken 📉➡️📉
✅ A weekly bullish reversal candle forms 🕯️🟢
✅ Price establishes a higher low 📈
✅ HBAR breaks back above important previous resistance levels 🚀
✅ The long-term lower-high structure begins to break 🔓📈
🚀 If the demand zone holds strongly, the chart could potentially begin a larger recovery toward the $0.08–$0.11 region initially. 🎯📈
🎯 A sustained breakout above the $0.10–$0.11 area would provide a much stronger confirmation that the broader bearish structure is weakening. 💪🟢
---
🔴⚠️ BEARISH SCENARIO
🔴 The bullish setup is NOT confirmed yet. ⚠️
If HBAR breaks decisively below the $0.0375 support level on the weekly timeframe, the historical demand zone would be considered invalidated. ❌🟨
⚠️ This could indicate:
🔻 Continuation of the long-term downtrend 📉
🔻 New Lower Lows ⬇️
🔻 Increased Selling Pressure 🩸
🔻 Potential Search for a New Historical Support Area 🔎
🚨 Therefore, $0.0375 is the critical downside boundary of the yellow zone.
---
🟨🔥 KEY ZONE TO WATCH
🟨 $0.0475 – $0.0375 🟨
🔥 This is the most important area on the chart right now. 👀
Rather than chasing price while HBAR is still above the zone, traders should closely monitor how price behaves when/if it reaches this historical demand area. 📊🔎
📌 Zone Holds → 🟢 Reversal Potential Increases
📌 Zone Breaks → 🔴 Bearish Continuation Risk Increases
---
📈🗺️ POTENTIAL ROADMAP
💰 $0.06636 Current Area
⬇️
🟨🔥 $0.0475 – $0.0375 Demand Zone
⬇️
🟢📦 Potential Accumulation / Reversal
⬆️
🎯🚀 $0.08 – $0.11 Initial Recovery Area
📌 This is a scenario-based technical projection, not a guaranteed price path. ⚠️
---
🧠📌 CONCLUSION
🟡 HBAR is approaching a historically important support area, but the reversal has NOT been confirmed yet.
🟨 The $0.0475–$0.0375 zone is the key area to watch. 👀🔥
🟢 A strong weekly reaction from this region could create a potentially attractive long-term reversal setup. 📈🚀
🟢 Bullish Confirmation:
💥 Strong reaction + Higher Low + Breakout of the descending structure.
🔴 Bearish Confirmation:
💥 Weekly breakdown below $0.0375.
🔥 The reaction around the yellow zone could determine HBAR's next major directional move. 📈⚡📉
⚠️ Technical analysis is based on chart structure and scenarios; it is not a guarantee of future price movement.
---
#HBAR #Hedera #HBARUSDT #Crypto #CryptoAnalysis #TechnicalAnalysis #CryptoTrading #Altcoins #AltcoinSeason #HederaHashgraph #CryptoMarket #Bullish #Bearish #Support #Resistance
HBAR: Returning to an Area Where Buyers Have Historically Steppe**Back Into Historical Support
HBAR appears to be returning to the $0.065-$0.035 region, an area that has repeatedly attracted buyers since late 2019. Several major lows have formed within this zone, giving it considerable long-term significance.
**A Dramatic Fall From the 2025 High
Price now sits around 83% below its January 2025 high at $0.4013. The subsequent decline has left HBAR trading close to levels seen long before the latest bull-market advance.
**Long-Term Momentum Remains Bearish
HBAR remains below the bearishly sloped 10-Month EMA, while monthly RSI continues to sit below 50. Despite reaching historical support, there is little evidence yet that the broader bearish momentum has reversed.
**Initial Resistance Remains Overhead
Any meaningful recovery would first need to contend with resistance around $0.1099. Reclaiming this area and the falling 10-Month EMA would provide a much stronger indication that buyers are beginning to regain control.
**In Summary
If history is anything to go by, HBAR is approaching an area that has repeatedly attracted buyers, with the $0.065-$0.035 zone providing support on several occasions since 2019. Of course, nothing can be taken for granted. HBAR remains around 83% below its January 2025 high and beneath the falling 10-Month EMA. The question now is whether buyers step in once again, or whether this historically important support zone finally gives way.
$NBAR: Large players building longs at monthly support🚀 BYBIT:HBARUSDT.P
$NBAR price is approaching the monthly support level 📊M-Levels $0.05700–$0.06500, which is a zone of institutional interest.
🧩IMA shows large players are already starting to build long positions, confirming an expected market reversal from this level.
🟡 Preliminary plan:
🟢 Long part 1: range $0.06050–$0.06500 upon 🧩IMA signal confirmation.
🟢 Long part 2: range $0.05700–$0.06050.
🔴 Stop: $0.05400 below the liquidity zone.
Analysis from me — execution from you 🚀
Analysis powered by IMA (Integrated Market Analysis)
📊M-Levels — Institutional Interest Levels
⚠️ Platform restrictions limit the publication of closed indicators. I display only the output of the 📊Levels algorithm.
#HBAR/USDT Ready to go up#HBAR
The price is moving within a descending channel on the 1-hour timeframe and has reached the lower boundary. It is now poised for a bounce and is expected to retest this boundary.
The Relative Strength Index (RSI) indicates a downward trend, which is likely to continue given the overbought conditions.
There is a key support zone in green at 0.06678, and the price has bounced off this zone several times, making it a strong support level.
The price is trending towards the 100-period moving average, which we are approaching. This trend supports an upward move.
Entry Price: 0.06830
Target 1: 0.06876
Target 2: 0.06927
Target 3: 0.06987
Stop Loss: At the resistance zone in green
Remember this simple rule: Money management.
Any questions? Please leave a comment.
Thank you.
HBAR Bottoming Structure ?HBAR is currently trading at a crucial daily support level where a potential bottoming structure is beginning to develop.
After an extended corrective phase, price has reached an area where buyers have previously shown strong interest, making this an important region to determine the next directional move. Holding above current support would suggest that selling pressure is fading and that accumulation is beginning to take place.
The key focus now is whether HBAR can maintain this support and reclaim the current Value Area Low (VAL). Successfully reclaiming this level would strengthen the technical outlook by confirming that buyers are regaining control of the market. Such a move would increase the probability of a rotational rally toward the daily resistance zone as price transitions from the lower end of the value range back toward its upper boundaries.
Rather than expecting an immediate breakout, the higher-probability scenario is a gradual rotational move higher as market participants rebuild bullish momentum. This type of price action is common after prolonged corrections, where consolidation at support creates the foundation for the next impulsive advance.
As long as HBAR continues to trade above this critical support region, the short-term outlook remains constructive. A successful defense of current levels and a reclaim of the Value Area Low would reinforce the bullish scenario and favor continued upside toward higher daily resistance in the sessions ahead.
Hedera (HBAR) Life Cross, not what you thinkA Life Cross has printed on the above 6 day chart after an explosive 700% rally.
A Life cross is often seen as a positive development for fans of moving averages. However a word of caution is advised, moving averages do not inform about the future, they inform you only of what has been.
A number of reasons now exist to be bearish on HBAR, they include:
1) Past RSI support confirms resistance.
2) Price action is at monthly resistance. Look left.
3) Regular bearish divergence. Just as before look left, you think this time is different?
4) All tradingview.com ideas are long:
www.tradingview.com
This will be the only short idea you’ll be reading tonight. Remember the the 90% are here to lose money, are you?
Is it possible for price action to continue up after 700%? Sure.
Is it probable? No.
Ww
Hbar usdt 4h It seems that the downward momentum of (Hbarusdt) is decreasing and the formation of a higher floor is a sign of the presence of buyers. The volume also confirms this trend. With the breaking of the downward trend line and the trigger of 0.07425; It can be expected that the price will touch the specified targets.
HBAR USDT LONG SIGNAL#126. HBAR/USDT – Trade Setup (LONG)
📈 Position Type: LONG
🕒 Timeframe: 1H
📊 Market: Futures
💰 Entry Zone:
0.06891
🛑 Stop-Loss:
0.06650
🎯 Take-Profit Targets:
• TP1: 0.07093
• TP2: 0.07352
• TP3: 0.07620
• TP4
⚙️ Leverage:
5 *10
▫️ After TP1, move SL to Entry + 0.2%.
▪️ Exit Plan:
• 50% at TP1
• 25% at TP2
• 25% at TP3
📌 Risk Management:
Risk only 1–2% of your capital per trade.
⚠️ Always check and confirm the setup on your chart before entering the trade.