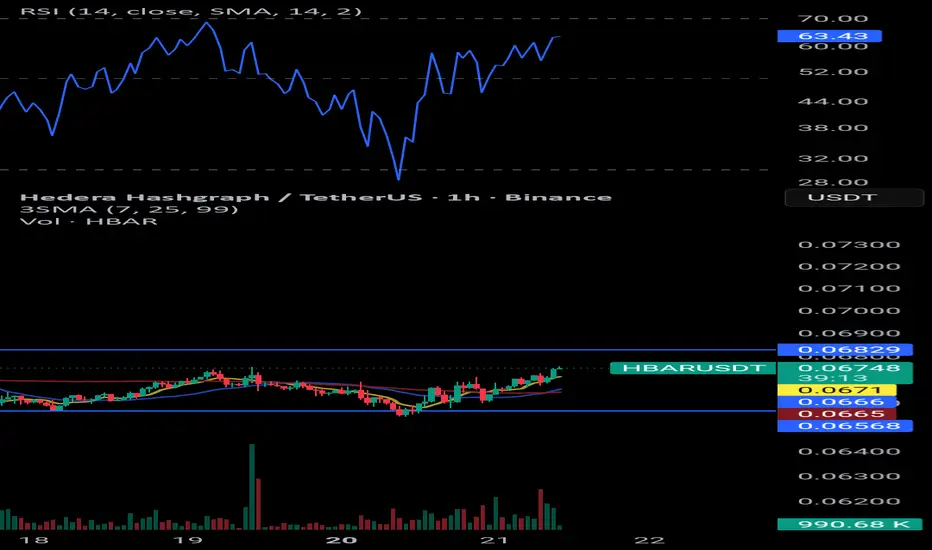
HBARUSDT HBARUSDT is currently trading within a range, with resistance at 0.06829 and support at 0.06660. The price is now moving toward the upper boundary of the range with increasing volume, indicating growing bullish momentum. Notably, at the beginning of this move, the price performed a fake breakout below the range support before quickly reclaiming it, suggesting a liquidity sweep and a possible continuation toward the range high.
A confirmed breakout and close above 0.06829 could open the way for further upside, while rejection from the range resistance may lead to another move back toward the support. As always, wait for confirmation and apply proper risk management.
In-depth trading ideas
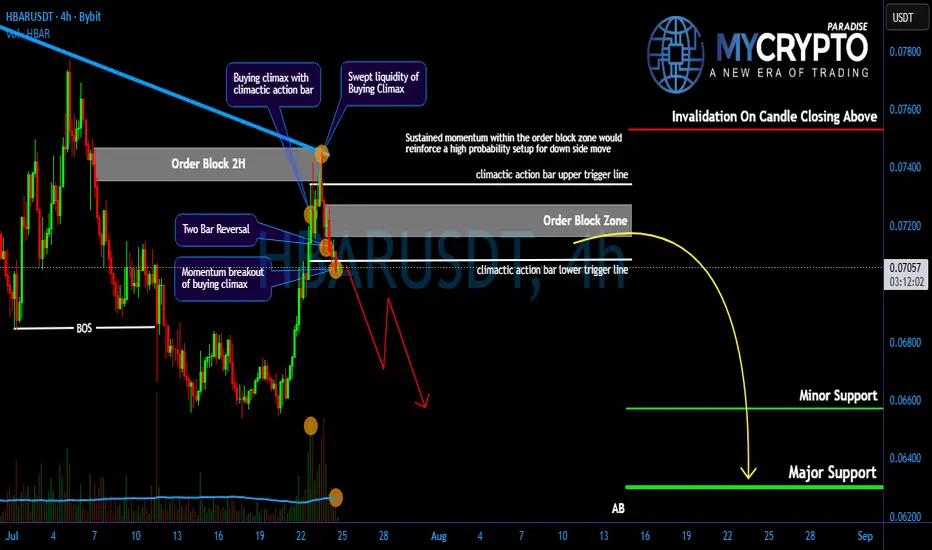
HBAR Bearish Structure Remains Intact…!Yello Paradisers! Are you prepared for a potential sharp downside move on #HBAR, or are you still calling this “just a healthy pullback” while smart money quietly distributes above you? At first glance, the structure may look harmless. But when we remove emotions and read the chart objectively, the story changes completely. This is not a random retracement. This is a high-risk zone where discipline matters more than opinions.
💎#HBAR has clearly respected the descending resistance trend-line and failed to break above it. This rejection is a key probability of ongoing structural weakness. At the same time, Overall structure is bearish and price mitigate the order block zone of 2-hour time frame during the retracement.
💎As long as price holds momentum within the order block zone the probability favors continuation lower. The immediate minor support sits around 6570, which now acts as the first downside magnet if selling pressure persists.
💎From Volume Spread Analysis perspective, the sequence is even more revealing. We saw a buying climax followed by a climactic action bar. This combination typically shows distribution. In simple terms, institutions use these aggressive spikes to offload positions into retail enthusiasm. When the crowd feels confident, smart money distributes quietly.
💎#HBAR swept the upper trigger line of the buying climax but failed to sustain higher levels, followed by a candle breaking below the lower trigger line. We also observed a two-bar reversal pattern forming inside the trigger lines of the climactic action bar. This is a classic confirmation that supply is dominating. If bearish momentum continues, the next probability of major downside target sits around 6300 and it could be reached sooner than most expect.
💎If #HBAR manages to break above the key resistance at 7530 with a strong momentum candle, this whole bearish probability would be invalidated, and we could instead see a bullish continuation. As always, we let price confirm our bias.
Discipline is key, Paradisers! The charts may look volatile, but this is where professionals thrive and amateurs panic. Don’t let emotions guide your trades. Wait for clear confirmation and manage risk like a pro. Strive for consistency, not quick profits. Treat the market as a businessman, not as a gambler.
MyCryptoParadise
iFeel the success🌴
HBAR: Bears Tighten Their GripKey Support Gives Way
HBAR has now broken below both the $0.072 support and the 0.786 Fibonacci level at $0.0676. Losing these levels reinforces the existing bearish structure and shifts attention towards the next major support lower down.
Long-Term Trend Remains Bearish
The 21/8-week EMAs remain bearishly crossed, with both moving averages continuing to slope lower. Until price can reclaim these averages, rallies are likely to be viewed as relief bounces within the broader downtrend.
Momentum Favours the Bears
RSI remains below the 50 level, highlighting that bearish momentum is still dominant. Meanwhile, the StochRSI is approaching oversold territory, suggesting downside momentum is becoming stretched but not yet reversing.
$0.13 Remains the Key Level
The former support/resistance zone around $0.13 continues to be the most important area for bulls to reclaim. Multiple reactions have occurred there previously, making it the first meaningful level that could begin to shift sentiment.
In Summary
HBAR continues to weaken after breaking beneath another important support level, with the bearishly crossed weekly EMAs and momentum indicators still favouring the downside. While the market is becoming increasingly oversold, the technical picture is unlikely to improve until bulls can reclaim the major $0.13 support/resistance zone.
HBARUSDT 1D#HBAR is trading within a falling wedge pattern on the daily timeframe. Both the RSI and MACD are showing signs of strengthening bullish momentum. A confirmed breakout above the wedge resistance and the 50-day EMA could trigger a move toward the following upside targets:
🎯 $0.08526
🎯 $0.09724
🎯 $0.10693
🎯 $0.11661
🎯 $0.13039
🎯 $0.14795
⚠️ Always use a tight stop-loss and apply proper risk management.
FOX Journal #11 | HBARUSDT.P | Breakout ContinuationHBARUSDT.P presented a clean breakout continuation after reclaiming resistance and maintaining bullish market structure. Momentum remained strong while price respected the trend, making this one of the highest-quality opportunities identified during my market scan.
Shortly after publishing the analysis, price broke out and accelerated toward the projected target without offering another entry.
FOX Journal is my personal trading journal where I document real-time market analysis, both executed trades and missed opportunities, while continuously refining my trading process.
HBAR USDT LONG SIGNAL#126. HBAR/USDT – Trade Setup (LONG)
📈 Position Type: LONG
🕒 Timeframe: 1H
📊 Market: Futures
💰 Entry Zone:
0.06891
🛑 Stop-Loss:
0.06650
🎯 Take-Profit Targets:
• TP1: 0.07093
• TP2: 0.07352
• TP3: 0.07620
• TP4
⚙️ Leverage:
5 *10
▫️ After TP1, move SL to Entry + 0.2%.
▪️ Exit Plan:
• 50% at TP1
• 25% at TP2
• 25% at TP3
📌 Risk Management:
Risk only 1–2% of your capital per trade.
⚠️ Always check and confirm the setup on your chart before entering the trade.
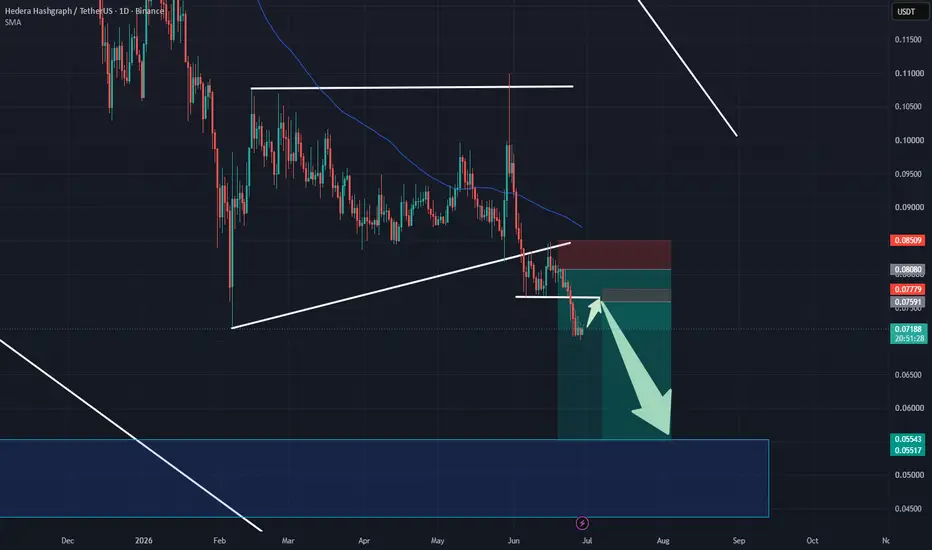
HBAR: Bearish Trend Continuation ConfirmedHBAR: Bearish Trend Continuation Confirmed – Setting Up an Optimal Short Entry Opportunity
HBAR is moving highly accurately in line with our previous technical projections and continues to flash strong selling signals. The market structure at this juncture is entirely dominated by the bears, as the chart systematically locks in a clear sequence of lower highs and lower lows. This consistent price action serves as a classic technical confirmation that the long-term primary downward momentum remains firmly in control of the market direction.
Based on the visual data from the daily chart , today's selling impulse has officially forced the price to close decisively below its most recent swing low near the $0.0683 mark. This clean structural breakdown opens up a highly promising trend-following trade setup. For traders who are already holding Short positions from higher price ranges, this presents a perfect window to proactively trail your stop-loss orders to secure accumulated profits safely.
Conversely, for those who have not yet entered the market, the current area represents an ideal trigger point to establish a fresh Short position. Initiating a sell order right at this breakdown level secures a major technical edge, allowing for an exceptionally tight stop-loss placement just above the newly breached barrier. This effectively optimizes the risk-to-reward parameters before the price action extends toward the next major objective at $0.055 or deeper into the $0.050 psychological round number zone.
Disclaimer: This is not financial advice, DYOR.
HBAR: pressing the $0.069 floor with $0.065 in playThe Macro Picture 🗺️
HBAR has been grinding lower since the early-June spike toward $0.11, carving a steady descending structure of lower highs back down to the $0.069 June low. Price now sits right on that floor at the $0.070 equilibrium, with RSI pinned in the high-30s beneath its moving average — no momentum shift, just persistent pressure. The recent bounce toward $0.078 was sold, leaving price probing the base again. In a trend this heavy, sitting on support with weak momentum is a setup for a break rather than a bounce, and losing the floor opens clean air toward $0.065.
The Setup ⚙️
The Rejection: The bounce stalled at the $0.078 local decision (red dashed), the level that flipped from support to resistance on the breakdown. As long as price stays capped beneath it, sellers keep control.
The Floor: The $0.069 local low is the immediate battleground, with the $0.065 macro support (solid green) as the next shelf below. Price is testing $0.069 directly — a decisive daily close under it triggers sell stops into the open air toward $0.065.
The Reaction: RSI holding below its midline through the descent confirms sellers still lead, favoring a breakdown over a base at current levels.
The Roadmap: Primary target sits at $0.065 — the red projection points toward a flush through the floor as lower highs compress price into support. Invalidation: a sustained 1D close back above $0.078 would flip the structure and open the path toward the $0.10 macro ceiling.
More setups in profile.
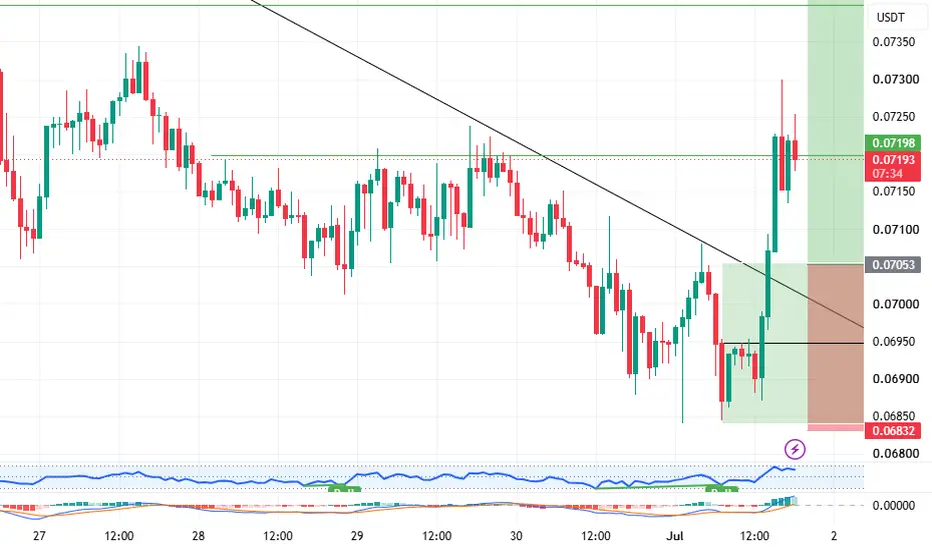
HBAR USDT LONG SIGNALHBAR /USDT – Trade Setup (LONG)
📈 Position Type: LONG
🕒 Timeframe: 1 H
📊 Market: Futures
💰 Entry Zone:
0.7067
0.6944
🛑 Stop-Loss:
0.6830
🎯 Take-Profit Targets:
• TP1: 0.7193
• TP2: 0.7399
• TP3: 0.7574
• TP4: 0.7797
TP5: 0.8048
TP6:
⚙️ Leverage:
5- 10
⚠️ After reaching TP1, move Stop-Loss to Entry Price.
📌 Risk Management:
Risk only 1–2% of your capital per trade.
Always confirm the setup on your chart before entry
HBAR USDT LONG SIGNALHBAR/USDT – Trade Setup (LONG)
📈 Position Type: long
🕒 Timeframe: 1 H
📊 Market: Futures
💰 Entry Zone:
0.7135
🛑 Stop-Loss:
0.70
🎯 Take-Profit Targets:
• TP1: 0.7265
• TP2: 0.74
• TP3: 0.7555
• TP4: 0.7680
TP5:
TP6:
⚙️ Leverage:
5-10
⚠️ After reaching TP1, move Stop-Loss to Entry Price.
📌 Risk Management:
Risk only 1–2% of your capital per trade.
Always confirm the setup on your chart before entry
HBAR: Structural Breakdown of the Accumulation BaseHBAR: Structural Breakdown of the Accumulation Base – A Disciplined Strategy Awaiting Technical Retracements for Short Entries 2026
HBAR is moving with high precision in perfect alignment with the macro bearish roadmap outlined in our prior strategic market review from two weeks ago. Absolute dominance from active sellers successfully dragged price candles lower, fracturing mid-term support floors and delivering an outstanding profit performance of up to 2R. Although the structural weakness remains highly pronounced, immediate price action is operating within an overextended local expansion, demanding maximum patience from the investor community.
Observing the daily visual technical chart, the recent steep downward cascade serves as solid evidence that buying power is completely exhausted as institutional capital consistently steps aside. For sidelined market participants, my sincere advice at this juncture is to strictly avoid late emotional herd behavior (FOMO) at these current extended lows. Rushing into a late sell entry after a major expansion leg leaves your capital highly vulnerable to sharp technical counter-rallies.
The sharpest strategy is to remain patient on the sidelines, awaiting a standard technical retracement back to test the horizontal support baseline that was recently broken around the 0.075 - 0.076 USD cluster. This specific structural boundary has now officially flipped into a strong overhead resistance ceiling. Triggering a trend-following sell (Short) position within this dynamic confluence buffer optimizes your risk profile with an exceptionally tight strategic stop-loss placed right above the resistance floor, confidently targeting lower profit objectives.
this is not investment advice, DYOR
HBARUSDT macro breakdown: targeting $0.0600The Macro Picture 🗺️
HBARUSDT has finally lost the structural anchor that defined the entire 2026 range. The $0.0750 macro floor, which absorbed February's flush and gated four months of consolidation, has given way under sustained selling pressure, with price now trading at $0.0710 below the year's defining support for the first time. The breakdown completes the failed-base sequence that began with the May $0.1100 false breakout and the failed June reclaim at $0.0865, leaving the structural picture firmly tilted toward continuation. RSI is curling near oversold around 30, but the structural damage means relief bounces are now mean-reversion attempts inside a confirmed downtrend rather than reversal signals.
The Setup ⚙️
The Rejection: The mid-June failure at $0.0865 turned the prior local floor into a confirmed ceiling, and price's inability to even retest that level before breaking lower signals genuine supply exhaustion on the bid side rather than buyer absorption.
The Breakdown: The loss of $0.0750 is the structural break that matters, with what was the floor of February's structural reset now becoming the macro ceiling, and bears will defend any retest from below with renewed conviction.
The Sell Area: The $0.0750–$0.0800 zone is now the high-confluence sell area for any relief bounce, with the broken macro line and the prior squeeze base stacked into overhead supply.
The Roadmap: Primary target sits at $0.0600, the deeper liquidity pocket and natural mean-reversion magnet once the year's macro floor flips into resistance. Invalidation: a sustained 2D close back above $0.0750 would invalidate this bearish thesis and reopen the path back into the prior range structure.
HBAR Near Breakdown, Lower Price HBAR is currently trading at a critical support region, with price action showing significant weakness across multiple timeframes. Recent selling pressure has been aggressive, and the market structure remains decisively bearish in the immediate short term. As a result, the probability of price taking out the current weekly low, which aligns with the February swing low, continues to increase.
The importance of this support zone cannot be overstated. Weekly lows often act as liquidity targets, and when markets trend lower with strong momentum, these levels are frequently tested before any meaningful reversal can occur. At present, HBAR remains under pressure, with sellers maintaining control of the market structure.
However, there is an alternative scenario developing. If price trades below the weekly low but quickly reclaims the region, it could form a swing failure pattern (SFP). This type of setup occurs when liquidity beneath a significant low is taken before buyers aggressively step in and push price back above support. Such a reclaim would invalidate the bearish breakdown and potentially trigger a stronger recovery rally toward higher resistance levels.
Despite this possibility, traders should remain cautious. Current momentum remains extremely bearish, and oversold conditions alone do not guarantee a reversal. In fact, oversold markets can remain oversold for extended periods during strong downtrends.
For now, lower prices remain the higher-probability outcome. However, the February low should be monitored closely, as any reclaim following a breakdown could provide the first meaningful signal that a bullish reversal is beginning to develop.
HBARUSDT: local squeeze with $0.0850 destinationThe Macro Picture 🗺️
HBARUSDT continues to digest the failed-breakout reversal of late May, with price now compressing in a tight base just above the $0.0750 macro floor that defined February's structural reset. The first bounce attempt off the macro low stalled at $0.0865 in mid-June, confirming the prior local floor at $0.0850 as overhead supply, and price has rotated back down for a second test of the macro zone. The setup now sits in classic re-accumulation territory, coiling above the macro floor with each retest absorbing less supply, and daily RSI flattening around 40 without breaking lower.
The Setup ⚙️
The Squeeze: Price is coiling between $0.0780 and $0.0830, a tight base that desperately needs to be resolved after the failed first bounce. The longer this compression holds without breaking lower, the higher the probability that buyers are quietly absorbing the dip.
The Accumulation Zone: The $0.0780–$0.0830 pocket has now absorbed multiple downside tests since June, building the kind of base that favors gradual, averaging-based entries while price compresses ahead of the next leg.
The Trigger: $0.0850 is the immediate hurdle, with the prior local floor flipped into overhead supply after the mid-June rejection. A clean daily close above $0.0850 confirms the broken-floor reclaim and reactivates the structural reset thesis.
The Roadmap: Primary target sits at $0.0850, the broken-floor reclaim and key structural pivot, as indicated by the white projection tracing a base-build-then-breakout trajectory. Invalidation: a sustained 2D close below $0.0750 would invalidate this bullish thesis and open the path back toward the $0.0700 liquidity extension.
HBAR Building A Base... Or Just Pausing The Downtrend?Multi-Month Support Holding Firm
• HBAR continues to find buying interest around the $0.08 weekly support zone.
• This area has acted as a key floor on multiple occasions, making it one of the most important levels on the chart.
Trend Still Favours The Bears
• The 21/8-week EMAs remain bearishly crossed, with price continuing to trade below both averages.
• Until that structure changes, the longer-term trend remains tilted firmly to the downside.
Resistance Is Stacking Up
• Initial resistance now sits around the recent swing high near $0.11.
• Beyond that, the major multi-month resistance zone between $0.1250 and $0.1350 remains the level bulls ultimately need to reclaim.
Momentum Remains Weak
• RSI continues to trade below the 50 level, showing that bearish momentum still has the upper hand.
• StochRSI is also drifting lower through the middle of its range, offering little sign of renewed buying strength.
Bulls Need A Stronger Recovery
• While price appears to be stabilising around support, there is little evidence of a sustained reversal developing.
• A move back above the weekly moving averages would be the first meaningful sign that sentiment is beginning to improve.
Patience Still Required
• HBAR may be attempting to build a longer-term base after months of weakness.
• However, until key resistance levels are reclaimed, rallies are likely to be viewed as corrective rather than the start of a new bull trend.
In Summary
HBAR continues to defend the important $0.08 weekly support zone, suggesting buyers are attempting to build a base after an extended decline. While holding support is encouraging, the broader technical picture remains bearish. Price is still trading below the bearishly crossed 21/8-week EMAs, RSI remains below 50, and significant resistance sits overhead at $0.11 and the $0.1250-$0.1350 region. Bulls have stabilised the market, but they still have considerable work to do before the longer-term outlook begins to improve.
Is # HBAR Ready For a Recovery or Not? Don't Miss This One Yello, Paradisers! Is #HBAR finally preparing to leave this accumulation range behind, or are traders about to miss one of the most important breakouts? Let's view #Hedera trading setup:
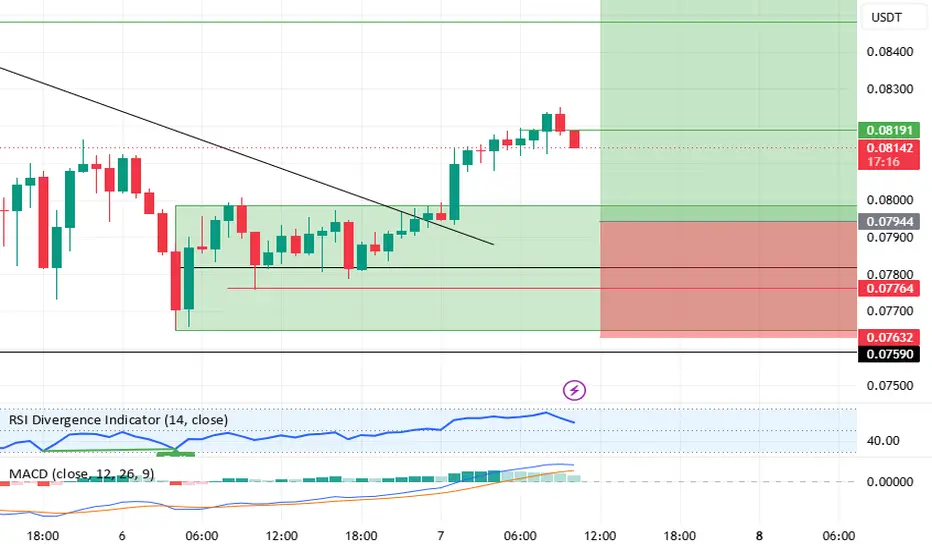
💎#HBARUSDT on the 4H timeframe is showing increasingly bullish behavior after successfully breaking above a long-standing descending resistance trendline that has been controlling price action since the beginning of June. This breakout is particularly important because it follows multiple liquidity sweeps below the local lows, where weak-handed traders were forced out before buyers stepped in aggressively.
💎For several days, #HBARUSD traded inside a well-defined accumulation range, with the demand zone between $0.0765 and $0.0778 repeatedly attracting buyers. Every attempt by sellers to push the price lower was absorbed, creating a strong foundation for the recent breakout. The ability of price to hold this demand area multiple times significantly strengthens the bullish case and suggests that buyers remain active at these levels.
💎The recent breakout above the descending resistance line has already provided the first bullish confirmation. However, the next critical step is for the price to successfully convert the current resistance zone around $0.0819-$0.0825 into support. A healthy retest of this area, combined with the 50 EMA acting as dynamic support, would substantially increase the probability of a sustained bullish continuation.
💎If buyers maintain control above the breakout zone, the first major upside target sits at the moderate resistance level near $0.0878. This area represents an important supply zone where some profit-taking activity may emerge. A successful breakout above this resistance would likely attract additional momentum traders into the market.
💎Should bullish momentum continue expanding beyond $0.0878, the next significant objective becomes the strong resistance zone around $0.0990-$0.1000. This level aligns with a major high-volume area and represents the next key target where sellers may attempt to challenge the advance.
💎From a momentum perspective, the MACD is showing encouraging signs as bullish momentum continues to improve, while the recent breakout structure itself suggests increasing buyer strength. On the downside, traders should closely monitor the major support zone around $0.0735. A breakdown below this level would invalidate the current bullish setup and increase the probability of a deeper correction.
Trade smart, Paradisers. This setup will reward only the disciplined.
MyCryptoParadise
iFeel the success🌴
HBAR Price SFP Pattern Potential HBAR price action is currently approaching a significant higher timeframe support zone located just below the value area low of the current trading range. This region represents an important area of interest for market participants, as it could provide the foundation for a potential bullish reversal if buyers begin to step in aggressively. The market is testing a level where liquidity is likely resting beneath recent swing lows, creating the conditions for a possible Swing Failure Pattern (SFP).
An SFP would involve price temporarily breaking below the established swing low, triggering stop losses and drawing in late sellers before quickly reclaiming the level. This type of price action often signals liquidity absorption and can act as the catalyst for a strong reversal move. If HBAR successfully forms an SFP and reclaims the lost support, attention will shift toward the next major resistance zone overhead.
Reclaiming this resistance is the key requirement for confirming bullish continuation. A successful breakout and acceptance above resistance would signal that buyers have regained control of the short-term market structure and could trigger a rotational move back toward the upper boundary of the current trading range. Such a development would support the broader range-bound environment and increase the probability of HBAR revisiting range highs. Until then, traders should closely monitor support behavior and watch for signs of a confirmed SFP reversal.
HBARUSDT at macro floor: structural reset aheadThe Macro Picture 🗺️
HBARUSDT just delivered the textbook failed-breakout reversal. The late-May spike into $0.1100 proved to be the structural peak rather than the start of expansion, with $0.1000 rejected as resistance and price unwinding the entire four-month range in two weeks. Selling pressure has now driven price into the $0.0750–$0.0800 macro floor, the same level that absorbed February's flush and triggered the year's structural reset. RSI has bled into near-oversold territory and is curling higher, hinting that sellers are running out of fuel exactly where buyers historically step in.
The Setup ⚙️
The Sweep: The wick into $0.0760 hunted liquidity below the spring base and cleared out late longs positioned for the bullish continuation that never came, completing a textbook structural reset at the macro floor.
The Floor: The $0.0750 line is the macro support that defined the February low and now anchors the entire 2026 range, and bulls desperately need to defend it to keep the broader structure intact.
The Reclaim: $0.0850 is the immediate hurdle, with the prior local floor now flipped into overhead supply, and bulls need a clean daily close above this level to confirm the reversal and unlock the path back into the old range.
The Roadmap: Primary target sits at $0.0900, the mid-range resistance and natural destination for a structural reset bounce, as indicated by the white projection tracing a sweep-and-reverse trajectory off the macro floor. Invalidation: a sustained 2D close below $0.0750 would invalidate this bullish thesis and open the path toward the $0.0700 liquidity extension.
HBAR Price Rebounds After Brutal 85% Crash * The HBAR price bounced back toward $0.094 after falling more than 85% from its all-time high near $0.57.
* HBAR reclaimed key moving averages and broke above recent swing highs, improving short-term market structure.
*Hedera’s enterprise expansion, including BrandBoost and FedEx council participation, continues supporting the network’s long-term growth story.
When you zoom out on the HBAR price action, it’s easy to see why many traders gave up on it. Hedera spent most of 2026 stuck in a brutal downtrend, falling more than 85% from its all-time high near $0.57 and entering the kind of capitulation zone that often appears near major market bottoms.
But things are starting to look different.
The HBAR price has bounced back toward $0.094 after successfully defending the $0.084–$0.088 support region, an area that aligned with key Fibonacci levels. Buyers have also pushed HBAR above recent swing highs and reclaimed the 100 SMA near $0.089, both of which are early signs that momentum may be shifting.
What makes this setup more interesting is the scale of the correction that came before it. Glassnode data shows HBAR suffered an 84%–85% drawdown from its all-time high, placing it among the hardest-hit major Layer-1 projects this cycle. Historically, corrections of that size tend to flush out weaker holders and create better risk-reward conditions for patient buyers.
The fundamentals have not disappeared either. Hedera’s market cap has recovered toward $3.94 billion after dipping near $3.71 billion, and the network continues expanding its enterprise ecosystem. The launch of BrandBoost and the addition of FedEx to Hedera’s Governing Council are examples of the real-world adoption story the project continues to build.
The HBAR price is now testing one of its most important resistance zones in months between $0.095 and $0.100. If buyers can push above $0.100 and hold the reclaimed $0.089–$0.092 support area, the next upside targets sit around $0.105 and $0.122.
A move back below $0.089 would weaken the recovery and put the $0.082–$0.085 support zone back into focus.
HBAR is still recovering from one of the deepest corrections in its history, but reclaimed moving averages, improving market structure, and continued enterprise growth are giving traders a reason to watch the HBAR price again.