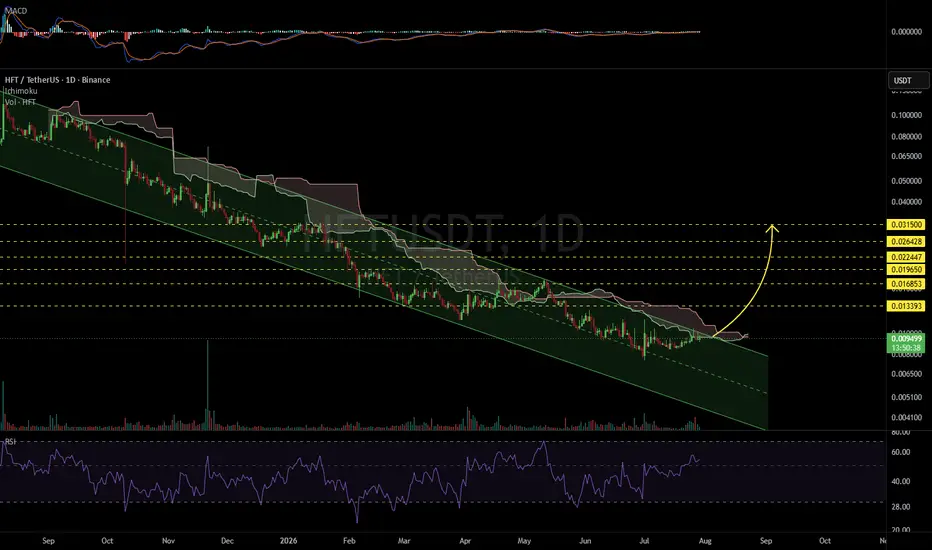
HFTUSDT 1D#HFT is trading within a descending channel on the daily timeframe and is currently testing both the channel resistance and the Ichimoku Cloud. A confirmed breakout above these key resistance levels could trigger a bullish move toward the following upside targets:
🎯 $0.013393
🎯 $0.016853
🎯 $0.01965
Compare with HFT/USDT
HFTUSDT Forming Bullish MomentumHFTUSDT is forming a clear bullish momentum pattern, a classic bullish wave signal that often indicates an upcoming breakout. The price has been consolidating within a narrowing range, suggesting that selling pressure is weakening while buyers are beginning to regain control. With consistent volume
HFTUSDT Forming Falling WedgeHFTUSDT is forming a clear falling wedge pattern, a classic bullish wave signal that often indicates an upcoming breakout. The price has been consolidating within a narrowing range, suggesting that selling pressure is weakening while buyers are beginning to regain control. With consistent volume con
HFT/USDT — Early Reversal or Just a Relief Rally?The HFT/USDT (1D) chart shows a strong downtrend from its previous peak, marked by a consistent pattern of lower highs and lower lows. The descending trendline acts as a key dynamic resistance, continuously pushing the price downward.
Currently, the price is trading in the lower range (around 0.015
HFTUSDT Forming Falling WedgeHFTUSDT is forming a clear falling wedge pattern, a classic bullish reversal signal that often indicates an upcoming breakout. The price has been consolidating within a narrowing range, suggesting that selling pressure is weakening while buyers are beginning to regain control. With consistent volume
Hashflow: 965% profits potential, an easy targetI can understand the strong reaction when I say 965% is an easy target. It is hard to reconcile under the current market sentiment. It is hard to visualize, accept and adapt to the change that is just weeks away.
Hashflow (HFTUSDT) has huge potential for growth and this can come sooner than expecte
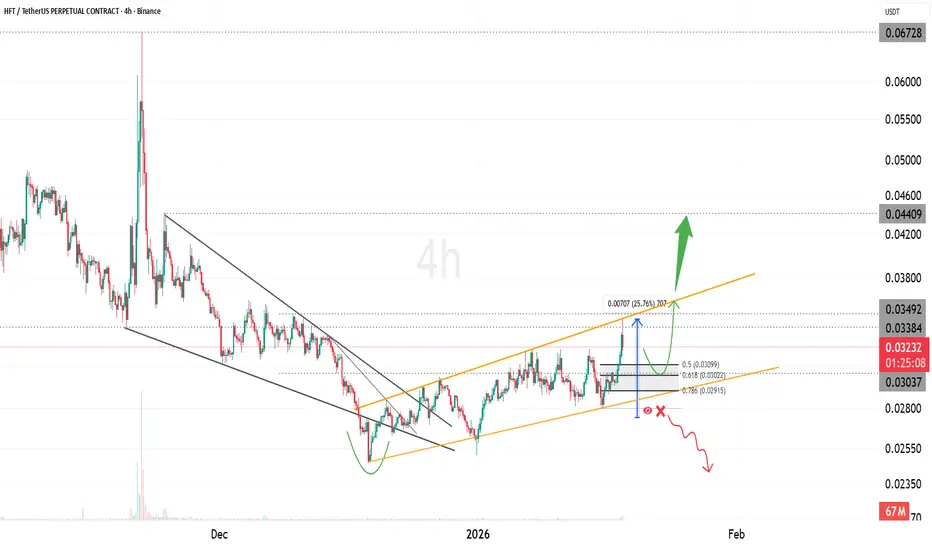
HFT Loading a Ascending Broadening Wedge BreakoutHFT is forming an Ascending Broadening Wedge on the 4H timeframe, indicating rising volatility and expansion in price range.
From the previous analysis, price has already delivered a 25%+ upside move, validating the structure and confirming volatility expansion.
Price continues to print higher hig
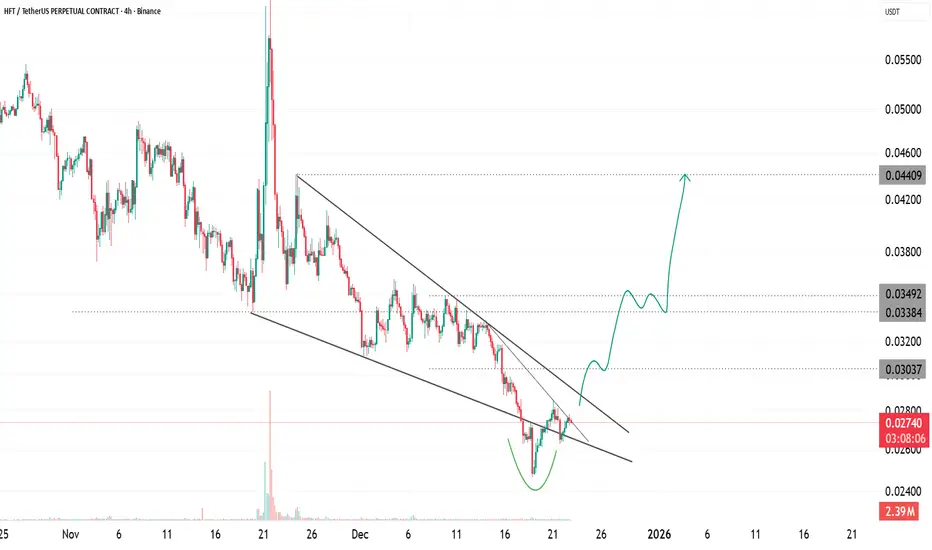
HFT Falling Wedge Signals Potential Trend ReversalHFT has been forming a clear falling wedge after a prolonged bearish phase. Price action shows lower highs and lower lows, but the range is tightening as the wedge converges, indicating weakening bearish momentum rather than strong continuation.
Price recently reacted from the lower boundary of the
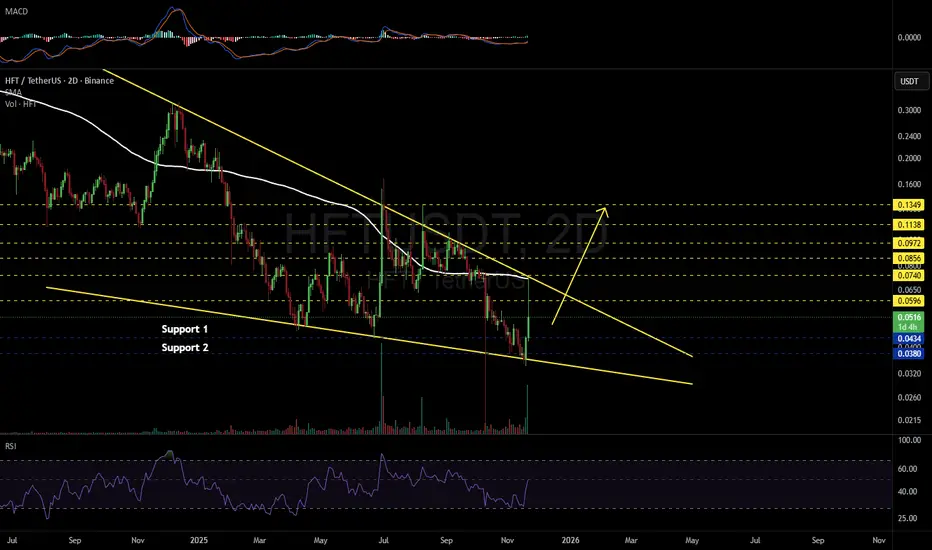
HFTUSDT 2D#HFT is moving inside a falling wedge pattern on the 2-day timeframe. It recently made a sharp upward move, but the rally stalled exactly at the confluence of the wedge resistance and the 2-day SMA100. Price tapped that zone and was immediately rejected, sending it back down. Consider buying a small
HFTUSDT Forming Falling WedgeHFTUSDT is forming a classic falling wedge pattern on the daily charts, a reliable bullish reversal signal that's capturing the eye of savvy crypto traders as altcoin season heats up in late 2025. This tightening consolidation phase, with lower highs and higher lows converging toward the $0.045 supp
See all ideas
Summarizing what the indicators are suggesting.
Oscillators
Neutral
SellBuy
Strong sellStrong buy
Strong sellSellNeutralBuyStrong buy
Oscillators
Neutral
SellBuy
Strong sellStrong buy
Strong sellSellNeutralBuyStrong buy
Summary
Neutral
SellBuy
Strong sellStrong buy
Strong sellSellNeutralBuyStrong buy
Summary
Neutral
SellBuy
Strong sellStrong buy
Strong sellSellNeutralBuyStrong buy
Summary
Neutral
SellBuy
Strong sellStrong buy
Strong sellSellNeutralBuyStrong buy
Moving Averages
Neutral
SellBuy
Strong sellStrong buy
Strong sellSellNeutralBuyStrong buy
Moving Averages
Neutral
SellBuy
Strong sellStrong buy
Strong sellSellNeutralBuyStrong buy
Displays a symbol's price movements over previous years to identify recurring trends.
Frequently asked questions
The current price of Hashflow/Tether (HFT) is 0.030315 USDT — it has risen 26.53% in the past 24 hours. Try placing this info into the context by checking out what coins are also gaining and losing at the moment and seeing HFT price chart.
Hashflow/Tether price has risen by 154.78% over the last week, its month performance shows a 140.25% increase, and as for the last year, Hashflow/Tether has decreased by −54.30%. See more dynamics on HFT price chart.
Keep track of coins' changes with our Crypto Coins Heatmap.
Hashflow/Tether (HFT) reached its highest price on Nov 7, 2022 — it amounted to 1.988000 USDT. Find more insights on the HFT price chart.
See the list of crypto gainers and choose what best fits your strategy.
Hashflow/Tether (HFT) reached the lowest price of 0.007556 USDT on Jul 1, 2026. View more Hashflow/Tether dynamics on the price chart.
See the list of crypto losers to find unexpected opportunities.
The safest choice when buying HFT is to go to a well-known crypto exchange. Some of the popular names are Binance, Coinbase, Kraken. But you'll have to find a reliable broker and create an account first. You can trade HFT right from TradingView charts — just choose a broker and connect to your account.
Crypto markets are famous for their volatility, so one should study all the available stats before adding crypto assets to their portfolio. Very often it's technical analysis that comes in handy. We prepared technical ratings for Hashflow/Tether (HFT): today its technical analysis shows the strong buy signal, and according to the 1 week rating HFT shows the buy signal. And you'd better dig deeper and study 1 month rating too — it's neutral. Find inspiration in Hashflow/Tether trading ideas and keep track of what's moving crypto markets with our crypto news feed.
Hashflow/Tether (HFT) is just as reliable as any other crypto asset — this corner of the world market is highly volatile. Today, for instance, Hashflow/Tether is estimated as 121.86% volatile. The only thing it means is that you must prepare and examine all available information before making a decision.
You can discuss Hashflow/Tether (HFT) with other users in our public chats, Minds or in the comments to Ideas.