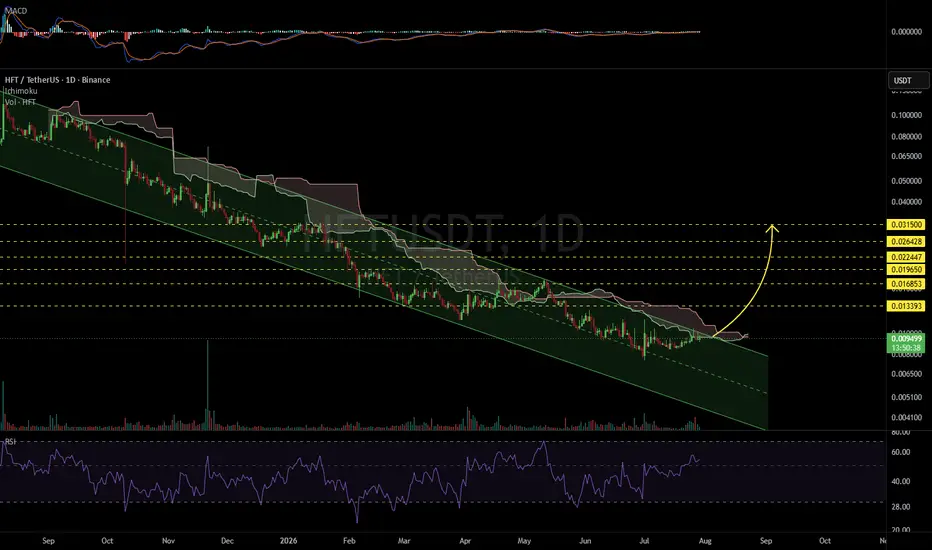
HFTUSDT 1D#HFT is trading within a descending channel on the daily timeframe and is currently testing both the channel resistance and the Ichimoku Cloud. A confirmed breakout above these key resistance levels could trigger a bullish move toward the following upside targets:
🎯 $0.013393
🎯 $0.016853
🎯 $0.019650
🎯 $0.022447
🎯 $0.026428
🎯 $0.031500
⚠️ Always use a tight stop-loss and apply proper risk management.
In-depth trading ideas
HFTUSDT Forming Bullish MomentumHFTUSDT is forming a clear bullish momentum pattern, a classic bullish wave signal that often indicates an upcoming breakout. The price has been consolidating within a narrowing range, suggesting that selling pressure is weakening while buyers are beginning to regain control. With consistent volume confirming accumulation at lower levels, the setup hints at a potential bullish breakout soon. The projected move could lead to an impressive gain of around 40% to 50% once the price breaks above the wedge resistance.
This bullish momentum pattern is typically seen at the end of downtrends or corrective phases, and it represents a potential shift in market sentiment from bearish to bullish. Traders closely watching HFTUSDT are noting the strengthening momentum as it nears a breakout zone. The healthy trading volume adds confidence to this pattern, showing that market participants are positioning early in anticipation of a reversal.
Investors' growing interest in HFTUSDT reflects rising confidence in the project's long-term fundamentals and current technical strength. If the breakout confirms with sustained buying volume, this could mark the start of a fresh bullish leg. Traders might find this a valuable setup for medium-term gains, especially as the momentum pattern completes and buying pressure continues to accelerate.
✅ Show your support by hitting the like button and
✅ Leaving a comment below! (What is You opinion about this Coin)
Your feedback and engagement keep me inspired to share more insightful market analysis with you!
HFTUSDT Forming Falling WedgeHFTUSDT is forming a clear falling wedge pattern, a classic bullish wave signal that often indicates an upcoming breakout. The price has been consolidating within a narrowing range, suggesting that selling pressure is weakening while buyers are beginning to regain control. With consistent volume confirming accumulation at lower levels, the setup hints at a potential bullish breakout soon. The projected move could lead to an impressive gain of around 90% to 100% once the price breaks above the wedge resistance.
This falling wedge pattern is typically seen at the end of downtrends or corrective phases, and it represents a potential shift in market sentiment from bearish to bullish. Traders closely watching HFTUSDT are noting the strengthening momentum as it nears a breakout zone. Good trading volume adds confidence to this pattern, showing that market participants are positioning early in anticipation of a reversal.
Investors’ growing interest in HFTUSDT reflects rising confidence in the project's long-term fundamentals and current technical strength. If the breakout confirms with sustained volume, this could mark the start of a fresh bullish leg. The current market structure suggests that buyers are gradually taking control while bearish momentum continues to fade, increasing the probability of a strong upside move.
Traders might find this a valuable setup for medium-term gains, especially as the falling wedge pattern approaches completion and buying momentum continues to build. A successful breakout above resistance could attract additional buying pressure and potentially drive the price toward its projected upside target.
✅ Show your support by hitting the like button!
✅ Leave a comment below! (What is your opinion about this coin?)
Your feedback and engagement keep me inspired to share more insightful market analysis with you!
HFT/USDT — Early Reversal or Just a Relief Rally?The HFT/USDT (1D) chart shows a strong downtrend from its previous peak, marked by a consistent pattern of lower highs and lower lows. The descending trendline acts as a key dynamic resistance, continuously pushing the price downward.
Currently, the price is trading in the lower range (around 0.015–0.016), showing signs of consolidation and a potential breakout from the mid-term bearish pressure.
---
📐 Pattern Formation: Descending Triangle / Descending Channel Breakout Attempt
The main pattern observed is a Descending Triangle (also part of a broader Descending Channel).
Key characteristics:
Lower highs → consistent selling pressure
Weak horizontal support → around 0.014–0.015
Price is approaching the apex zone, which typically leads to a significant move (breakout or breakdown).
---
🟢 Bullish Scenario
If price manages to:
Break out and close above the descending trendline (around 0.016–0.018)
Supported by increasing volume
Then potential targets:
🎯 0.0188 → first minor resistance
🎯 0.0250 → next supply zone
🎯 0.0320 → major target (previous structure resistance)
💡 This would indicate:
A possible mid-term trend reversal
Or at least a strong relief rally
---
🔴 Bearish Scenario
If price fails to break out and:
Gets rejected at the trendline
Breaks down below 0.014–0.015 support
Then potential outcomes:
📉 Continuation of the downtrend
📉 Retest of 0.0115 (previous low) or lower
💡 This confirms:
Bearish structure remains dominant
No confirmed reversal yet
---
⚠️ Key Levels to Watch
Resistance:
0.0188
0.0250
0.0320
Support:
0.0159
0.0140
0.0115 (low)
---
📌 Conclusion
HFT is currently at a critical phase:
👉 Breakout = potential reversal / rally
👉 Rejection = continuation of the bearish trend
The next move from this zone will likely define the major direction ahead.
#HFTUSDT #CryptoAnalysis #TechnicalAnalysis #DescendingTriangle #BreakoutSetup #AltcoinTrading #CryptoTrading #PriceAction #BearishToBullish #TrendReversal #CryptoSignal
HFTUSDT Forming Falling WedgeHFTUSDT is forming a clear falling wedge pattern, a classic bullish reversal signal that often indicates an upcoming breakout. The price has been consolidating within a narrowing range, suggesting that selling pressure is weakening while buyers are beginning to regain control. With consistent volume confirming accumulation at lower levels, the setup hints at a potential bullish breakout soon. The projected move could lead to an impressive gain of around 140% to 150% once the price breaks above the wedge resistance.
This falling wedge pattern is typically seen at the end of downtrends or corrective phases, and it represents a potential shift in market sentiment from bearish to bullish. Traders closely watching HFTUSDT are noting the strengthening momentum as it nears a breakout zone. The good trading volume adds confidence to this pattern, showing that market participants are positioning early in anticipation of a reversal.
Investors’ growing interest in HFTUSDT reflects rising confidence in the project’s long-term fundamentals and current technical strength. If the breakout confirms with sustained volume, this could mark the start of a fresh bullish leg. Traders might find this a valuable setup for medium-term gains, especially as the wedge pattern completes and buying momentum accelerates.
✅ Show your support by hitting the like button and
✅ Leaving a comment below! (What is your opinion about this Coin?)
Your feedback and engagement keep me inspired to share more insightful market analysis with you!
Hashflow: 965% profits potential, an easy targetI can understand the strong reaction when I say 965% is an easy target. It is hard to reconcile under the current market sentiment. It is hard to visualize, accept and adapt to the change that is just weeks away.
Hashflow (HFTUSDT) has huge potential for growth and this can come sooner than expected. When the altcoins start growing, it will be nothing like what you see now.
Hashflow started dropping since it started trading back in November 2022. There was a small rise ending in February 2023 followed by the start of a downtrend. And it has been lower and lower long-term.
As a more recent development, we've been seeing a bearish cycle since December 2024 (or July 2025). Still, more than a year the market being fully red. No breaks, no rest, nothing bullish. Straight down. The worst ever.
From the worst ever, the best possible conditions tend to develop.
The "extreme fear," the doubt and uncertainty has been explained. It is the nature of a bear market. Watch how fast things change.
Some projects, scattered here and there, are in the recovery phase. The target that you see with 217% on the chart gets challenged right away. In most cases, in a matter of days. This would be only the initial bullish breakout and not even a bullish wave.
Projects like VVV, KITE & LYN show how the market will develop; a sudden, sustained and prolonged uptrend. And it doesn't take a long time for high targets to be reached.
The lack of a marketwide bullish trend is what keeps the true market potential hidden, and this is exactly what is about to change.
We are about to witness the first uptrend, lasting for a while in a long while, and that's how $0.16 for a 965% becomes an easy target for HFTUSDT. When bullish momentum is on with full force, such a target can be hit within 3 weeks.
The build-up process can take forever, but once the bullish cycle unravels, we see growth non-stop, and it is so fast there is no time to adapt. The best entry is at the bottom when prices are low.
There is no need to catch an exact bottom, the only need right now is to buy and hold. The market will take care of the rest.
Namaste.
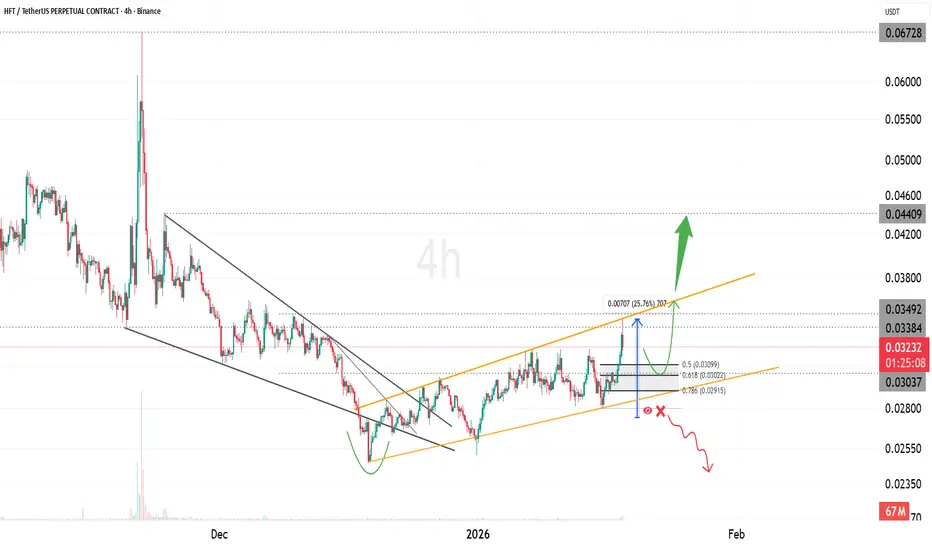
HFT Loading a Ascending Broadening Wedge BreakoutHFT is forming an Ascending Broadening Wedge on the 4H timeframe, indicating rising volatility and expansion in price range.
From the previous analysis, price has already delivered a 25%+ upside move, validating the structure and confirming volatility expansion.
Price continues to print higher highs and higher lows while respecting the lower trendline. As long as structure holds, upside continuation remains valid.
Bullish scenario:
• Hold above ascending support
• Acceptance above 0.0349
• Expansion toward 0.0440+
Bearish risk:
• Rejection from upper resistance
• Breakdown below ascending support
• Volatility-driven pullback
Trend remains constructive while structure holds.
Previous Analysis Link:
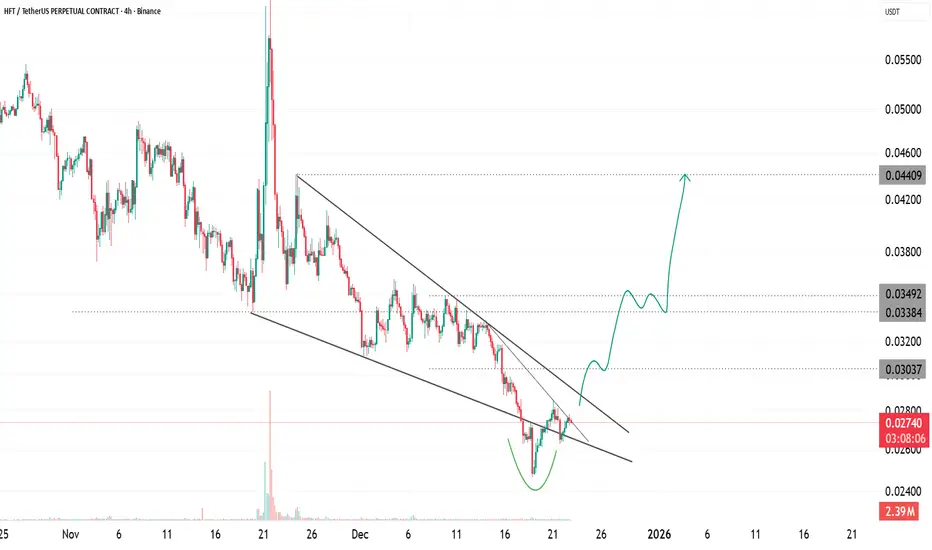
HFT Falling Wedge Signals Potential Trend ReversalHFT has been forming a clear falling wedge after a prolonged bearish phase. Price action shows lower highs and lower lows, but the range is tightening as the wedge converges, indicating weakening bearish momentum rather than strong continuation.
Price recently reacted from the lower boundary of the wedge and is now attempting to reclaim short-term structure. If HFT manages to break and hold above the upper wedge resistance, a relief rally toward the next resistance zones becomes likely. The first upside reaction area sits near zero point zero three zero, followed by higher resistance around zero point zero three four and zero point zero four four if momentum builds.
On the downside, failure to break out and a loss of the wedge base would invalidate the reversal setup. In that case, price may continue its broader downtrend and revisit lower demand levels.
This setup is driven by falling wedge dynamics, momentum compression, and early base formation near structural support. Breakout confirmation is required before expecting sustained upside continuation.
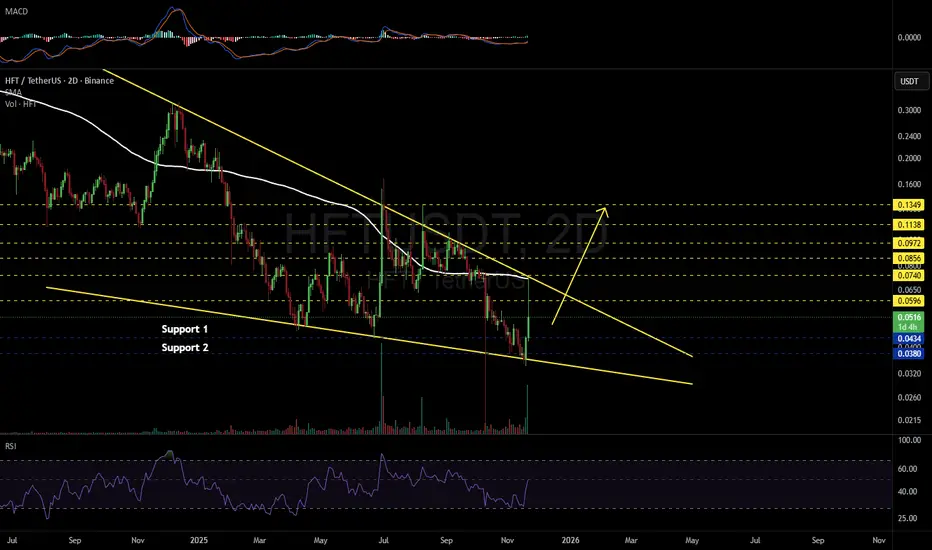
HFTUSDT 2D#HFT is moving inside a falling wedge pattern on the 2-day timeframe. It recently made a sharp upward move, but the rally stalled exactly at the confluence of the wedge resistance and the 2-day SMA100. Price tapped that zone and was immediately rejected, sending it back down. Consider buying a small bag here and near the support levels at
$0.0434 and $0.0380.
In case of a breakout above the wedge, the potential targets are:
🎯 $0.0596
🎯 $0.0740
🎯 $0.0856
🎯 $0.0972
🎯 $0.1138
🎯 $0.1349
⚠️ Always remember to protect your capital with a proper stop-loss and disciplined risk management.
HFTUSDT Forming Falling WedgeHFTUSDT is forming a classic falling wedge pattern on the daily charts, a reliable bullish reversal signal that's capturing the eye of savvy crypto traders as altcoin season heats up in late 2025. This tightening consolidation phase, with lower highs and higher lows converging toward the $0.045 support, points to fading seller exhaustion and stealthy buyer accumulation, setting the stage for a potential explosive breakout above the $0.050 resistance. Trading volume has been robust at over 12 million USDT in the past 24 hours across major exchanges like Binance and Bybit, underscoring genuine market interest rather than fleeting hype, especially as HFT hovers around $0.046 with RSI bouncing from oversold levels near 40. In the broader DeFi resurgence, Hashflow's intent-based RFQ model is aligning perfectly for cross-chain liquidity plays, making this falling wedge in HFTUSDT a high-probability setup for 140% to 150%+ gains as it eyes targets up to $0.11 in the coming weeks.
Delving into the mechanics of this falling wedge pattern, it's a hallmark of corrective downtrends giving way to bullish momentum, often amplified by increasing volume on the upside probes we've seen in HFTUSDT lately—think of it as the market's way of shaking out weak hands before the real rally ignites. Recent price action has respected the wedge's boundaries with textbook precision, from the November low of $0.041 to today's resilient bounce, while MACD histograms flip positive and the 50-day EMA curls upward for that golden cross tease. Traders on platforms like TradingView are buzzing about HFTUSDT's undervalued position amid Solana's ecosystem boom, where Hashflow's bridgeless swaps and zero-slippage execution are drawing in institutional flows from partners like Jump Crypto. This isn't just technical poetry; it's backed by real traction, with the token's market cap holding steady at around $75 million despite broader volatility, positioning HFTUSDT for a sentiment shift as Bitcoin stabilizes post-Fed speech
For risk-savvy traders eyeing HFTUSDT, anchor entries near $0.044 with stops below $0.041 for a juicy 1:3+ risk-reward, and scale out at $0.07 and $0.11 on volume spikes to lock in those projected 140%+ moves. While short-term dips like today's 7-12% pullback on exchange summaries add caution, the falling wedge's bullish bias remains intact, amplified by Hashflow's protocol expansions into Monad and major DeFi chains. As cross-chain intents become the norm, HFTUSDT could lead the next wave of DEX innovations, turning this pattern into a portfolio catalyst for Q4 2025 and beyond.
✅ Show your support by hitting the like button and ✅ Leaving a comment below! (What is You opinion about this Coin) Your feedback and engagement keep me inspired to share more insightful market analysis with you!
HFT/USDT - Bullish Reversal Setup 1HAfter a strong breakdown, price has started forming a potential reversal structure on the 1H timeframe.
Currently, HFT is respecting the ascending trendline support and showing early signs of strength.
A clean breakout above the local resistance could confirm bullish continuation toward the marked supply zone.
**Setup Details:**
* **Entry:** Around trendline support (~0.051)
* **Target:** 0.07370
* **Stop-loss:** 0.04350
* **Risk/Reward Ratio:** 1:3+
* **Bias:** Bullish as long as price stays above the trendline
**Notes:**
Wait for confirmation candle before entry. If price breaks below the trendline, setup becomes invalid.
Perfect setup for swing traders looking for a short-term bullish move.
HFT: One Last Pump Before the Dumpster?🚨 COINBASE:HFTUSD BINANCE:HFTUSDT — Quick Breakdown 🚨
📉 Structure
Clear bearish trend: lower lows, lower highs. Every time momentum hits overbought, we get another dump. Altseason? Highly unlikely to save this shitcoin.
📊 Price Action
June brought a bounce, but July almost completely erased it. If August closes below its open — expect the downtrend rally to continue.
🌊 Wave Scenario
June’s move looks like a potential impulse, so one more upward leg is possible:
🎯 T1: 0.1023 (July high)
🎯 T2: 0.1678 (July 2nd high)
🔝 Max realistic: 0.1800 (monthly imbalance fill)
🦄 Fantasy land: 0.2450 if we get a “fairy-tale” altseason.
💩 Fundamentally — this is a worthless piece of dog sh*t, don’t expect long-term miracles.
HFT/USDT — Will Bears Continue, or Will Bulls Take Control?Overview:
HFT has been trapped in a long-term downtrend since 2022, defined by the descending yellow trendline. Price is now consolidating at a critical zone, holding above strong support around 0.0431 (Low) while testing the descending trendline near 0.0969.
This is a make-or-break moment: will it continue the bearish cycle or start a potential accumulation phase for a major reversal?
---
🔎 Pattern & Market Structure
Descending Trendline → pressing the market down with consistent lower highs since 2022.
Horizontal Support → 0.0431 has been the main floor, repeatedly tested.
Potential Scenarios:
Breakdown confirms a descending triangle, continuation of the downtrend.
Breakout above the trendline may signal a falling wedge breakout, often leading to strong bullish reversal.
---
🟢 Bullish Scenario
1. Breakout Confirmation: Weekly close above the descending trendline (~0.0969).
2. Healthy Retest: Price flips the trendline into support with strong rejection of the downside.
3. Upside Targets:
0.1596 → first key resistance
0.2290 → strong supply zone
0.3093 – 0.3917 → medium-term bullish targets
4. Extra Signals: Strong breakout volume + bullish RSI divergence would strengthen the setup.
---
🔴 Bearish Scenario
1. Rejection at Trendline: Price fails to break above ~0.0969.
2. Breakdown Below 0.0431: Weekly close under this level confirms bearish continuation.
3. Downside Target: Opens the path for new lows, as historical support becomes invalid.
4. Confirmation: Weakening buying volume + momentum indicators (MACD/RSI) pointing down.
---
📌 Conclusion & Strategy
HFT is at a decision zone: either confirm a bullish reversal or extend its long-term bearish cycle.
Bullish Path: A breakout with volume could trigger a swing move toward 0.1596 → 0.2290.
Bearish Path: A breakdown below 0.0431 validates the descending triangle → continuation to new lows.
Risk Management is crucial — this is a high-volatility zone.
---
📢 Trader’s Note
Wait for weekly confirmation candles before committing to a position.
Aggressive traders may speculate longs near support with tight stops under 0.0431.
Conservative traders should wait for a confirmed breakout above the trendline.
Remember: low price ≠ cheap — always confirm with structure and volume.
---
#HFT #HFTUSDT #CryptoAnalysis #Altcoins #CryptoTrading #Breakout #BearishVsBullish #SupportResistance #Trendline
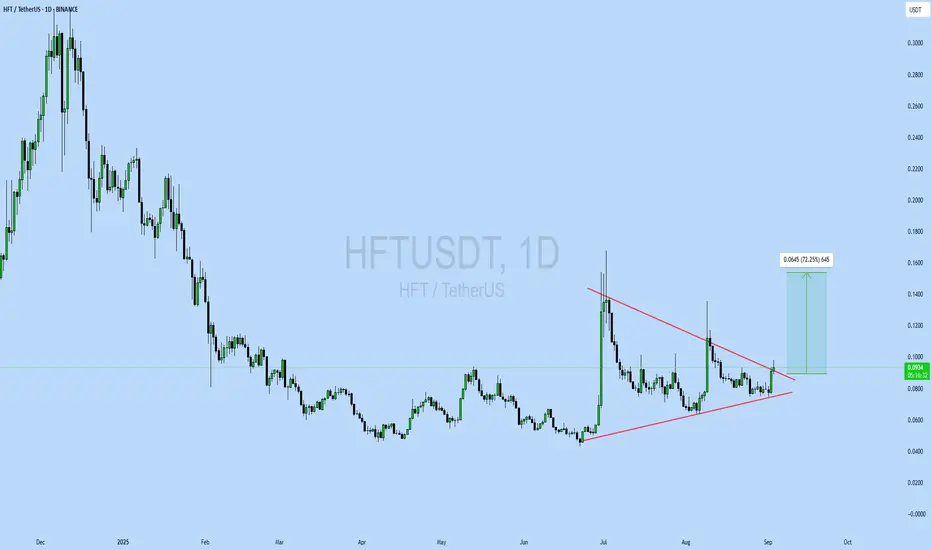
HFTUSDT UPDATE#HFT
UPDATE
HFT Technical Setup
Pattern : Bullish Pennant Pattern
Current Price: $0.0937
Target Price: $0.158
Target % Gain: 72.25%
Technical Analysis: HFT is forming a bullish pennant on the 1D chart with a breakout attempt supported by recent volume. If the price sustains above the $0.09 breakout zone, continuation toward $0.158 is expected.
Time Frame: 1D
Risk Management Tip: Always use proper risk management.
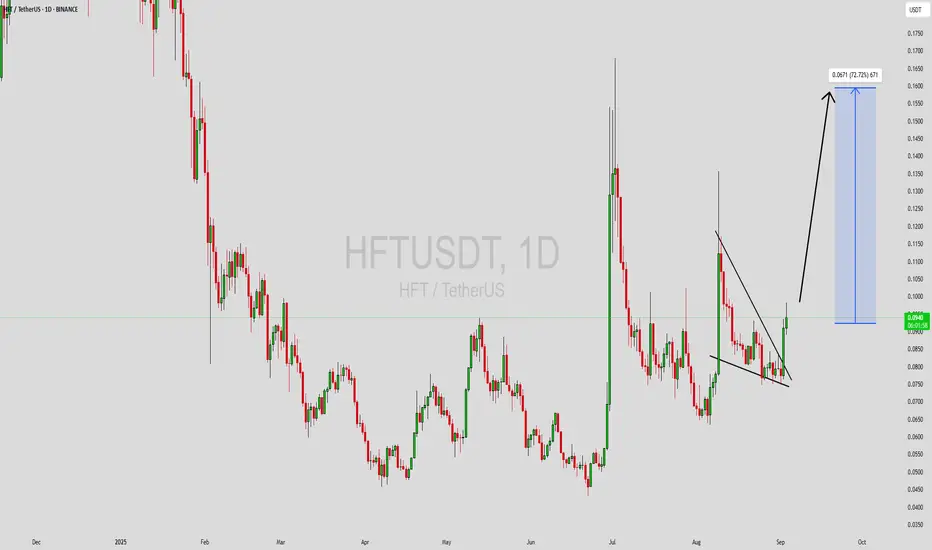
HFTUSDT Forming Falling WedgeHFTUSDT is showing a promising setup as it forms a falling wedge pattern, a bullish reversal structure that often signals an upcoming breakout. This pattern develops when price action trends lower while narrowing its range, indicating selling pressure is weakening and buyers are preparing to take control. The presence of good trading volume adds strength to this setup, confirming that investors are actively accumulating positions during this consolidation phase.
The technical outlook suggests that once HFTUSDT breaks out of the falling wedge, it could trigger a significant upward rally. Based on historical price behavior, falling wedge breakouts often deliver strong percentage gains, and in this case, an expected move of around 60% to 70%+ looks achievable. The volume profile supports this view, as steady inflows from investors are reinforcing market confidence in the potential upside.
Investor interest in HFTUSDT is steadily increasing, which is a positive sign for sustained momentum. Market participants appear to be positioning themselves for a bullish breakout, and this could quickly push the price toward key resistance levels. The falling wedge pattern, combined with solid investor sentiment, creates a strong technical foundation for an upcoming rally.
In conclusion, HFTUSDT is presenting one of the more attractive bullish reversal setups in the market. The falling wedge pattern, coupled with good trading volume and growing investor attention, sets the stage for a potential surge. Traders should watch closely for a confirmed breakout, as this could open the door to strong gains in the coming sessions.
✅ Show your support by hitting the like button and
✅ Leaving a comment below! (What is You opinion about this Coin)
Your feedback and engagement keep me inspired to share more insightful market analysis with you!
HFTUSDT | Bullish Momentum Gaining Strength!🚀 Trade Setup Details:
🕯 #HFT/USDT 🔼 Buy | Long 🔼
⌛️ Timeframe: 4H
--------------------
🛡 Risk Management:
🛡 If Your Account Balance: $1000
🛡 If Your Loss-Limit: 1%
🛡 Then Your Signal Margin: $42.64
--------------------
☄️ En1: 0.0928 (Amount: $4.26)
☄️ En2: 0.0848 (Amount: $14.92)
☄️ En3: 0.0796 (Amount: $19.19)
☄️ En4: 0.0747 (Amount: $4.26)
--------------------
☄️ If All Entries Are Activated, Then:
☄️ Average.En: 0.0823 ($42.64)
--------------------
☑️ TP1: 0.1153 (+40.1%) (RR:1.71)
☑️ TP2: 0.1356 (+64.76%) (RR:2.76)
☑️ TP3: 0.1667 (+102.55%) (RR:4.37)
☑️ TP4: 0.2167 (+163.3%) (RR:6.96)
☑️ TP5: 0.2896 (+251.88%) (RR:10.74)
☑️ TP6: Open 🔝
--------------------
❌ SL: 0.063 (-23.45%) (-$10)
--------------------
💯 Maximum.Lev: 2X
⌛️ Trading Type: Swing Trading
‼️ Signal Risk: 🙂 Low-Risk! 🙂
🔎 Technical Analysis Breakdown:
This technical analysis is based on Price Action, Elliott waves, SMC (Smart Money Concepts), and ICT (Inner Circle Trader) concepts. All entry points, Target Points, and Stop Losses are calculated using professional mathematical formulas. As a result, you can have an optimal trade setup based on great risk management.
📊 Sentiment & Market Context:
The sentiment around HFT/USDT is turning decisively bullish as the market shows strong momentum in favor of upward movement. After a period of consolidation, the coin is poised to break key resistance levels, signaling potential for significant gains. HFT, known for its unique decentralized finance (DeFi) ecosystem, continues to build on strong fundamentals including increasing adoption and strategic partnerships, which are driving investor confidence. With supportive market conditions and solid technical setups, HFT/USDT looks ready to capitalize on the next leg up in this crypto rally.
⚠️ Disclaimer:
Trading involves significant risk, and past performance does not guarantee future results. This analysis is for informational purposes only and should not be considered financial advice. Always conduct your research and trade responsibly.
💡 Stay Updated:
Like this technical analysis? Follow me for more in-depth insights, technical setups, and market updates. Let's trade smarter together!
HFT - 100m gem primed for launch?I've been watching HFT for the last week. It's been getting solid bounces off the white descending support following a recent run.
It faked out the support during the recent dip but was able to form a channel below and has now made the first new high on the 12h as the MACD turns positive.
A test of the recent high at 0.163 would be a 100% move from here, but we could see a move much higher.
If we zoom out to the 2D chart we can see we've just formed a bullish hammer (close enough to one I think?) Supporting a shortterm move to the upside, where we would meet the descending resistance of a humongous descending wedge which will be tested for a 4th time if we get to that level. If we get a proper altszn and a break of the resistance we could see this thing quickly to around $1, 12-15X.
We can see bullish divergence in the 12h and 2d that may support that hypothesis.
Of course, if is a volatile coin. Hard dumps cannot be ruled out. Hold on to your buts.
DYOR
HFT Buy/Long Setup (1D)After the downward trendline break and the formation of the main CH (Change of Character), we can look for buy/long positions around the key support zones.
A healthy time correction has also formed on the chart, and with price approaching the demand zone, we expect a strong reaction.
The support zone and target levels (TPs) are marked on the chart.
A daily candle close below the invalidation level will invalidate this analysis.
For risk management, please don't forget stop loss and capital management
When we reach the first target, save some profit and then change the stop to entry
Comment if you have any questions
Thank You
Hashflow Already Hit Bottom, I Can Prove It · 1,300% PPThe bottom is in. I can prove it and you will agree.
Good afternoon my fellow Cryptocurrency trader, how are you feeling in this wonderful day?
Hashflow (HFT) has been dropping since February 2023, a major decline but there is good news, just recently market conditions and price action dynamics started to change. Come April 2025 a downtrend is no more. Instead, when a new low was hit in June the chart ended as a double-bottom rather than a bearish impulse. And this is not all.
After the low in June 2025, the market bottom and all-time low, HFTUSDT produced the highest volume ever in a single week, by far the highest. Even higher than the first week of trading which tends to have the highest volume. And this confirms the bottom is in.
A downtrend ends, the bottom is confirmed. This combination reveals what comes next. Yes! A major bullish rise, a bullish impulse, a bullish cycle, a bullish wave. These are all the names for what you are about to experience next.
It is very simple actually, the market moves in cycles and within these cycles we have waves. The market was going down, long-term, as soon as the downturn is over we get a growing phase. Hashflow is set to grow.
Thank you for reading.
Namaste.
HFTUSDT UPDATE
Pattern: Falling Wedge Breakout
Current Price: \$0.0940
Target Price: \$0.1630
Target % Gain: 85.33%
Technical Analysis: HFT has broken out of a falling wedge on the 8H chart with strong bullish candles. Volume confirms the breakout, and the move above resistance suggests a potential rally toward the 85% target zone.
Time Frame: 8H
HFT/USDT NEXT LEGIn late June 2025, HFT surged over +250%, backed by strong buying interest and significant volume. Following that explosive move, the price has now corrected around 55%, currently consolidating at a key support/resistance flip zone a level that previously acted as resistance and now shows signs of holding as support.
Phemex Analysis #93: Is it Time to Enter Hashflow (HFT)?Hashflow ( PHEMEX:HFTUSDT.P ) is a decentralized trading protocol designed to facilitate seamless, secure cross-chain asset swaps with zero slippage and protection against MEV (Maximal Extractable Value) exploits. Unlike traditional decentralized exchanges, Hashflow enables users to trade across various blockchains without relying on external bridges or synthetic assets. Trades execute precisely at the quoted price without hidden commissions, enhancing transparency and efficiency.
Recently, HFT experienced an impressive bullish rally, surging approximately 190% within 48 hours, currently stabilizing around the $0.12 mark. This rapid appreciation naturally raises questions among traders: is now the ideal entry point, or is caution warranted following such sharp movements? To assist traders in making informed decisions, let's examine a few potential scenarios closely.
Possible Scenarios
1. Bullish Continuation (Positive Scenario)
Currently, the HFT price faces significant resistance around $0.15. A bullish continuation scenario involves HFT consolidating briefly above the $0.10 support area, gathering strength before making another attempt at breaking through the critical $0.15 resistance.
Pro Tips:
Entry Strategy: Consider carefully entering positions only after a confirmed breakout above the resistance at $0.15, accompanied by strong volume.
Profit-Taking Targets: Short-term profit-taking levels to monitor closely are at $0.156, $0.17, and $0.21.
Risk Management: Implement a clear stop-loss strategy slightly below the $0.10 area to mitigate potential downside risk.
2. The Hype Is Over (Bearish Scenario)
Given the broader market consolidation, there's a realistic risk that recent bullish momentum may fade quickly. If the price falls decisively below the $0.10 support, this scenario could trigger further declines towards key support levels such as $0.067, or even back down to $0.05.
Pro Tips:
Stay Cautious: Traders should remain on the sidelines if prices fall below $0.10 with increased selling volume, as it could indicate a broader sell-off.
Long-Term Accumulation: For long-term investors interested in HFT, wait patiently for price stabilization at or near support areas ($0.067 and $0.05) before gradually accumulating positions.
3. Consolidation between $0.10–$0.15 (Neutral Scenario)
A third possibility involves HFT price remaining range-bound, consolidating between the immediate support at $0.10 and resistance at $0.15. Such consolidation would represent market indecision as traders and investors await further market cues.
Pro Tips:
Range Trading: Employ range-trading techniques to profit from short-term price fluctuations between these clearly defined boundaries.
Observe Breakout Signals: Closely watch volume patterns, as increased volume accompanying a breakout from either end of the range could signify the next significant directional move.
Conclusion
Hashflow (HFT) has recently demonstrated significant volatility, creating multiple opportunities and risks for traders. By closely monitoring the outlined scenarios—particularly the critical levels of $0.10 and $0.15—and employing strategic risk management, traders can confidently position themselves to optimize potential returns. Always prioritize clear confirmation of market signals and adapt your strategies according to the unfolding price action.
🔥 Tips:
Armed Your Trading Arsenal with advanced tools like multiple watchlists, basket orders, and real-time strategy adjustments at Phemex. Our USDT-based scaled orders give you precise control over your risk, while iceberg orders provide stealthy execution.
Disclaimer: This is NOT financial or investment advice. Please conduct your own research (DYOR). Phemex is not responsible, directly or indirectly, for any damage or loss incurred or claimed to be caused by or in association with the use of or reliance on any content, goods, or services mentioned in this article.