HIVE: Bearish spike toward $0.0450The Macro Picture 🗺️
HIVE has been carving a descending macro structure since topping near $0.0950 in February — a one-directional grind that demands lower lows before it offers any real relief. The long-held $0.0600 shelf, the floor that capped every dip from March through May, finally gave way in June, and price has since settled into equilibrium near $0.0500. With each bounce sold into and the path of least resistance still pointing south, the macro floor at $0.0450 comes back into view.
The Setup ⚙️
The Support Flip: The $0.0600 level has flipped from structural floor to overhead resistance, exactly the kind of broken shelf that traps breakout traders on every weak rally. Bears are defending this zone, and as long as it caps price, sellers keep control of the structure.
The Squeeze: Price is coiling in a tight band around the $0.0500 Equilibrium, as the white projection shows — a local squeeze that rarely resolves upward inside a descending macro. With RSI hovering in the mid-40s, there is plenty of room before any oversold floor, so a flush meets little resistance.
The Accumulation Zone: A deeper flush toward $0.0450 opens a textbook pocket for staggered, averaging-based entries, where over-leveraged shorts get cleared and patient bids absorb the sweep.
The Roadmap: Primary target sits at $0.0450 — the local low and macro floor that desperately needs to be tested, a liquidity pocket where late longs get flushed before any structural reset. Invalidation: a sustained 1D close above $0.0600 would invalidate this bearish thesis and signal a flip back toward the broken shelf.
In-depth trading ideas
HIVE/USDT – Descending Trendline, Breakout or Another Rejection?HIVE/USDT on the 3D timeframe remains in a long-term downtrend structure, marked by a Descending Trendline connecting a series of lower highs since the peak in early 2025.
📉 Price is currently sitting at a critical area and is testing the descending trendline that has suppressed price action for months.
⚡ The more frequently a resistance level is tested, the greater the probability that it will eventually be broken.
🎯 This chart suggests that HIVE is currently in an accumulation phase after a prolonged decline, meaning a significant move could be approaching.
---
🔍 Pattern Formation
📉 Descending Trendline
The primary pattern on this chart is a Descending Trendline Resistance, formed since the price reached its peak around 0.68 USDT.
Pattern Characteristics:
✅ Lower highs continue to form
✅ Selling pressure is gradually weakening
✅ Volatility is decreasing
✅ Price is moving toward the apex of the trendline
📌 Conditions like these often represent the final stage of a downtrend before a major breakout or breakdown occurs.
---
🟢 Bullish Scenario
🟢 A bullish confirmation would occur if price successfully breaks above and closes strongly beyond the Descending Trendline.
🎯 Bullish Targets:
🚀 Target 1: 0.0685 USDT
🚀 Target 2: 0.0765 USDT
🚀 Target 3: 0.0890 USDT
🚀 Target 4: 0.1090 USDT
🌟 If the broader cryptocurrency market remains supportive, the 0.1090 USDT area could become the primary upside target following a breakout.
🔥 Bullish Supporting Factors:
✅ Long-term trendline breakout
✅ Lower-high structure begins to break
✅ Potential short-covering rally
✅ Extended accumulation phase
✅ Attractive risk-to-reward ratio for medium-term investors
---
🔴 Bearish Scenario
🔴 The bearish outlook remains valid as long as price fails to break above the trendline resistance.
If another rejection occurs at the trendline:
⚠️ Price may revisit the support zone around 0.0580 USDT
⚠️ A breakdown below support could trigger further selling pressure
⚠️ The long-term downtrend would remain intact
⚡ Risk Factors:
❌ Weak breakout volume
❌ Sharp correction in Bitcoin
❌ Failure to hold the current support area
❌ Formation of a new lower low
---
📈 Conclusion
🎯 HIVE/USDT is currently approaching one of the most important points in its market cycle.
📉 After experiencing a prolonged decline for more than a year, price is now trading directly beneath a major Descending Trendline Resistance, which could determine the next significant move.
🚀 A valid breakout could open the path toward:
➡️ 0.0685 USDT
➡️ 0.0765 USDT
➡️ 0.0890 USDT
➡️ 0.1090 USDT
⚠️ However, until a confirmed breakout occurs, traders should remain cautious of a potential rejection and continuation of the downtrend.
📌 The key focus right now is waiting for trendline breakout confirmation before anticipating a larger bullish expansion.
💡 "The bigger the base, the higher the space."
#HIVE #HIVEUSDT #Crypto 🚀 #Cryptocurrency #Altcoin #TechnicalAnalysis #CryptoTrading #Binance #PriceAction #TrendlineBreakout #BreakoutTrading #DescendingTrendline #BullishSetup #MarketAnalysis #ChartAnalysis #SwingTrading #Altseason #CryptoInvesting #TradingSetup
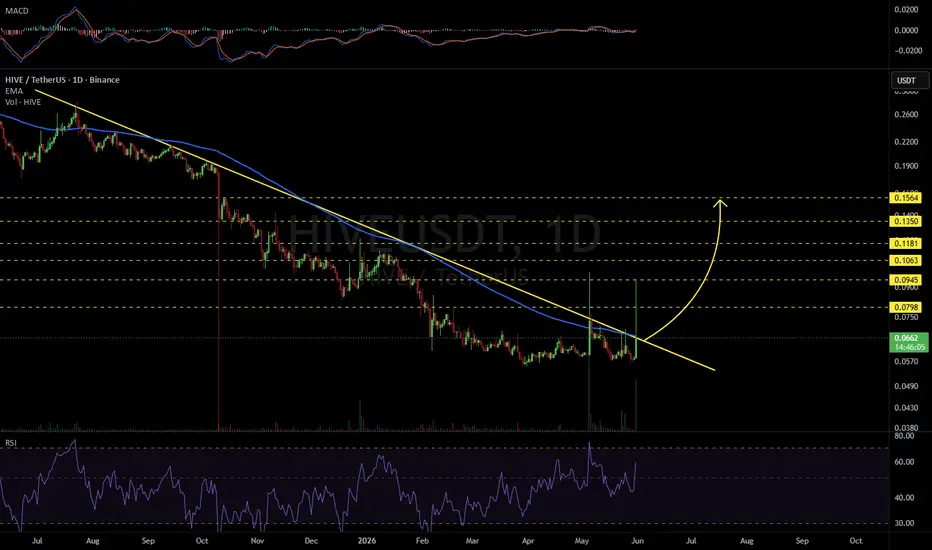
Hive About to Break-Up: New Bull Market (PP: 1,500%)HIVEUSDT continues to challenge resistance. The action is happening close to the all-time low with multiple sessions pushing higher. Pressure is being exerted by buyers. The same bottom range has been valid since February and was first activated in October 2025, a while back.
It is the same pattern all over again. There are many projects in this exact same situation. What to make of this market, bearish or bullish?
Bearish because of a major downtrend and bottom prices. Bullish due to a lack of new lows and a potential for a strong reversal. Bullish because many projects that were in this same situation already moved higher. Instead of breaking down, we have a very strong bullish breakout. HIVEUSDT is likely to do the same.
The latest bearish wave started January 2025 and ended only recently, this gives us an entire year of sustained bearish action. The all-time high happened December 2021, more than 4.5 years ago. After all this time, HIVE went through a full reset and this opens the doors for a new market cycle, long-term growth.
This chart shows the best possible situation, the accumulation phase. This market phase is reaching its end and the result will be the start of a new uptrend. It is getting very close. This is the second week with more than 60% within a single candle. The next one, HIVEUSDT will break-up.
Namaste.
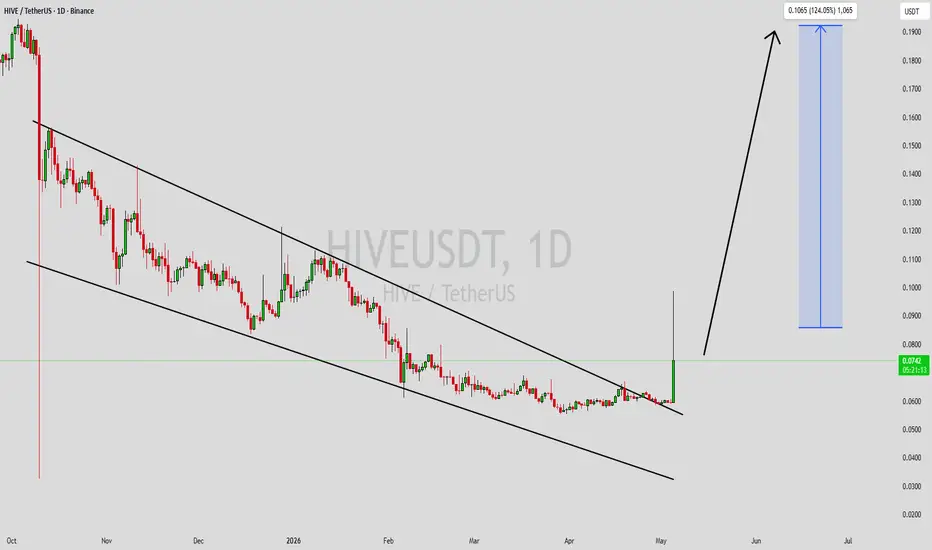
HIVEUSDT Forming Falling WedgeHIVEUSDT is forming a clear falling wedge pattern, a classic bullish wave signal that often indicates an upcoming breakout. The price has been consolidating within a narrowing range, suggesting that selling pressure is weakening while buyers are beginning to regain control. With consistent volume confirming accumulation at lower levels, the setup hints at a potential bullish breakout soon. The projected move could lead to an impressive gain of around 90% to 100% once the price breaks above the wedge resistance.
This falling wedge pattern is typically seen at the end of downtrends or corrective phases, and it represents a potential shift in market sentiment from bearish to bullish. Traders closely watching HIVEUSDT are noting the strengthening momentum as it nears a breakout zone. The good trading volume adds confidence to this pattern, showing that market participants are positioning early in anticipation of a reversal.
Investors’ growing interest in HIVEUSDT reflects rising confidence in the project’s long-term fundamentals and current technical strength. If the breakout confirms with sustained volume, this could mark the start of a fresh bullish leg. Traders might find this a valuable setup for medium-term gains, especially as the wedge pattern completes and buying momentum accelerates.
✅ Show your support by hitting the like button and
✅ Leaving a comment below! (What is your opinion about this coin?)
Your feedback and engagement keep me inspired to share more insightful market analysis with you!
Hive · 2024 vs 2026 & 446% Easy & 1,222% LongIt is a new week, the week is young...
HIVEUSDT is moving with the biggest weekly candle since late 2024.
What are the similarities between now and 2024?
» In August 2024 there was a marketwide low. After a period of consolidation, some three months, the market turned bullish, all altcoins.
» In February 2026 we experienced a marketwide low. After a period of consolidation, some three months, we are seeing the market turn bullish, all altcoins are likely to grow.
These are the similarities between now and then. It is the same all over again. It makes it easy to predict what is about to happen. It is not too late. It is still early.
Thank you for reading.
Namaste.
HIVEUSDT | Broke a Strong DowntrendHello traders,
As we can see, HIVE managed to break a strong downtrend line with a clear break of structure.
Price structure has started forming a bullish trend with quiet accumulation. Now it is ready for a push to the indicated targets after a pullback to demand zone
$0.1000
$0.1110
$0.1210
Good Luck!
HIVEUSDT Forming Falling WedgeHIVEUSDT is starting to attract notable attention from traders and investors who are seeking solid opportunities in the altcoin space. With good volume backing recent price movements, HIVE appears to be consolidating in a healthy range that could soon give way to an upward breakout. The project’s fundamentals, combined with its strong community engagement, make it an interesting prospect for short- to medium-term gains. Analysts are eyeing a potential price rally of around 40% to 50%+ if market sentiment remains supportive.
One of the key reasons behind the growing interest in HIVE is its consistent development activity and use case within the decentralized social media and content creation space. As blockchain-based social networks gain momentum, HIVE stands out as a pioneer with an active user base and proven on-chain activity. This makes it a compelling option for investors who want exposure to utility-driven tokens with tangible adoption.
On the technical side, traders should watch for breakouts above significant resistance levels and monitor how volume behaves during these moves. A strong surge in buying activity could confirm that bullish momentum is taking over, offering an attractive risk-reward setup. With the broader crypto market showing signs of recovery, HIVE’s setup looks promising for traders looking to capture gains in the coming weeks.
✅ Show your support by hitting the like button and
✅ Leaving a comment below! (What is You opinion about this Coin)
Your feedback and engagement keep me inspired to share more insightful market analysis with you!
HIVE: When To, How To?I've been tracking HIVE for a while and now I want to show it to you, it will be a good money maker if you decide to "jump in." Let's go back to some basics signals.
HIVEUSDT Technical Analysis
In August 2024 we have the main low and subsequent higher low in November. In 2025 we have a long-term higher low, April & June and also a double-bottom. That's the classic.
The higher low points to a higher high for the new bullish wave that will develop in the coming days and weeks; the double-bottom points to the low being in and current prices being good for a trade setup with low risk vs a high potential for reward.
When to sell
I have a friend and he is a scientist, he asked, "Hey Alan, when should I sell? Should I go for 400% or 660%?" It is always the same question.
I said, "You can do whatever you want of course..." He wasn't satisfied. Imagine, the scientific mind. "Yes, but how do I know if the right target is the one where you placed 400% or the 660%?" He said. You know, the scientific mind is never satisfied unless supplied with specific answers.
"Well..." I am preparing myself to give a reply that will require no additional questions. "How you approach the targets will fully depend on your trading style, that is, your goals, your capital, your risk tolerance and how confident you feel about my analysis, the targets and the chart."
"What?" Listen, you just buy and hold and contact me after three months. You'll know what to do when prices are up... Just kidding of course.
Namaste.
Hive Breaks Above Resistance, Easy 190% Jump In The MakingI don't have to describe the signals because it is already happening, the results will speak for themselves.
I have to describe the signals because we cannot post a chart without adding some text. So some times you will see me writing just to meet the requirements but I would just love to say, "It is going up."
Sometimes no words can give a stronger message than too many words, but the rules say that we have to write so, here we go:
» HIVEUSDT is trading within a long-term higher low. Long-term for me is 6 months or more for Cryptocurrency pairs, and here the main low happened in early November 2024, so this higher low can be called long-term. Of course, the second low happened recently, 7-April 2025, when the correction reached its end marketwide.
» A broken downtrend, based on an internal trendline and a move above resistance is also taking place. I can guess a strong RSI and move and close above some moving averages, in this case, EMA34 has been conquered.
» A nice and easy 190% bullish jump is in the making, this can happen within days or weeks, short-term. Within 30 days (one month). There will be more growth but this is for another day. This chart analysis is for those trading short-term.
Namaste.
#HIVEUSDT is maintaining a bearish structure📉 Short BYBIT:HIVEUSDT.P from $0.2424
🛡 Stop loss $0.2455
🕒 1H Timeframe
⚡️ Overview:
➡️ The POC (Point of Control) is at 0.2527, marking the area with the highest trading volume and now acting as major resistance.
➡️ The 0.2455 level serves as local resistance — price has already started to decline from that zone.
➡️ Price BYBIT:HIVEUSDT.P is steadily moving lower and staying below volume clusters, confirming the bearish structure.
➡️ A breakdown below $0.2424 could lead to acceleration toward target zones.
🎯 TP Targets:
💎 TP 1: $0.2399
💎 TP 2: $0.2379
💎 TP 3: $0.2366
📢 Watch for confirmation of the $0.2424 breakdown — it’s key for continuation.
📢 If price reclaims $0.2455, the short setup becomes invalid.
BYBIT:HIVEUSDT.P is maintaining a bearish structure — expect quick target reaction if the signal confirms.
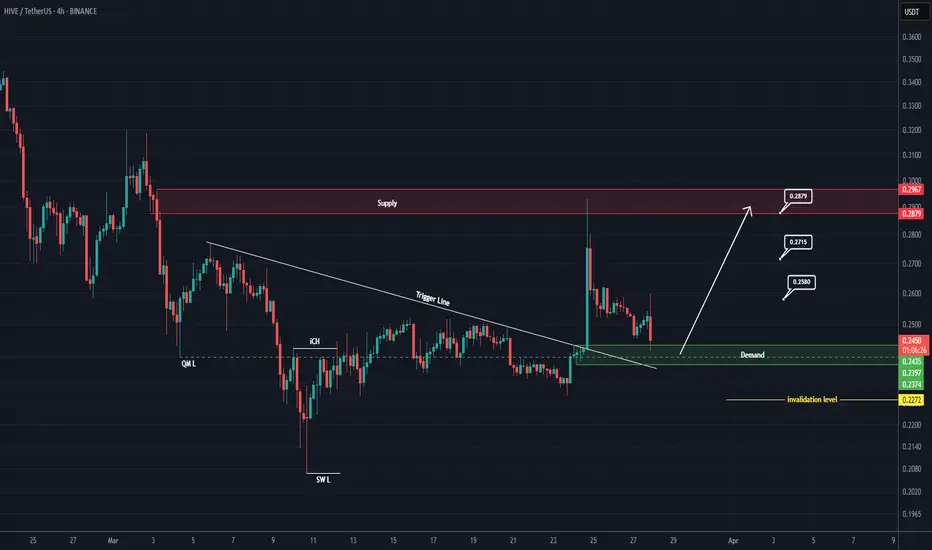
HIVE buy/long setup (4H)Two trigger lines have been broken, and there is a bullish iCH on the chart. We have also seen a strong move, and at the origin of this move, buy/long positions can be considered.
This setup is mostly suitable for spot trading.
Targets are marked on the chart.
The closure of a 4-hour candle below the invalidation level will invalidate this analysis.
For risk management, please don't forget stop loss and capital management
When we reach the first target, save some profit and then change the stop to entry
Comment if you have any questions
Thank You
HIVEUSDT – Support & Resistance Levels Marked! Time to Make Some Money – But Smartly! 🔥
📊 Key Levels to Watch:
🟢 Green Box = Strong Support – This is where buyers may step in.
🔴 Red Box = Major Resistance – Sellers are likely waiting here.
💡 The Plan:
✅ At Support? – Look for LTF bullish confirmations & CDV divergence before entering long.
✅ At Resistance? – Wait for LTF breakdowns & CDV confirmation for potential short plays.
✅ Break & Retest? – If price breaks a level with volume, trade the retest—not the breakout itself.
📌 Final Words:
Patience + Confirmation = Profitable Trades. We don’t gamble, we execute!
🚀 Follow me for high-probability setups—let’s get this money! 🔥
✅I keep my charts clean and simple because I believe clarity leads to better decisions.
✅My approach is built on years of experience and a solid track record. I don’t claim to know it all but I’m confident in my ability to spot high-probability setups.
✅If you would like to learn how to use the heatmap, cumulative volume delta and volume footprint techniques that I use below to determine very accurate demand regions, you can send me a private message. I help anyone who wants it completely free of charge.
🔑I have a long list of my proven technique below:
🎯 ZENUSDT.P: Patience & Profitability | %230 Reaction from the Sniper Entry
🐶 DOGEUSDT.P: Next Move
🎨 RENDERUSDT.P: Opportunity of the Month
💎 ETHUSDT.P: Where to Retrace
🟢 BNBUSDT.P: Potential Surge
📊 BTC Dominance: Reaction Zone
🌊 WAVESUSDT.P: Demand Zone Potential
🟣 UNIUSDT.P: Long-Term Trade
🔵 XRPUSDT.P: Entry Zones
🔗 LINKUSDT.P: Follow The River
📈 BTCUSDT.P: Two Key Demand Zones
🟩 POLUSDT: Bullish Momentum
🌟 PENDLEUSDT.P: Where Opportunity Meets Precision
🔥 BTCUSDT.P: Liquidation of Highly Leveraged Longs
🌊 SOLUSDT.P: SOL's Dip - Your Opportunity
🐸 1000PEPEUSDT.P: Prime Bounce Zone Unlocked
🚀 ETHUSDT.P: Set to Explode - Don't Miss This Game Changer
🤖 IQUSDT: Smart Plan
⚡️ PONDUSDT: A Trade Not Taken Is Better Than a Losing One
💼 STMXUSDT: 2 Buying Areas
🐢 TURBOUSDT: Buy Zones and Buyer Presence
🌍 ICPUSDT.P: Massive Upside Potential | Check the Trade Update For Seeing Results
🟠 IDEXUSDT: Spot Buy Area | %26 Profit if You Trade with MSB
📌 USUALUSDT: Buyers Are Active + %70 Profit in Total
🌟 FORTHUSDT: Sniper Entry +%26 Reaction
🐳 QKCUSDT: Sniper Entry +%57 Reaction
📊 BTC.D: Retest of Key Area Highly Likely
📊 XNOUSDT %80 Reaction with a Simple Blue Box!
I stopped adding to the list because it's kinda tiring to add 5-10 charts in every move but you can check my profile and see that it goes on..
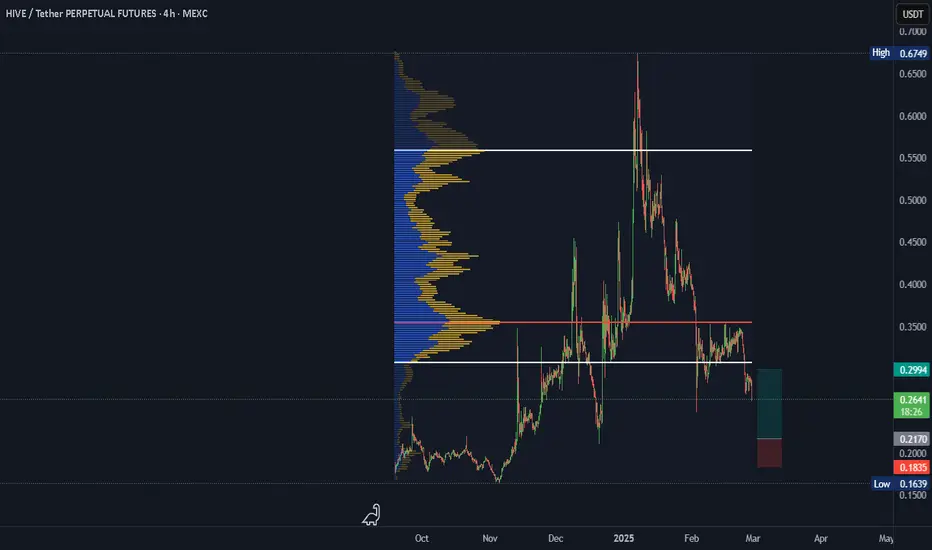
HIVE LONG SETUP ALL trading ideas have entry point + stop loss + take profit + Risk level.
hello Traders, here is the full analysis for this pair, let me know in the comment section below if you have any questions, the entry will be taken only if all rules of the strategies will be satisfied. I suggest you keep this pair on your watchlist and see if the rules of your strategy are satisfied. Please also refer to the Important Risk Notice linked below.
Disclaimer
HIVE LONG SETUP
ENTRY : 0.2170
PROFIT : 0.2994
STOP : 0.1835
HIVEUSDT Sees 570% Daily Volume Spike! Next Big Move!?HIVEUSDT Analysis
Massive Volume and Key Bullish Zone
"HIVEUSDT is making waves with a 570% daily volume increase. This kind of surge doesn’t go unnoticed, and neither should these levels."
Why It’s Exciting:
Blue Box Zone: Around the blue box, I see a prime opportunity for bullish entries. These levels? Far from bad – they look great.
Volume Surge: This explosive volume increase is a clear sign of strong market interest and potential upside momentum.
Key Observations:
"As always, I’ll wait for confirmation with upward market structure breaks on lower time frames, supported by CDV and volume profile. The blue box isn’t just a zone – it’s a strategy."
This is shaping up to be a fantastic trade setup. Don’t miss the chance to act on strength and data! 🚀
Let me tell you, this is something special. These insights, these setups—they’re not just good; they’re game-changers. I've spent years refining my approach, and the results speak for themselves. People are always asking, "How do you spot these opportunities?" It’s simple: experience, clarity, and a focus on high-probability moves.
Want to know how I use heatmaps, cumulative volume delta, and volume footprint techniques to find demand zones with precision? I’m happy to share—just send me a message. No cost, no catch. I believe in helping people make smarter decisions.
Here are some of my recent analyses. Each one highlights key opportunities:
🚀 RENDERUSDT: Strategic Support Zones at the Blue Boxes +%45 Reaction
🎯 PUNDIXUSDT: Huge Opportunity | 250% Volume Spike - %60 Reaction Sniper Entry
🌐 CryptoMarkets TOTAL2: Support Zone
🚀 GMTUSDT: %35 FAST REJECTION FROM THE RED BOX
🎯 ZENUSDT.P: Patience & Profitability | %230 Reaction from the Sniper Entry
🎯 DEXEUSDT %180 Reaction with %9 Stop
🐶 DOGEUSDT.P: Next Move
🎨 RENDERUSDT.P: Opportunity of the Month
💎 ETHUSDT.P: Where to Retrace
🟢 BNBUSDT.P: Potential Surge
📊 BTC Dominance: Reaction Zone
🌊 WAVESUSDT.P: Demand Zone Potential
🟣 UNIUSDT.P: Long-Term Trade
🔵 XRPUSDT.P: Entry Zones
🔗 LINKUSDT.P: Follow The River
📈 BTCUSDT.P: Two Key Demand Zones
🟩 POLUSDT: Bullish Momentum
🌟 PENDLEUSDT.P: Where Opportunity Meets Precision
🔥 BTCUSDT.P: Liquidation of Highly Leveraged Longs
🌊 SOLUSDT.P: SOL's Dip - Your Opportunity
🐸 1000PEPEUSDT.P: Prime Bounce Zone Unlocked
🚀 ETHUSDT.P: Set to Explode - Don't Miss This Game Changer
🤖 IQUSDT: Smart Plan
⚡️ PONDUSDT: A Trade Not Taken Is Better Than a Losing One
💼 STMXUSDT: 2 Buying Areas
🐢 TURBOUSDT: Buy Zones and Buyer Presence
🌍 ICPUSDT.P: Massive Upside Potential | Check the Trade Update For Seeing Results
🟠 IDEXUSDT: Spot Buy Area | %26 Profit if You Trade with MSB
📌 USUALUSDT: Buyers Are Active + %70 Profit in Total
🌟 FORTHUSDT: Sniper Entry +%26 Reaction
🐳 QKCUSDT: Sniper Entry +%57 Reaction
📊 BTC.D: Retest of Key Area Highly Likely
This list? It’s just a small piece of what I’ve been working on. There’s so much more. Go check my profile, see the results for yourself. My goal is simple: provide value and help you win. If you’ve got questions, I’ve got answers. Let’s get to work!
HIVE / TetherUS 2x potencialHello guys, this is my smart idea.
What Is Hive (HIVE)?
Hive (HIVE) is a blockchain running on a delegated proof-of-stake (DPoS) consensus mechanism. It launched in March 2020 as a hard fork of the centralized Steem blockchain and as a gateway from Web 2.0 to Web 3.0. The blockchain claims to offer “lightning-fast processing times and fee-less transactions.” Examples of use cases include social media with monetized rewards for content creators, interactive blockchain games, identity management, micro-loans and more. The platform powers decentralized applications (dApps) like Splinterlands, PeakD and HiveBlog.
Total supply: 500.74M HIVE
Max. supply: ∞ unlimited
Circulating supply: 500.74M HIVE
Price prediction?
Long, this year the price may jump to 0.90 usdt.
Good entry price now, or 0.30 usdt maybe lower.
This is only my idea guys.
This is not financial advice !
Please do your analysis and consider investing !! Thanks
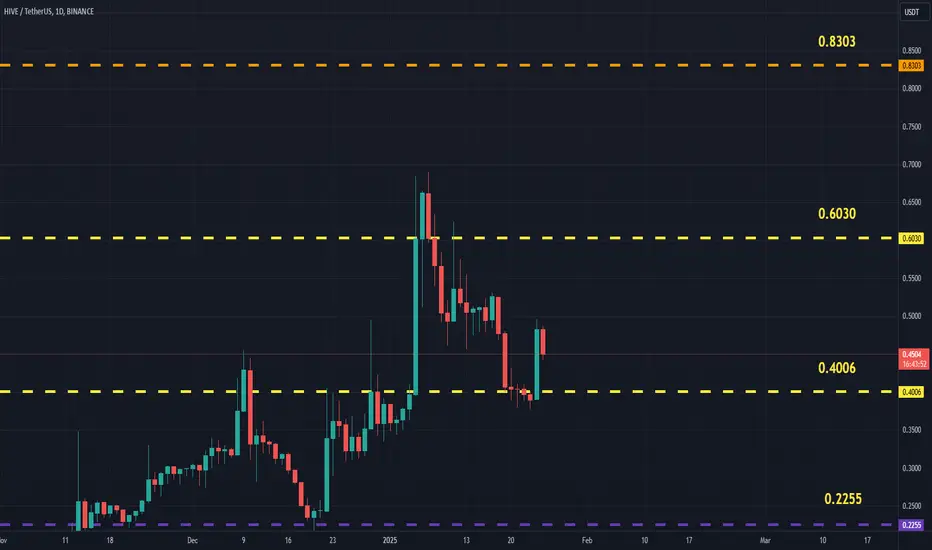
HIVEit seems that the area of 0.45$ it is a very strong support for hive, so if the resistance are of 0.5150 will be broken, i could say that if also market conditions are positive we could see a spike of 80-90% of pump, if so it will be much clear tonight after midnight or tomorrow early to see how the market will work...
NFA
please trade very carefully